CHAPTER OVERVIEW
This chapter concentrates on those elements that have far-reaching impact on your graphics production but often get overlooked. Here, we return to the task of assessing the learning environment or landscape first introduced in Chapter Two. We look at the design decisions that need to be made early in the process because they also affect subsequent graphics development. These include decisions about the following:
Learner profile
Learning environment
Delivery media and platform
Production issues, including the equipment, formats, and even schedules
In e-learning, programming issues are also part of production, so in this chapter we outline some of the issues about programming that can affect your graphic design. In sum, this chapter explores what you need to find out or decide at project startup.
In reality, you may not have control over all design and technical decisions. Still, understanding the questions to ask at the beginning can help you develop graphics that will work in the learning environment. You'll be able to avoid spending time you don't have on fabulous ideas that havent a prayer of being executed because of technical or production restraints.
The standard Instructional Systems Design (ISD) development process tackles such issues right at startup, during theanalysis phase of the project. With graphics, though, it's especially important to factor in the practical considerations, particularly cost and schedule, that leave you less wiggle room than you may be accustomed to.
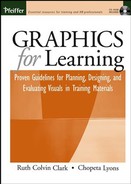
If you have never before been involved in the graphics end of design, it's helpful to review the ISD process and identify the points at which graphic elements should be determined, designed and produced. Treating your graphics development systematically ensures that they are an integral part of the final product and not just pretty decorations tacked on at the end. Figure 16.1 illustrates where graphics decisions occur in the typical ISD process.
Along with identifying the goal of the instruction, you also need to gather information about the learners who will use it as well as where and how they will do so.
Start by analyzing the learner. Identify all the characteristics that might have influence on your graphics. These characteristics include prior knowledge of the content, visual acuity, nationality, geographic location, first language, and so forth (see Table 16.1). The results of your investigation may have a startling impact on your overall display framework as well as the individual graphics. For example, as mentioned in Chapter Ten, in many experimental studies, visuals that are congruent with text benefit low prior knowledge learners more than they benefit high prior knowledge learners.
Identifying the cultural background of your learner is also critical to your graphic design. Colors and symbols can inadvertently add connotations that you might not intend. Red in some Asian cultures is associated with prosperity and good luck. In many western cultures, however, red is used for alarms, alerts, and danger warnings. Luck or Danger? Thus, instead of helping, a color can confuse, especially if used for cuing. Symbols, which are essential metaphors, must also be used carefully. The charitable organization known as the Red Cross in the western world is the Red Crescent in Turkey, because of the religious connotations of the medical cross shape in some Arabic countries. Scrutinize any visual analogy or metaphor that you use for unintended localized meanings. Strive instead for universality. If a high percentage of your learner population is from a culture with which you are not familiar, it pays to get some help with localization issues such as color, symbols, and the space needed for text that will appear in a different language. The American Institute of GraphicsArtists sponsors a forum dedicated to graphic design across cultures.
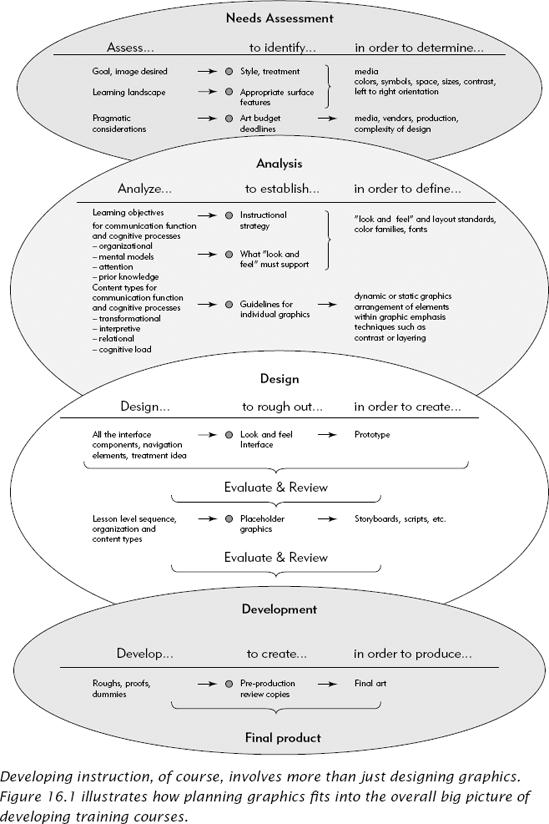
Table 16.1. Key Learner Profile Characteristics to Consider.
Characteristics | Examples |
|---|---|
Age | 12, 22, 32, 52 |
Localization | Country, language, culture |
Gender | Male or Female |
Demographics | Rural or urban |
Education | High school diploma Bachelors Masters PhD or Medical degree Post doctorate |
Socio-economic group | British class system Indian caste system American economic quintiles (upper fifth, etc.) Intelligensia |
Vocations | Teacher Mechanical engineer Physician |
Avocations | Gardening Music Video games |
Other identifiable class-wide features | Refugee population Military background |
Prior knowledge | Low, high, or mixed |
Accessibility issues | Limits on sight, hearing, mobility, etc. |
If the instructional piece will be translated, your design may need additional white space to accommodate translation length. As just one example, Figure 16.2 illustrates the additional real estate required when translating Englishto French. The French version can require as much as one-third more space than the English. If your design needs to be translated, be sure to allow extra space for all elements, including space on graphics for labels, callouts, pop-ups or captions.
In Chapter Two, we also introduced the need to consider the learning landscape. During analysis, identify exactly where a learner needs to have the instruction available—as the instructional piece may end up as a job aid and not in a lesson at all. Perhaps the materials need to be always visible to learners whose hands are anchored to the keyboard entering data and unable to easily leaf through a manual without losing time and efficiency. Sometimes, the instructional material should be displayed on the equipment itself. A job aid on how to change a printer cartridge is best displayed at a location handy to the task, rather than in the top drawer of someones desk. Perhaps a graphic is to be used in synchronous online or classroom learning environment. In these "real-time" situations, there are fewer demands on your graphic designs because instructors can verbally add information or address questions from the learners. Yet, when the delivery is asynchronous, be that through book, film, or e-learning, the graphics need to be as self-explanatory as possible. Your investigation of the learning landscape will lead you to decisions about media, size and layout, contrast, and boldness of the design. Table 16.2 provides some questions to get you thinking about the conditions in which the instructional materials will be used.
As we noted in Chapter Two, all instruction is delivered through some sort of medium: book, VCR, computer monitor, wall chart, or laminated job aid. Occasionally, you may control the medium, such as an individual wall chart or a page in a participant's guide. Other times, the media are not under your control, such as the video player, screen resolution, monitor quality, and color capabilities of the computer monitor on which an e-learning course must display.
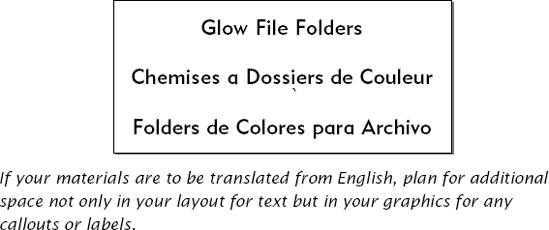
Also, sometimes the same instructional program is destined for several delivery media—book, Web, video, and job aid—which affects design and layout. A graphic separated from its explanatory text in a book (where the learner can at least flip back and forth between the pages for viewing simultaneously) is less damaging to learning than the same graphic separated from its explanation in e-learning. And even if the materials are only destined for e-learning, are they to be delivered at the desktop in the work environment, accessed over the Internet from home, potentially on a dial-up connection, or even projected on a screen at the front of a classroom? The size of the graphic in this situation needs to accommodate both close viewing and viewing from a distance. Knowing this need for flexibility at the onset of the design process allows you to plan effectively to accommodate all the intended delivery media, with the littlest possible compromise tothe instructional integrity of the graphics. As just one example, it may save you from the common mistake of "borrowing" a small graphic, perhaps originally intended for viewing on the Web, then stretching it to fit a screen projection in a classroom, because otherwise it might be too small to read. If this second medium (large screen projection) is not anticipated, the original graphic may be in a format that when the training professional stretches it to be legible onthe large screen, the graphic gets the "jaggies" (see Figure 16.3).
Table 16.2. Basic Questions to Ask About the Learning Environment.
Describe the Learning Environment Where the Instructional Material Is to Be Used. |
How is the package to be used?
|
How many people who share space, visually and aurally? |
What uniform or dress is required by the job? |
Any special equipment that impacts the learning environment? |
What is the lighting in the room? (Will the room be darkened for a presentation, perhaps making it difficult for the learners to see their individual materials?) |
How far away is the fartherest learner from the materials? |
How much time does the learner have with the materials? |
Will the learner be able to control his or her own time looking at the materials? |
How much space does the learner have to spread out materials? |
In a classroom-type setting, what is the typical room layout? |
Are there other environmental issues to be considered, such as air circulation, temperature? (Will air movement disturb learning materials while the learner is attempting to perform a procedural task?) |
On the other hand, had this secondary delivery medium been identified, a different file format might have been chosen, preventing either the distortion of the graphic or the additional time spent redoing it to accommodate a different media. Unfortunately, as much as we want it, there is no one size fits all...even with graphics.
Use the questions in Table 16.3 to start your assessment of the delivery mechanisms. Just the process of going through the questions systematically will get you thinking about how your instructional graphics will be displayed.
Table 16.3. Questions to Ask About the Delivery Media.
If projected at the front of a classroom
|
If appearing in a book or guide
|
If appearing on a flip chart, bulletin board, or whiteboard in a classroom or work environment
|
If displayed on the learner's computer monitor
|
|
|
Also, if your project is e-learning, you will need another, more specific pass at the technical platform parameters, such as the browser versions that need to be supported, hardware configurations, and any other restrictions from the Information Technology (IT) department (see Table 16.4). If you are involved with e-learning and are responsible for planning graphics, you need to know at least some of the basics about the technical restrictions of your project before you begin to think about color, shape, size, or animation of your graphics.
In development, the mantra, "Start at the end and work backwards," applies to more than just the schedule, but to all aspects of how the final product will look. During analysis, identify production issues that can impact the design of your graphics. In addition to practical considerations such as budget, other items—production equipment, format of files required by the production house, and the schedule—can alter your graphic designs. If your instruction will be delivered online, also assess the programming approach that will be used to produce your training course.
Production equipment also influences design choices. If you are limited to the production equipment your organization currently owns, you may find your graphic vision constrained by the realities of production quality, especially in the case of older machinery. You can get reproduction proofs before the print run, but sometimes you need to know the quality long before the proof stage. One organization, aware of its aging print shop equipment, chose to rely exclusively on line art for their instruction guides, rather than on photographs. It knew the quality of the print runs would not be good enough to support the color depth and detail the photographs had to convey. Table 16.5 provides a translation guide for discussions about color. The key point is that the higher the number of colors (color depth), the more detail the graphic can support, but at a cost of a larger file size—which may impact display in terms of an e-learning module.
Table 16.4. Questions to Ask About e-Learning Platforms.
Characteristics | Definition | Examples | If Not Considered |
|---|---|---|---|
Monitor Display | Type Resolution the computer is set to display: Expressed in number of pixels (picture elements) by width and height Impacts the visual size of the graphic | Light Emitting Diode (LED) or Cathode Ray Terminal (CRT)Common resolutions: 640 × 480 800 ×600 1024 ×768 | Depending on the viewer's perspective, the LED may wash out distinctions between colors. If e-learning is designed for 800 ×600 but displayed in 600 ×480, only a portion of the screen is displayed. Especially odious if navigational controls are in part of the screen "cut off." |
Color Depth | Number of colors displayed | Common depths: 16 256 16 bit high color 24 bit true color | If discriminations are based on subtle differences between colors seen only in high color, learning for viewers at lower color depths is compromised. |
Connectivity | Speed at which images and text are displayed Impact the speed of delivery | Local (standalone or local area network) Dial-up (14 kilobytes up to 56 kilobytes per second)Broadband | Elaborate graphic that consequently is a big file may display too slow to be seen simultaneously with the text or audio that explains it |
Media Cards Plug-Ins | Hardware that provides audio and video capability Software that provides capabilities beyond the standard browser | Common current plug-ins are Flash Player Media Player Real Player | Many corporations prohibit plug-ins, so training components dependent on animation or audio delivered through plug-ins will not work. (Override of newer versions with older versions of plug-ins, etc.) |
Firewalls | Security software that monitors incoming and outgoing traffic from the local computer or network | Links to external sites and resources may not work, if restricted by firewall. May prevent media elements from playing. |
Table 16.5. Color Depth.
Bits-Per-Pixel (amount of color information) | Maximum Number of Colors (color depth) |
|---|---|
1-Black and White | 2 |
4-Four Bit color | 16 |
8-Eight Bit, 256 color or "Palletized" | 256 |
8-Grayscale | 256 (254 shades of gray, black and white) |
16-Sixteen Bit or High Color | 32,768 or 65,536 (depending on format) |
24-Twenty-Four Bit or True Color | 16,777,216 |
32-Thirty-Two Bit | 16,777,216 |
Anyone making last-minute handouts at the local dairy mart photocopier probably has first-hand experience about equipment and print run. For these reasons, whenever your materials include photographs or elaborate graphics to be reproduced, you'll want to check for contrast between gray tones. When we sent samples of the graphics for this book to our reviewers, we made this same common error—and for some of our e-learning screen captures, all our readers could see were smudgy black rectangles, because reproduction equipment could not handle the detail our graphics included. Lesson learned? Even though these were just review drafts, we knew we needed to use different examples for this book.
In this electronic age, almost all art for reproduction is delivered in digital format. There are rare exceptions, but most likely you will be working with a digital file, whether it is an Acrobat PDF file or a high-resolution graphics file ready for final print runs. You can save yourself a lot of headache if you establish early the necessary format. In general, vector graphics—such as corporate logos to be used in different sizes—are scaleable; they can be stretched without losing detail. Raster graphics—such as photos or software screen captures—also can be scaled, but they will lose detail and may get distorted. New formats attempt to bridge this gap; for example, the png format was designed as a scaleable raster format that reduces the loss of detail.
Table 16.6 outlines the types of formats that are most commonly used for the various media. But note, these are not hard and fast rules, especially with the speed that technology continues to increase our options.
As anyone guilty of creating "jaggies" probably knows, graphic formats can be mechanically converted using the export or conversion features available in most commercial graphics packages. For example, a high-resolution (such as an eps) file originally intended for print can be "saved out as" a lower color and resolution (such as a gif) file for a Web page. Unfortunately, the ease of this mechanical conversion makes it simple to distort graphics beyond their original intent. As always, depending on the production quality required, some distortion may be acceptable, but be sure the alteration does not compromise the graphic's communication of the instructional point.
As a case in point: a rich, high-color, high-resolution graphic that clearly delineates the individual gradations ofcorrosion on a boiler pipe may lose all such definition if reduced to a file that has lower color depth (less color information stored) such as a gif file. Be aware that when you convert down in resolution and size, you lose definition. And if definition is critical to your instruction, you may wish to choose a different graphic. Moving up in size and resolution can also distort graphics. As you enlarge a graphic, you magnify its existing properties, a process less forgiving to raster graphics.
Some of the file types listed in Table 16.6 come in various flavors or sub-formats. You may never have to make decisions about your graphics at this level, but in case you get involved in an acronym-hurling debate with a design team, Tables 16.7 and 16.8 provide you a vocabulary to understand the acronyms as they relate to the properties of graphics.
Table 16.6. Some Digital File Formats and Their Uses
If You Are Building for This: | Use These Graphics File Formats | |
|---|---|---|
Raster or "bit map" files | Vector or "draw" files | |
Portable document | .jpg, .gif, .bmp, .png | .ai, .eps, .emf, .wmf |
Slide Show | .jpg, .gif, .bmp | .ai, .wmf, .emf |
.tif, .jpg, .bmp | .ai, .eps, .emf, .wmf, .dxf, .wpg, cgm | |
CD-ROM | .gif, .bmp, .jpg | .ai, .wmf |
WEB | .gif, .jpg, .png | .swf, .spl, .svg |
Legend | |
|---|---|
Extension | Stands For: |
Jpg, jpeg | Joint Photographic Expert Group |
Gif | Graphics Interchange Format |
Bmp | BitMaPped format |
Png | Portable Network Graphics |
AI | Adobe Illustrator® |
Eps | Encapsulated PostScript |
Emf | Windows Enhanced MetaFile |
Wmf | Windows Meta File |
Cgm | Computer Graphics Metafile |
Dxf | Data eXchange File |
Wpg | WordPerfect™ Graphics format |
Swf | Flash™ movie/animation format |
Spl | Flash movie/animation format |
Svg | Scaleable Vector Graphic |
Tif | Tagged Information Format |
Table 16.7. Raster or Bitmapped File Formats.
File Type | Sub Formats | Color Information | Intended Use |
|---|---|---|---|
BMP | RGB or Run Length Encoding (RLE) | 1, 4, 8, 24 bit | Uncompressed, retains all color information and can be used in documents, slide shows, etc. Not intended for Web delivery. |
GIF | Interlaced, Non-interlaced, transparent background | 1, 4, 8 bit | Compressed solid color graphics with a maximum of 256 colors for Web or CD delivery (often a .bmp will be reduced in color and saved as a .gif for Web delivery) |
JPG (jpeg) | Compressed, Progressive | 8 bit grayscale, 24 bit | Photos or continuous tone graphics for print or Web. |
PNG | Interlaced or Non-Interlaced Network Graphic | 1, 4, 8, 24, 32 bit | Web or portable document delivery. |
TIF (tiff) | Huffman Compressed, uncompressed, CMYK compressed and uncompressed Lemple-Zif-Welch (LZW) compressed LZW compressed CMYK Fax group 3 and 4 | 1, 4, 8, 24 bit depending on subformat | Graphics and photos. Mostly used for print or portable document. |
Table 16.8. Vector-Based File Formats
File Type | Format/Subformats | Color Information | Intended Use |
|---|---|---|---|
Digital graphics file types can have many subformats, for example uncompressed or compressed type of compression RGB (Red, Green, Blue), or CMYK (Cyan, Magenta, Yellow, Black). | |||
AI and EPS | Adobe Illustrator® and Encapsulated Post Script Illustrator® or 88, 3,5, etc. EPS levels 1, 2, etc. | The formats range from 1, 8 (Grayscale) to 24 and 32 bit color | Solid or continuous tone graphics for print, portable documents, converted ("exported") to a bit map format for Web use. Can be imported into programs like Flash for Web delivery. |
FH7, FH8 etc. | Freehand | Solid or continuous tone graphics for print, can be imported into programs like Flash for Web delivery. | |
WMF | Microsoft Windows Metafile | Solid or continuous tone graphics for print, portable document, presentation, Web or CD delivery (often a .bmp will be reduced in color and saved as a .gif for Web delivery). | |
SVG, SVGZ | Scaleable Vector Graphics (SVGZ is a compressed format) | 8, 16 bit | Web delivery |
SWF, SPL | Flash Movie or drawing | Up to 24 bit compressed jpg for embedded bitmaps | Web delivery |
CDR | CorelDraw native format (can be converted/exported to AI/EPS or bit map formats) | ||
CGM | Computer Graphics Metafile | ||
DRW | Micrografx Draw native format | ||
DXF | AutoDesk native format | ||
EMF | Windows Enhanced Metafile | ||
HGL | Hewlett-Packard Graphics Language | ||
PCT | Apple | ||
PIC | Lotus | ||
WPG | WordPerfect™ | ||
If there is a deadline, there is a schedule. The production of different types of art have various lead time requirements, but there is probably a wide range among vendors with whom you may work. Obviously, in-house art production may have faster turn-around. Find out what lead time is needed. If you don't, you may be caught without enough time to make final, critical changes.
In e-learning, programming is also part of the production effort, which culminates in publishing the materials to the host site, uploading them to a LAN server, or burning them onto a CD. The programmer also blueprints the functionality of the program and designs the inter-relationships between the functioning parts. Sometimes, e-learning courses are a part of an organization-wide offering. These organizations often want all the online courses to have the same general look and feel since the courses are to be accessed through a common portal. The portal itself may be as simple as a single Web page course catalog or as complicated as a full-featured Learning Management System (LMS). Thus, the programmer may need to design to established technical standards. These may seem of little concern to you, but technical standards impact how a course is structured, which in turn can impact screen real estate as well as the size, orientation, and even how the learner experiences your graphics.
Programming the Structure. There are several influential sets of guidelines currently referenced in the online training industry, including these two:
AICC Compliance applies to any online course, not only those disseminated via the Web. CBT and multimedia that are delivered by CD or even a legacy mainframe can be designated AICC Certified or Designed to AICC Guidelines. Note that although the AICC guidelines and recommendations concentrate on technical and interface issues, they also govern the use of icons and instructional chunking.
The SCORM is a collection of specifications based on other guidelines (including the AICC) that provide some standardization for instructional content delivered via the Web. Currently, these are technical specifications, but they can have considerable impact on course-wide graphics determination. Central to the SCORM is the delineation of what is a uniquely addressable learning object, or what is the size of the smallest discrete (addressable) component. This standardization is so that a Learning Management System (LMS) can keep and track learner progress information. The design of your graphical interface is, in part, driven by total number of levels of granularity within the course. (In other words, the total number of levels in the course's organizational hierarchy—curriculum, module, course, unit, lesson, topic, subtopic, page.) Since SCORM compliance may influence some graphic design, ask if your course needs to be SCORM compliant at the beginning of your project.
There are also several other international standards for digital images, though they do not have the direct impact on e-learning design that SCORM does. However, they may affect the technical aspects of the graphics you wish to use or display. The International Organization of Standards (ISO) and the World Wide Web Consortium (W3C) publish technical standards for international symbols, for Virtual Reality Modeling Language (VRML) as the basis of three-dimensional content in MPEG-4, and the properties and attributes of Computer Graphic Metafiles (CGM) for the Web. The resources at the end of this chapter indicate where you can find out more about AICC, SCORM, and Web standards.
Finally, if you don't know, find out about how the instruction will be programmed. Often, the production programmers or coders have a different level of expertise than the programmer analyst who creates the structure. This division of labor may have some unintended consequences for you, especially in terms of the graphics you specify. In this era of globalization, it is quite possible that your instructional materials may be assembled by individuals from another country, with a different first language. If so, you'll need to be very specific in your instructions for graphics.
Deciding or finding the answers to these learning landscape questions will help prevent outcomes such as graphics that are too big to display or too small to be read. Answering questions about production can prevent you from poor reproduction qualities that diminish the instructional integrity of the graphic. E-learning has its own private cemetery of dead projects where the designers neglected these considerations. One company designed an elaborate multimedia interface that ended up requiring distribution on a CD rather than through their Intranet. So they pressed 15,000 copies only to realize too late that, as a matter of corporate policy, there were no CD drives on the company's computers. The CDs, of course, were unusable.
Now that you have defined the context for the instruction, you are ready to plan your visual approach. The next chapter looks at the process of designing the overall look of your instruction. We start with describing the treatment meeting, a brainstorming confab that gets ideas percolating. We then discuss how you decide the best architecture for your instructional strategy and how to determine whether the visual approach should be driven by text or by graphics. We also discuss size and orientation, style and available real estate, and for e-learning, navigation and functional graphic needs.
American Institute of Graphic Artists (AIGA) and the cross-culture forum
164 Fifth Avenue
New York, NY 10010
http://www.aiga.org
Graphic Artists Guild (GAG)
90 John Street, Suite 403
New York, NY 10038
http://www.gag.org
Society of Publications Designers (SPD)
60 E. 42nd Street Suite 721
New York, NY 10165
http://www.spd.org
Communication Arts
110 Constitution Road Menlo
Park, CA 64025
http://www.commarts.com
Folio
11 Riverbend Drive S.
P.O. Box 4272
Stamford, CT 06907-0272
http://www.inside.com/default.asp?entity=FolioMag
Association for Computing Machinery, Special Interest Group Graphics
http://www.siggraph.org/
ADL
Advanced Distance Learning and SCORM
http://www.adlnet.org
AICC
Aviation Industry CBT Committee
http://www.aicc.org
W3C
World Wide Web Consortium
http://www.w3.org/Graphics
CHAPTER OUTLINE
Planning Your Visual Approach
Treatment Meetings
Does Your Project Warrant a Treatment Meeting?
Who Attends?
What Are the Prerequisites?
What Is the Outcome?
What to Consider
Determine Overall Instructional Strategy
Decide What Carries the Story Line
Decide the Size and Orientation
Rough Out the Layout: Style and Available Real Estate
Style
Available Real Estate
Navigational and Functionality Needs
A Semi-Fictional Case Study