CHAPTER OVERVIEW
Do some learners benefit from visuals more than others? In this chapter we look at three individual differences that have been shown to moderate the effect of visuals on learning: prior knowledge of lesson content, visual literacy skills, and spatial ability. We present research, psychological rationale, and examples to support the following guidelines for adapting visuals to individual learners:
For low prior knowledge learners, add related visuals to lesson text and use visual design techniques that reduce cognitive load
For high prior knowledge learners, present most content with either text or visuals alone; two representations are often redundant
Encourage all learners to process visuals effectively
Visual/verbal learning preferences may not predict the effectiveness of graphics
Minimize demands on spatial ability by displaying visuals in a synchronized rather than a successive manner
For specialized tasks that require spatial skills, provide visual support to enable low spatial ability learners to achieve the instructional goal
For years trainers have heard that some people are visual learners who benefit more from graphics compared with verbal learners who do better with words. What valid evidence do we have about who profits most from visuals? In this chapter we review research on individual differences as they affect learning from visual instructional materials.
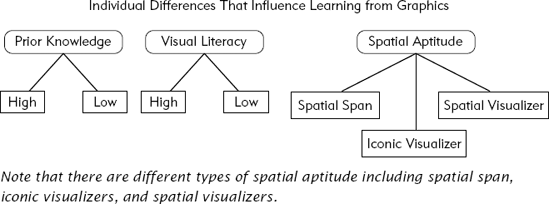
Three factors shown in Figure 10.1 affect how different individuals may benefit from graphics in instructional materials: prior knowledge of the lesson content, visual literacy skills, and spatial aptitude.
By prior knowledge we refer to what the learner already knows regarding the content of the training. Of the three individual differences, prior knowledge is the one that instructional professionals are likely to know most about their target audience. Visual literacy refers to the skill an individual has in making use of visuals for learning. At one extreme learners could completely ignore a visual. At the opposite end of the spectrum, they could deeply process a visual by inspecting it and systematically relating it to the text. The third individual difference, spatial aptitude, was identified over fifty years ago and is widely recognized today as one of the most basic cognitive abilities. Spatial aptitude allows one to generate and retain spatial images as well as to transform images in ways that support visual reasoning. Spatial aptitude, however, includes several sub-skills that we will describe below. As we will see, some individuals are strong in some spatial sub skills but not in others.
In this chapter we summarize several guidelines based on current research on how these three individual differences moderate the use of instructional visuals. We emphasize things you can do to help all learners get maximum learning value from your graphics. Since the research story is complex and still unfolding, we summarize the major concepts in Table 10.1 as a guide to this chapter.
Most of the experiments we have described throughout the book that prove the benefit of visuals for learning use subjects with no prior knowledge of the content. Mayer and Gallini (1990), however, conducted research to compare how graphics might affect learning of high and low prior knowledge students in different ways. In their experiment, learning of high and low knowledge learners was compared from lesson versions using text only and from versions using text and graphics. They found that adding relevant visuals to text was most helpful for learners with no prior knowledge. In their lesson materials the graphics were usually transformational line drawings to illustrate processes such as how brakes work and how lightning forms. Figure 10.2 shows a typical example. The results of one of their experiments are summarized in Figure 10.3. The left set of bar graphs showing learning of low prior knowledge learners indicates that graphics improved problem-solving learning but not verbatim recall of information. The right set of bar graphs shows that graphics did not help high prior knowledge learners with either problem-solving or recall learning. The slightly higher value of the graphics bar for high prior knowledge learners on problem solving tests was not statistically significant.
Table 10.1. A Summary of Individual Differences Affecting Use of Graphics.
Learner Type | Description | How to Support with Graphics |
|---|---|---|
Low Prior Knowledge | Learners with little or no background in the lesson content | For higher-level learning, most benefit from use of explanatory visual representations of content that are congruent with text because the visual can reduce load and provide a secondary route to forming mental models (Cuevas, Fiere, and Oster [2002]; Gyselinck and Tardieu [1999]; Mayer and Gallini [1990]). |
High Prior Knowledge | Learners with back-ground in the lesson content | Often won't need multiple representations so most benefit from either text or visual alone rather than redundant presentations of information (Kalyuga and others [2002]; Mayer and Gallini [1990]). |
Visual-Spatial Preference | Expressed preference for information presented in a visual format | Cannot predict spatial abilities based on preference questionnaires. Not useful as a way to adjust graphic treatments (Mayer and Massa [2003]; Kozhevnikov, Hegarty, and Mayer [2002]). |
- High Spatial Preference | Learners who prefer information presented with graphics | May have iconic or spatial visual ability, (Kozhevnikov, Hegarty, and Mayer [2002]). |
High Verbal Preference | Learners who prefer information presented in words | Most have average spatial ability but some may have high or low spatial ability (Kozhevnikov, Hegarty, and Mayer [2002]). |
Spatial Aptitude | Mental capability to hold and manipulate visual information | Includes both iconic and spatial visualizers as well as spatial span. Learners who are low in spatial aptitude will often not benefit from graphics in lessons (Mayer and Sims [1994]; Mayer and Moreno [2003]). Provide visual support for low spatial aptitude learners when tasks require spatial ability. |
- Iconic Visualizer | Learners with ability to hold and reproduce accurate visual images | This style is useful when accurate images will contribute to task accomplishment. However, they will need help on tasks that require abstract spatial representations (Kozhevnikov, Hegarty, and Mayer [2002]). |
- Spatial Visualizer | Learners with ability to manipulate and interpret spatial data | Individuals with this style are able to solve spatial problems by manipulating visual information in abstract ways. |
- Spatial Span | The ability to hold multiple visual images in memory | Some individuals can hold more visual information in memory than others. Avoid taxing visual span by presenting visual information in a simultaneous manner. |
Visual Literacy | Learners vary in the time and effort they invest in learning from graphics | To encourage all learners to process visuals, include instructional techniques that promote engagement with graphics (Schnotz, Picard, and Hron [1993]; Gyselinck and Tardieu [1999]). |
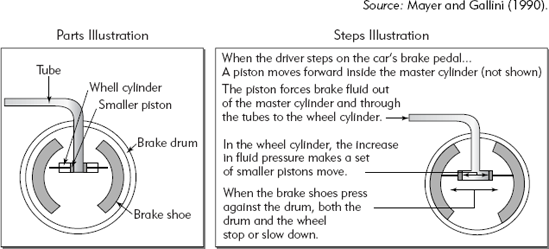
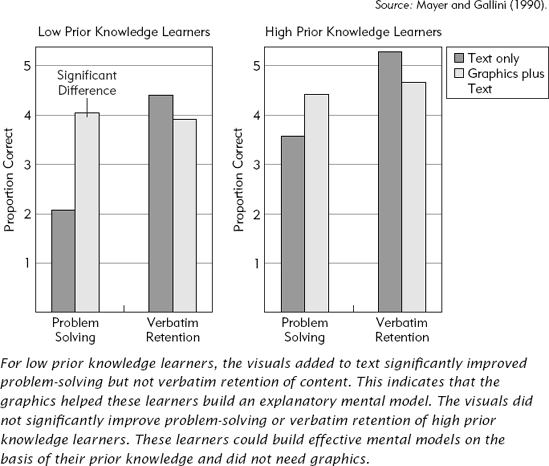
Figure 10.3. Learning from Lessons With and Without Graphics Among Low and High Prior Knowledge Learners.
There are two psychological reasons why visuals are helpful for low prior knowledge learners. First, as described in Chapter Six, visuals that are congruent with text can reduce cognitive load because they are psychologically efficient in that they can be processed as a whole. In addition, graphics reduce load because they are processed in the visual-spatial subcomponent of working memory while narrated words are processed in the phonetic subcomponent. By using spoken words and congruent visuals to present ideas, you optimize the limited capacity of working memory. Most of the instructional techniques proven to reduce cognitive load work best for novices who are most easily overloaded. In fact, several studies have shown that many cognitive load techniques are either ineffective or sometimes even counter productive for learners with content expertise (Kalyuga, Ayres, Chandler, and Sweller, 2003).
A second reason that visuals help low prior knowledge learners is they double the chances to build a mental model. By reading words and looking at related visual representations about the same content, novice learners get two opportunities to build a mental model. Because experienced learners already have relevant background knowledge, they usually do not need two representations of content. They can build an adequate mental model from the text or from the visual alone.
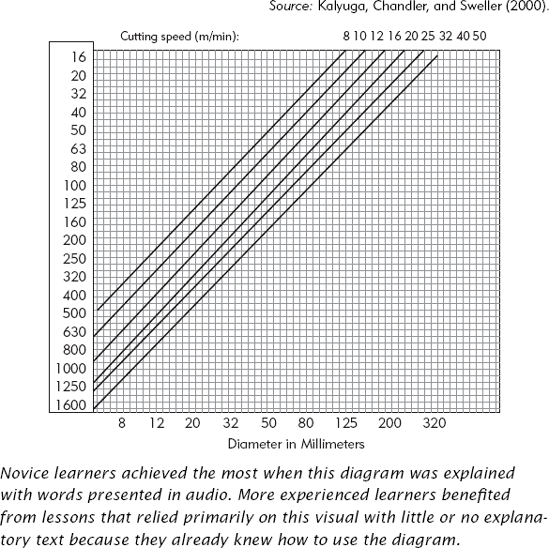
Although graphics appear to help low prior knowledge learners the most, at least two studies have shown that some diagrams are useful for experienced learners. In both studies the diagrams were relatively complex. For example, the diagram in Figure 10.4 is used to determine the best RPM setting for drilling various metals. As you look at this visual, you won't be surprised that those new to this procedure needed words to explain it. In fact, novices learned best when the lesson used narrated words to explain the diagram. The combination of visual and auditory modes maximized limited working memory capacity. In contrast, in more advanced lessons, those who had learned how to interpret the diagram in earlier lessons no longer needed the explanatory text. The diagram alone was best (Kalyuga, Chandler, and Sweller, 2000).
Hegarty and Just (1989, 1993) found that in lessons including machine diagrams with mechanical parts such as pulleys and gears, viewers with high knowledge of mechanical systems were better able to locate and extract information from the diagrams than low knowledge readers who lacked background to know where to look without the support of explanatory text. In a review of these studies, Vekiri (2002) concludes that "It is possible that such complex diagrams are effective for high-knowledge students whereas low-knowledge students benefit more from diagrams that present less information and present it in a progressive manner" (p. 278).
Based on current evidence, we conclude that diagrams or visual treatments that minimize cognitive load and that correspond to text will be most helpful for low prior knowledge learners. In contrast, more experienced learners are often better served by either text or visuals alone.
Clearly, a visual ignored won't help learning. Learners who invest effort in studying a visual and correlating it with the text will gain more from it. We call the ability to learn from graphics visual literacy. In Chapter Three we introduced metacognitive skills as the ability to set learning goals, select the best techniques to achieve those goals, monitor progress, and adjust as needed. Visual literacy is one expression of good metacognitive skills. By visual literacy we mean a learner's inclination and ability to attend to and to process graphic information.
A number of studies have concluded that learners may fail to make use of illustrations unless they are prompted to do so (Levie and Lentz, 1982; Schnotz, Picard, and Hron, 1993). In comparing successful and unsuccessful learners who studied a lesson that included a moderately complex visual along with explanatory text, Schnotz, Picard, and Hron (1993) found quantitative and qualitative differences among the two groups. The successful learners not only used the visual more intensively but concentrated on those aspects of the visual and the text most relevant to construction of a mental model. Likewise, Gyselinck and Tardieu (1999) report that the beneficial effect of lesson illustrations on inference test questions was limited to those individuals who took more time to study the visuals.
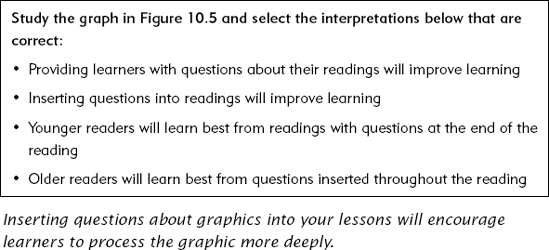
There are a variety of reasons why learners may either ignore visuals or process them in a shallow manner. In some cases learners may have low spatial ability. In other cases, they may have a preference for verbal information or associate visuals with fluff that won't contribute to their understanding. In still other situations, learners with poor metacognitive skills may not have acquired good study habits. Whatever the reasons, you can encourage your learners to process visuals effectively. We recommend that you use various techniques to engage learners with visuals—especially explanatory visuals that can help learners build a mental model. Visual engagement techniques range from designing graphic manipulations of objects in multimedia instruction to adding questions in print or multimedia lessons. Figures 10.5 and 10.6 show one example of how to use a question to engage the reader in processing a visual. Figure 10.5 is a bar graph showing data from a learning study on how questions added to text affect learning. Figure 10.6 shows one sample question that would encourage the learner to study the graph carefully. In Section Three on visualizing specific content types, we offer additional suggestions for ways to encourage learner engagement with visuals.

There has been a rather long-lived debate about the validity of verbal and visual learning styles. Common wisdom is that learners with high spatial styles prefer and learn better from visual representations whereas those with high verbal styles profit more from words. What do we know about visual and verbal preferences?
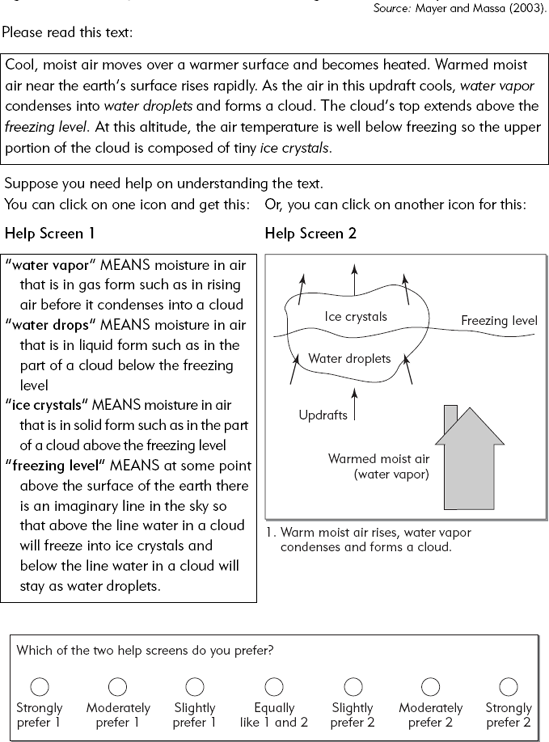
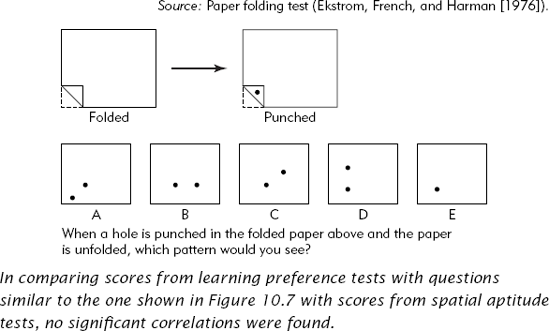
To get an idea of what kinds of measures are used to identify spatial-verbal preferences as well as spatial aptitude, we briefly illustrate some of the questions used in these tests. Figure 10.7 shows one question from a learning preference survey recently reported by Mayer and Massa (2003). You may want to answer this question yourself. Note that this question asks learners to indicate preference for help in the form of text or in the form of visuals and text in the context of an actual multimedia lesson. Figure 10.8 shows one question from a spatial aptitude test. Note that to solve this type of problem, you need to visualize spatial changes. Mayer and Massa (2003) show no correlation between learning preference scores based on questions like the one in Figure 10.7 and spatial aptitude as measured on tests with questions like the one in Figure 10.8.
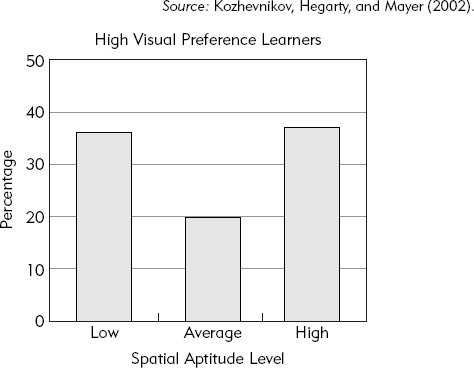
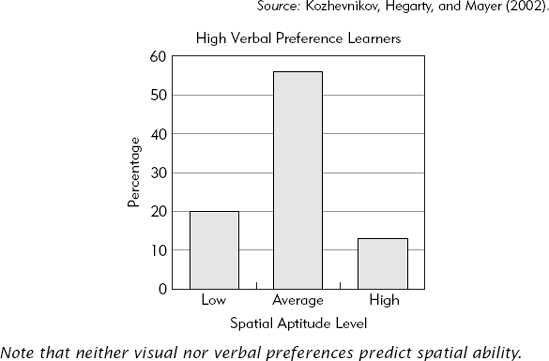
In other research, Kozhevnikov, Hegarty, and Mayer (2002) gave sixty volunteers a visualizer-verbalizer cognitive style questionnaire and a number of different spatial aptitude tests that included questions like the one in Figure 10.8. The results of the various spatial aptitude tests correlated with each other, but there was no relationship between the spatial ability scores and the visualizer-verbalizer preference questionnaire. As shown in Figure 10.9, those with high visual preferences were divided between high and low spatial aptitude. In contrast, as shown in Figure 10.10, those with high verbal preferences mostly fell into an average spatial ability range. The research team concludes that "preferences for visual strategies does not imply a high level of spatial ability" (p. 55). We add that conversely, preference for verbal strategy does not imply low spatial aptitude.
While we know that high spatial aptitude does improve learning from graphics (Mayer and Sims, 1994; Mayer and Moreno, 2003), research has yet to determine the relationship between visual-verbal preferences and learning from different types of instructional materials. This picture is further complicated by the fact that there are different types of spatial aptitudes as we will discuss next.
At least three important different types of spatial aptitudes can affect learning from different types of graphics. These are spatial span, iconic visualization, and spatial visualization.
In Chapter Three we mentioned that the capacity of working memory is about 7 + or −2 chunks of information. We also described the two subsystems in working memory: one for visual information and a second for auditory information. The capacities of these subsystems are called information spans. Imagine that someone reads you a list of five random single-digit numbers and asks you to recall them. The reader continues to read lists of numbers adding a new number onto each list. Eventually the list is too long for you to recall. The number of items in the last list you successfully recalled is a measure of your digit span. Spatial spans are determined in a similar manner except that rather than numbers, you recall sequences of blocks.
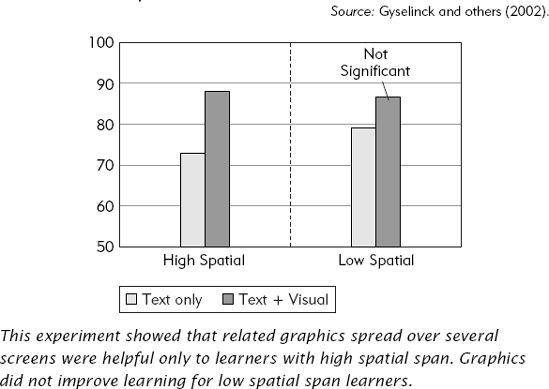
Gyselinck and others (2002) compared learning among individuals of high and low spatial span from two versions of a lesson on physics concepts. One version used text alone and the second version used text and relevant visuals. The lessons were presented one sentence at a time (with or without visuals) each on a separate computer screen. In order to build a mental model, the learner needed to hold each idea in memory until all the screens were viewed. How did the lessons with graphics affect learning in individuals with high and low spatial span?
As shown in Figure 10.11, individuals with high spatial span learned more from the versions with graphics than individuals with low spatial span. It's not surprising that learners who can hold visual information in memory were able to learn more from lessons in which the visuals were spread across several screens. In contrast, low spatial span learners learned as much from the text versions as from the versions with visuals. Since the low spatial span learners were unable to hold related visuals in memory for long, the graphics did not help them.
When related visual information is displayed separately over several screens or pages as in the experiment described in the preceding section, we say that the visuals are displayed in a successive manner. In contrast, when they are integrated on the same screen or page, we say they are displayed in a synchronized manner.
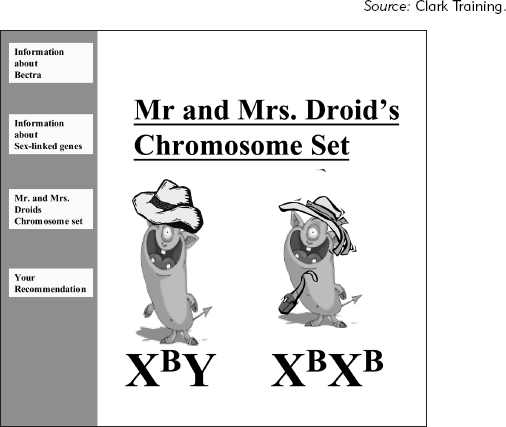
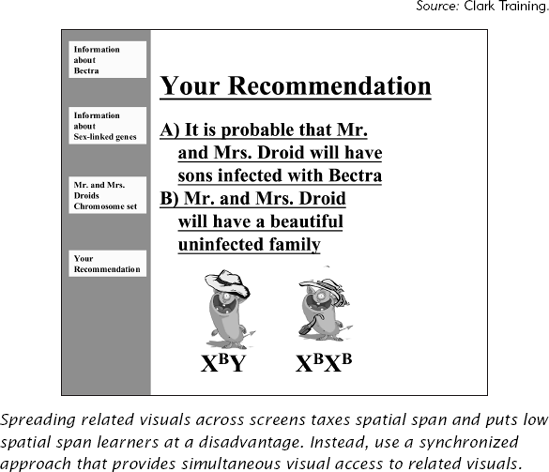
Mayer and Moreno (2003) suggest that when visual information is presented successively, high spatial learners will benefit, whereas low spatial learners will be at a disadvantage. To maximize the value of instructional visuals you should present them in a synchronized manner, thus reducing the spatial load imposed on working memory. Rather than spread a related topic or concept over several screens, use screen builds or pop-ups to explain a complete visual or a series of related visuals on the same screen. Additionally, use care in displaying practice questions that require the use of visual information presented on prior screens. Instead include the required visual either in a pop-up or place it on the same screen where the question appears. Figures 10.12 and 10.13 show two first-draft screens created by Wanda Miller and Greg Bonham in one of our seminars. Notice that to answer the practice question shown in Figure 10.13, the learner must either page back or hold the visual information shown in 10.12 in memory. Figure 10.14 is a corrected version that will not rely on visual span to process effectively.
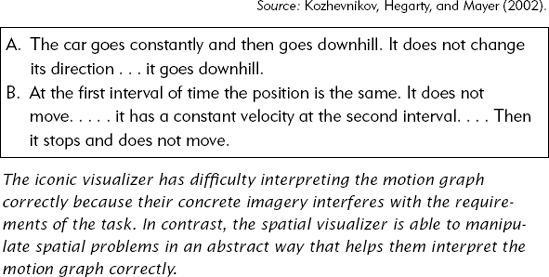
We mentioned that there are three different spatial subaptitudes that affect learning from graphics. In addition to spatial span, there are also two additional types of visualizers: iconic and spatial. Look at the graph shown in Figure 10.15 and write a sentence about what is happening to an object depicted by the data in the graph. When you are done, compare your answer to those shown in Figure 10.16. Which one is more like your response? Answer B is the correct interpretation of the motion graph and is typical of responses made by spatial visualizers, whereas answer A is the type of response made by iconic visualizers.

Iconic visualizers rely on concrete visual imagery, whereas spatial visualizers can interpret or manipulate spatial information in a more abstract manner. When trying to interpet a motion graph like the one shown in Figure 10.15, iconic visualizers can't help using a visual image such as a ball rolling down a hill. This leads to an inaccurate interpretation of the graph. A correct interpretation states that an object does not change position during the time indicated by the first horizontal part of the graph. Then it moves at a constant rate as indicated by the downward slope of the graph.
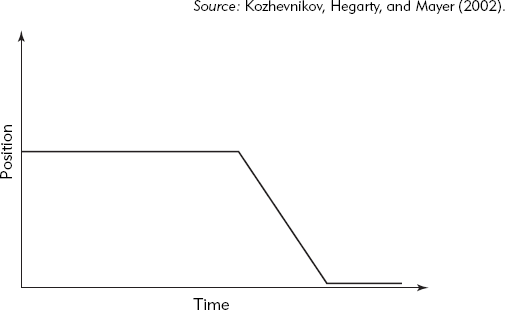
Finally, it stops and remains stationary as illustrated by the bottom horizontal line.
As shown in Figure 10.9, most individuals with visual preferences score either high or low on the spatial aptitude tests. Kozhevnikov found that all individuals with spatial preferences who scored high on spatial aptitude interpreted the motion graphs correctly. In contrast, all individuals with spatial preferences who scored low on spatial aptitude interpreted the motion graphs in an iconic manner. Figure 10.17 shows these results. They conclude that individuals with visual preferences may be spatial visualizers or they may be iconic visualizers.
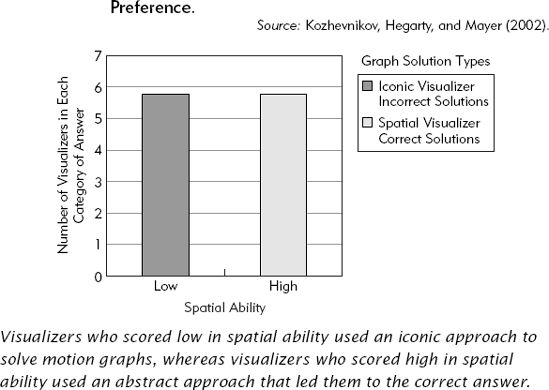
From this research we conclude that individuals who show a high visual preference on questionnaires are of two types: iconic visualizers who use concrete imagery to solve spatial problems and spatial visualizers who use and manipulate abstract representations to solve spatial problems. Each type has its advantages depending on the spatial problem or task. For the motion problems, the abstract representation of spatials lead to a correct interpretation of the graph. In contrast, iconic visualizations would be helpful for a task that relied on imagery such as drawing something seen previously.
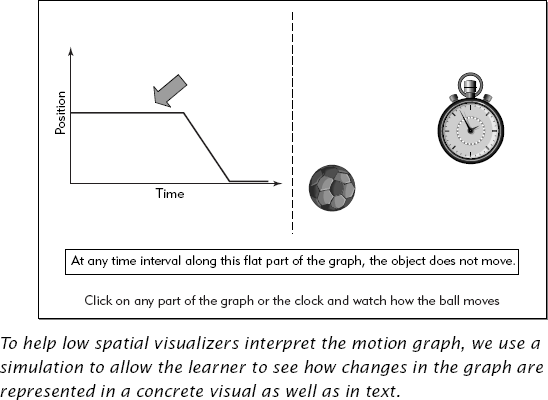
You can use multimedia to help learners with low spatial ability succeed on tasks that require spatial visualization such as interpretation of the motion graph shown in Figure 10.15. For example, Figure 10.18 illustrates a multimedia approach that uses three different representations to help a low spatial learner. The three windows in our simulation use multiple coordinated representations. The original motion graph displayed in the left window has two alternative representations. The concrete visual on the right-hand side allows the learner to see the effect of movement of the ball on the graph and vice versa. Beneath both visuals is a textual explanation of the graph. Thus the learner can click on any portion of the graph and see a corresponding change in the movement of the ball over time as well as move the ball or change the time and see the resulting representation on the graph. Kozhevnikov, Hegarty, and Mayer (2002) suggest that approaches similar to the one shown in Figure 10.18 have improved students ability to interpret these types of graphs.
Help for low spatials does not always require a multimedia simulation. Mayer, Mathias, and Wetzell (2002) aided learners by providing them with paper diagrams that showed geological formations on land and in the ocean. The learners needed to interpret visual, numeric, and graphic data in a geology simulation game. The researchers found that learners who received the diagrams did better than learners who either received no support or who received verbal support in the form of demonstrations.
In summary we recommend that for tasks that require spatial skills such as the interpretation of motion graphs or geological representations, you should provide graphic aids that help low spatial learners. The aid is likely to help these learners by providing alternative representations—either visual or textual—of the spatial content of the lesson.
Research is under way to define what kinds of spatial abilities will help learners to succeed in different instructional environments as well as ways to easily measure these abilities. To identify spatial ability by using the spatial aptitude tests that include questions similar to the one shown in Figure 10.8 is cumbersome. Mayer and Massa (2003) have recently developed easy-to-administer surveys that significantly correlate with spatial ability scores. The next step in their research program will be to show which spatial ability measures correlate with learning outcomes from different instructional treatments. We anticipate that we will soon have more practical ways to measure spatial ability that will help instructional professionals identify and help low spatial ability learners as described in the preceding section.
From a practical perspective, when developing instructional materials, you may know about the prior knowledge of your learners, but until we have easier spatial ability measures you are unlikely to know about their spatial abilities. Therefore, we recommend you apply Guidelines 1 and 2 based on the prior knowledge of your learners. Otherwise, we recommend that you plan graphics that will optimize the interpretation and use of graphics for all learners. Special visual support is most likely to be needed for learning tasks that rely on spatial skills such as interpretation of motion graphs.
This chapter concludes Section Two on ways to use visuals to promote the essential psychological events of learning. In Section Three we focus on how to best use visuals to teach specific lesson content. In each chapter we offer guidelines and examples on how to best visualize one of the five most common content types found in training materials: procedures, concepts, facts, processes, and principles.
Mayer, R.E., and Sims., V.K. (1994). "For Whom Is a Picture Worth a Thousand Words? Extensions of a Dual-Coding Theory of Multimedia Learning." Journal of Educational Psychology, 86 (3), 389–401.
Gyselinck and others (2002). "Visualspatial Memory and Phonological Loop in Learning from Multimedia." Applied Cognitive Psychology, 19, 665–685.
Kozhevnikov, M., Hegarty, M., and Mayer, R.E. (2002). "Revising the Visualizer-Verbalizer Dimension: Evidence for Two Types of Visualizers." Cognition and Instruction, 20 (1), 47–77.
To summarize guidelines for using graphics to support the six psychological processes (Table I.2.) associated with learning.
To summarize how to accommodate individual learner differences in ways to maximize the benefits that all learners can derive from graphics.
Table I.2. The Psychological Processes.
Process | Description | Graphic Support |
|---|---|---|
Attention | Using visuals to focus attention to the important parts of the instruction and to avoid dividing attention during learning | A red arrow draws the eye to the important part of a complex application screen |
Prior Knowledge | Using visuals to either activate relevant prior knowledge in long-term memory or to provide a high-level preview of the content | A graphic advance organizer gives a visual preview of the lesson content |
Memory Load | Using visuals to reduce load imposed on working memory during learning | Using a line drawing rather than a photograph |
Building Mental Models | Using visuals to help learners build a deeper understanding that will support discrimination or problem solving | Using an interpretive visual to show an invisible process |
Transfer of Learning | Using visuals to promote retrieval of new knowledge and skills after training | Using a screen capture that looks like the one learners will use on the job |
Motivation | Using visuals to draw on learner personal interest or promote situational cognitive interest ininstructional materials | Visualizing a job-relevant problem scenario as a context for learning |
Learners process visuals differently depending on their
Prior knowledge of the lesson content
Visual literacy
Spatial ability
Use cuing visuals to draw attention to important instructional content when the display is complex and presentation rate is not controlled by the learner.
Use color to improve job performance in tasks that involve visual search.
Place words close to the visuals they describe.
Avoid visuals that distract the learner from important instructional content.
Use concrete graphics that serve as visual analogies as comparative advance organizers.
Use visual summaries of lesson content as expository advance organizers.
Avoid starting a lesson with a dramatic but extraneous visual which will activate inappropriate prior knowledge.
Use graphics in place of text when the content can be communicated more efficiently visually.
Plan graphics that are consistent in style and low in complexity.
Explain complex graphics with words presented in audio.
Use words or graphics alone when information is self-explanatory. Avoid presenting redundant information when one representation is sufficient.
Present individual components of a complex graphic first when learners need to build a deep understanding of the content.
Use organizational visuals such as graphic organizers to show qualitative relationships among lesson content.
Select and design relational visuals such as bar charts to most effectively display the quantitative relationships expressed by the text.
Use transformational visuals such as line drawings with arrows that illustrate change over time or space to build cause-and-effect mental models.
Use interpretive visuals such as a schematic diagram to illustrate cause-and-effect relationships among intangible phenomena.
For near transfer skills use representational visuals.
For far transfer skills use:
Interpretive and transformational visuals to build process mental models
Visuals to represent abstract ideas concretely
Varied context visual examples to build richer mental models
Visuals to promote inductive learning
For recall of factual knowledge, use visual mnemonics.
For learners with low personal interest in the training, use techniques to increase cognitive interest in the lesson.
Draw on learners' personal interests by using visuals that make the relevance of the instruction obvious.
Avoid Las Vegas–type approaches to learning by minimizing visuals that stimulate emotional interest.
Use visuals to make lessons more concrete, familiar, and coherent.
For low prior knowledge learners, add related visuals to lesson text and use visual design techniques that reduce cognitive load.
For high prior knowledge learners, present most content with either text or visuals alone; two representations are often redundant.
Encourage all learners to process visuals effectively.
Visual/verbal learning preferences may not predict the effectiveness of graphics.
Minimize demands on spatial ability by displaying visuals in a synchronized rather than a successive manner.
For specialized tasks that require spatial skills, provide visual support to enable low spatial ability learners to achieve the instructional goal.