
Chapter Three
SHORTCUTS TO DIFFERENTATION
Contents
3.1 Derivative Formulas for Powers and Polynomials
Derivative of a Constant Function
Derivative of a Linear Function
Derivative of a Constant Times a Function
Derivatives of Sums and Differences
3.2 Exponential and Logarithmic Functions
The Derivative of ax and the Number e
The Derivative of a Composition of Functions
The Chain Rule for Functions Given by Formulas
Relative Rates and Logarithms..
3.4 The Product and Quotient Rules.
3.5 Derivatives of Periodic Functions
Establishing the Derivative Formulas
3.1 DERIVATIVE FORMULAS FOR POWERS AND POLYNOMIALS
The derivative of a function at a point represents a slope and a rate of change. In Chapter 2, we learned how to estimate values of the derivative of a function given by a graph or by a table. Now, we learn how to find a formula for the derivative of a function given by a formula.
Derivative of a Constant Function
The graph of a constant function f(x) = k is a horizontal line, with a slope of 0 everywhere. Therefore, its derivative is 0 everywhere. (See Figure 3.1.)

For example, ![]() (5) = 0.
(5) = 0.

Figure 3.1: A constant function
Derivative of a Linear Function
We already know that the slope of a line is constant. This tells us that the derivative of a linear function is constant.

For example, ![]() .
.
Derivative of a Constant Times a Function
Figure 3.2 shows the graph of y = f(x) and of three multiples: ![]() , and
, and ![]() . How are the derivatives of these functions related? In other words, for a particular x-value, how are the slopes of these graphs related?
. How are the derivatives of these functions related? In other words, for a particular x-value, how are the slopes of these graphs related?

Figure 3.2: A function and its multiples: Derivative of multiple is multiple of derivative
Multiplying by a constant stretches or shrinks the graph (and reflects it about the x-axis if the constant is negative). This changes the slope of the curve at each point. If the graph has been stretched, the “rises” have all been increased by the same factor, whereas the “runs” remain the same. Thus, the slopes are all steeper by the same factor. If the graph has been shrunk, the slopes are all smaller by the same factor. If the graph has been reflected about the x-axis, the slopes will all have their signs reversed. Thus, if a function is multiplied by a constant, c, so is its derivative:
Derivative of a Constant Multiple
If c is a constant,
![]()
Derivatives of Sums and Differences
Values of two functions, f(x) and g(x), and their sum f(x) + g(x) are listed in Table 3.1.

We see that adding the increments of f(x) and the increments of g(x) gives the increments of f(x) + g(x). For example, as x increases from 0 to 1, f(x) increases by 10 and g(x) increases by 0.2, while f(x) + g(x) increases by 110.2 − 100 = 10.2. Similarly, as x increases from 3 to 4, f(x) increases by 40 and g(x) by 0.2, while f(x) + g(x) increases by 200.8 − 160.6 = 40.2.
This example suggests that the rate at which f(x) + g(x) is increasing is the sum of the rates at which f(x) and g(x) are increasing. Similar reasoning applies to the difference, f(x) − g(x). In terms of derivatives:
Derivative of a Sum and Difference
![]()
Powers of x
We start by looking at f(x) = x2 and g(x) = x3. We show in the Focus on Theory section at the end of this chapter that
![]()
The graphs of f(x) = x2 and g(x) = x3 and their derivatives are shown in Figures 3.3 and 3.4. Notice f′(x) = 2x has the behavior we expect. It is negative for x < 0 (when f is decreasing), zero for x = 0, and positive for x > 0 (when f is increasing). Similarly, g′(x) = 3x2 is zero when x = 0, but positive everywhere else, as g is increasing everywhere else. These examples are special cases of the power rule.

Figure 3.3: Graphs of f(x) = x2 and its derivative f′(x) = 2x

Figure 3.4: Graphs of g(x) = x3 and its derivative g′(x) = 3x2
The Power Rule
For any constant real number n,
![]()
| Example 1 | Find the derivative of (a) h(x) = x8 (b) P(t) = t7. |
| Solution | (a) h′(x) = 8x7. (b) P′(t) = 7t6. |
We can use the power rule to differentiate negative and fractional powers.
| Example 2 | Use the power rule to differentiate |
| Solution |
|
Derivatives of Polynomials
Using the derivatives of powers, constant multiples, and sums, we can differentiate any polynomial.


Using the Derivative Formulas
Since the slope of the tangent line to a curve is given by the derivative, we use differentiation to find the equation of the tangent line.
| Example 4 | Find an equation for the tangent line at x = 1 to the graph of
Sketch the graph of the curve and its tangent line on the same axes. |
| Solution | Differentiating gives
so the slope of the tangent line at x = 1 is
When x = 1, we have y = 13 + 2(12) − 5(1) + 7 = 5, so the point (1, 5) lies on the tangent line. Using the formula y − y0 = m(x − x0) gives
The equation of the tangent line is y = 3 + 2x. See Figure 3.5.
|


| Example 5 | Find and interpret the second derivatives of (a) f(x) = x2 (b) g(x) = x3. |
| Solution | (a) Differentiating (b) Differentiating
Figure 3.6: Graph of f(x) = x2 with f″(x) = 2
|


| Example 6 | The revenue (in dollars) from producing q units of a product is given by
Find R(125) and R′(125). Give units and interpret your answers. |
| Solution | We have
Since R′(q) = 1000 − 6q, we have
If 125 units are sold, the revenue is 78,125 dollars. If an additional unit is then sold, the revenue increases by about $250. |
| Example 7 | Figure 3.8 shows the graph of a cubic polynomial. Both graphically and algebraically, describe the behavior of the derivative of this cubic.
Figure 3.8: The cubic of Example 7
|
| Solution | Graphical approach: Suppose we move along the curve from left to right. To the left of A, the slope is positive; it starts very positive and decreases until the curve reaches A, where the slope is 0. Between A and C the slope is negative. Between A and B the slope is decreasing (getting more negative); it is most negative at B. Between B and C the slope is negative but increasing; at C the slope is zero. From C to the right, the slope is positive and increasing. The graph of the derivative function is shown in Figure 3.9.
Algebraic approach: f is a cubic that goes to + ∞ as x → + ∞, so
with a > 0. Hence,
whose graph is a parabola opening upward because the coefficient of x2 is positive, as in Figure 3.9. |


Problems for Section 3.1
For Problems 1–38, find the derivative. Assume a, b, c, k are constants.
1. y = 3x
2. y = 5
3. y = x−12
4. y = x12
5. y = 8t3
6. y = x4/3
7. y = 5x + 13
8. y = 3t4 −2t2
9. f(q) = q3 + 10
10. ![]()
11. y = 6x3 + 4x2 − 2x
12. y = x2 + 5x + 9
13. y = 8t3−4t2+12t−3
14. y = 3x2 + 7x − 9
15. y = −3x4 − 4x3 − 6x
16. y = 4.2q2 − 0.5q + 11.27
17. ![]()
18. ![]()
19. ![]()
20. ![]()
21. ![]()
22. ![]()
23. z = (t − 1)(t + 1)
24. R = (s2 + 1)2
25. ![]()
26. ![]()
27. ![]()
28. ![]()
29. ![]()
30. ![]()
31. y = ax2 + bx + c
32. f(x) = kx2
33. ![]()
34. ![]()
35. ![]()
36. ![]()
37. ![]()
38. w = 3ab2q
39. (a) Use a graph of P(q) = 6q−q2 to determine whether each of the following derivatives is positive, negative, or zero: P′(1), P′(3), P′(4). Explain.
(b) Find P′(q) and the three derivatives in part (a).
40. Let f(x) = x3 − 4x2 + 7x − 11. Find f′(0), f′(2), f′(−1).
41. Let f(t) = t2 − 4t + 5.
(a) Find f′(t).
(b) Find f′(1) and f′(2).
(c) Use a graph of f(t) to check that your answers to part (b) are reasonable. Explain.
42. Find the rate of change of a population of size P(t) = t3 + 4t + 1 at time t = 2.
43. The height of a sand dune (in centimeters) is represented by f(t) = 700 − 3t2, where t is measured in years since 2005. Find f (5) and f′(5). Using units, explain what each means in terms of the sand dune.
In Problems 44–45, find the relative rate of change f′(t)/f(t) at the given value of t. Assume t is in years and give your answer as a percent.
44. f(t) = 3t + 2; t = 5
45. f(t) = 2t3 + 10; t = 4
46. The number, N, of acres of harvested land in a region is given by
![]()
where t is the number of years since farming began in the region. Find f (9), f′(9), and the relative rate of change f′/f at t = 9. Interpret your answers in terms of harvested land.
47. Zebra mussels are freshwater shellfish that first appeared in the St. Lawrence River in the early 1980s and have spread throughout the Great Lakes. Suppose that t months after they appeared in a small bay, the number of zebra mussels is given by Z(t) = 300t2. How many zebra mussels are in the bay after four months? At what rate is the population growing at that time? Give units.
48. The quantity, Q, in tons, of material at a municipal waste site is a function of the number of years since 2000, with
![]()
Find f (10), f′(10), and the relative rate of change f′/f at t = 10. Interpret your answers in terms of waste.
49. If f(t) = 2t3 − 4t2 + 3t − 1, find f′(t) and f″(t).
50. If f(t) = t4 − 3t2 + 5t, find f′(t) and f″(t).
51. Find the equation of the line tangent to the graph of f(x) = 2x3 − 5x2 + 3x − 5 at x = 1.
52. (a) Find the equation of the tangent line to f(x) = x3 at the point where x = 2.
(b) Graph the tangent line and the function on the same axes. If the tangent line is used to estimate values of the function near x = 2, will the estimates be over-estimates or underestimates?
53. Find the equation of the line tangent to the graph of f(t) = 6t − t2 at t = 4. Sketch the graph of f(t) and the tangent line on the same axes.
54. The time, T, in seconds for one complete oscillation of a pendulum is given by T = f(L) = 1.111 ![]() where L is the length of the pendulum in feet. Find the following quantities, with units, and interpret in terms of the pendulum.
where L is the length of the pendulum in feet. Find the following quantities, with units, and interpret in terms of the pendulum.
(a) f(100)
(b) f′ (100).
55. Kleiber's Law states that the daily calorie requirement, C(w), of a mammal is proportional to the mammal's body weight w raised to the 0.75 power.1 If body weight is measured in pounds, the constant of proportionality is approximately 42.
(a) Give formulas for C (w) and C′ (w).
(b) Find and interpret
(i) C (10) and C′(10)
(ii) C (100) and C′(100)
(iii) C (1000) and C′(1000)
56. If you are outdoors, the wind may make it feel a lot colder than the thermometer reads. You feel the windchill temperature, which, if the air temperature is 20°F, is given in °F by W(v) = 48.17 − 27.2v0.16, where v is the wind velocity in mph for 5 ≤ v ≤ 60.2
(a) If the air temperature is 20°F, and the wind is blowing at 40 mph, what is the windchill temperature, to the nearest degree?
(b) Find W′(40), and explain what this means in terms of windchill.
57. (a) Use the formula for the area of a circle of radius r, A = πr2, to find dA/dr.
(b) The result from part (a) should look familiar. What does dA/dr represent geometrically?
(c) Use the difference quotient to explain the observation you made in part (b).
58. Suppose W is proportional to r3. The derivative dW/dr is proportional to what power of r?
59. Show that for any power function f(x) = xn, we have f′(1) = n.
60. The cost to produce q items is C(q) = 1000 + 2q2 dollars. Find the marginal cost of producing the 25th item. Interpret your answer in terms of costs.
61. The demand curve for a product is given by q = 300−3p, where p is the price of the product and q is the quantity that consumers buy at this price.
(a) Write the revenue as a function, R(p), of price.
(b) Find R′(10) and interpret your answer in terms of revenue.
(c) For what prices is R′(p) positive? For what prices is it negative?
62. A ball is dropped from the top of the Empire State Building. The height, y, of the ball above the ground (in feet) is given as a function of time, t, (in seconds) by
![]()
(a) Find the velocity of the ball at time t. What is the sign of the velocity? Why is this to be expected?
(b) When does the ball hit the ground, and how fast is it going at that time? Give your answer in feet per second and in miles per hour (1 ft/sec = 15/22 mph).
63. The yield, Y, of an apple orchard (measured in bushels of apples per acre) is a function of the amount x of fertilizer in pounds used per acre. Suppose
![]()
(a) What is the yield if 5 pounds of fertilizer is used per acre?
(b) Find f′(5). Give units with your answer and interpret it in terms of apples and fertilizer.
(c) Given your answer to part (b), should more or less fertilizer be used? Explain.
64. The demand for a product is given, for p, q ≥ 0, by
![]()
(a) Find the p- and q-intercepts for this function and interpret them in terms of demand for this product.
(b) Find f (20) and give units with your answer. Explain what it tells you in terms of demand.
(c) Find f′(20) and give units with your answer. Explain what it tells you in terms of demand.
65. The cost (in dollars) of producing q items is given by C(q) = 0.08q3 + 75q + 1000.
(a) Find the marginal cost function.
(b) Find C(50) and C′(50). Give units with your answers and explain what each is telling you about costs of production.
66. Let f(x) = x3 − 6x2 − 15x + 20. Find f′(x) and all values of x for which f′(x) = 0. Explain the relationship between these values of x and the graph of f(x).
67. If the demand curve is a line, we can write p = b + mq, where p is the price of the product, q is the quantity sold at that price, and b and m are constants.
(a) Write the revenue as a function of quantity sold.
(b) Find the marginal revenue function.
3.2 EXPONENTIAL AND LOGARITHMIC FUNCTIONS
The Exponential Function
What do we expect the graph of the derivative of the exponential function f(x) = ax to look like? The graph of an exponential function with a > 1 is shown in Figure 3.10. The function increases slowly for x < 0 and more rapidly for x > 0, so the values of f′ are small for x < 0 and larger for x > 0. Since the function is increasing for all values of x, the graph of the derivative must lie above the x-axis. In fact, the graph of f′ resembles the graph of f itself. We will see how this observation holds for f(x) = 2x and g(x) = 3x.

Figure 3.10: f(x) = ax, with a > 1
The Derivatives of 2x and 3x
In Section 2.1, we estimated the derivative of f(x) = 2x at x = 0:
![]()
By estimating the derivative at other values of x, we obtain the graph in Figure 3.11. Since the graph of f′ looks like the graph of f shrunk vertically, we assume that f′ is a multiple of f. Since f′(0) ≈ 0.693 = 0.693 · 1 = 0.693 f(0), the multiplier is approximately 0.693, which suggests that
![]()
Similarly, in Figure 3.12, the derivative of g(x) = 3x is a multiple of g, with multiplier g′(0) ≈ 1.0986. So
![]()

Figure 3.11: Graph of f(x) = 2x and its derivative

Figure 3.12: Graph of g(x) = 3x and its derivative
The Derivative of ax and the Number e
The calculation of the derivative of f(x) = ax, for a > 0, is similar to that of 2x and 3x. The derivative is again proportional to the original function. When a = 2, the constant of proportionality (0.6931) is less than 1, and the derivative is smaller than the original function. When a = 3, the constant of proportionality (1.0986) is more than 1, and the derivative is greater than the original function. Is there an in-between case, when derivative and function are exactly equal? In other words:
![]()
The answer is yes: the value is a ≈ 2.718 ..., the number e introduced in Chapter 1. This means that the function ex is its own derivative:

It turns out that the constants involved in the derivatives of 2x and 3x are natural logarithms. In fact, since 0.6931 ≈ ln 2 and 1.0986 ≈ ln 3, we (correctly) guess that
![]()
In the Focus on Theory section at the end of this chapter, we show that, in general:
The Exponential Rule
For any positive constant a,
![]()
Since ln a is a constant, the derivative of ax is proportional to ax. Many quantities have rates of change that are proportional to themselves; for example, the simplest model of population growth has this property. The fact that the constant of proportionality is 1 when a = e makes e a particularly useful base for exponential functions.
| Example 1 | Differentiate 2 · 3x + 5ex. |
| Solution |
The Derivative of ekt
Since functions of the form ekt where k is a constant are often useful, we calculate the derivative of ekt. Since ekt = (ek)t, the derivative is (ln(ek))(ek)t = (klne)(ekt) = kekt. Thus, if k is a constant,

| Example 2 | Find the derivative of P = 5 + 3x2 − 7e−0.2x. |
| Solution | The derivative is
|
The Derivative of ln x
What does the graph of the derivative of the logarithmic function f(x) = ln x look like? Figure 3.13 shows that ln x is increasing, so its derivative is positive. The graph of f(x) = ln x is concave down, so the derivative is decreasing. Furthermore, the slope of f(x) = ln x is very large near x = 0 and very small for large x, so the derivative tends to + ∞ for x near 0 and tends to 0 for very large x. See Figure 3.14. It turns out that

We give an algebraic justification for this rule in the Focus on Theory section.

Figure 3.13: Graph of f(x) = ln x

Figure 3.14: Graph of the derivative of f(x) = ln x
| Example 3 | Differentiate y = 5 ln t + 7et − 4t2 + 12. |

Using the Derivative Formulas
| Example 4 | In Chapter 1, we saw that if t is in years since the start of 2000, the population of Nevada, P, in millions, can be approximated by
At what rate was the population growing at the beginning of 2009? Give units with your answer. |
| Solution | The instantaneous rate of growth is the derivative, so we want dP/dt when t = 9. We have:
The population of Nevada was growing at a rate of about 0.0982 million, or 98,200, people per year at the start of 2009. |

| Example 5 | Find the equation of the tangent line to the graph of f(x) = ln x at the point where x = 2. Draw a graph with f(x) and the tangent line on the same axes. |
| Solution | Since f′(x) = 1/x, the slope of the tangent line at x = 2 is f′(2) = 1/2 = 0.5. When x = 2, y = ln 2 = 0.693, so a point on the tangent line is (2,0.693). Substituting into the equation for a line, we have:
The equation of the tangent line is y = −0.307 + 0.5x. See Figure 3.15.
|


| Example 6 | Suppose $1000 is deposited into a bank account that pays 8% annual interest, compounded continuously.
(a) Find a formula f(t) for the balance t years after the initial deposit. (b) Find f (10) and f′(10) and explain what your answers mean in terms of money. |
| Solution | (a) The balance is f(t) = 1000e0.08t.
(b) Substituting t = 10 gives
This means that the balance is $2225.54 after 10 years. To find f′(10), we compute f′(t) = 1000(0.08e0.08t) = 80e0.08t. Therefore,
This means that after 10 years, the balance is growing at the rate of about $178 per year. |
Problems for Section 3.2
Differentiate the functions in Problems 1–28. Assume that A, B, and C are constants.
1. P = 3t3 + 2et
2. f(x) = 2ex + x2
3. f(x) = x3 + 3x
4. y = 5t2 + 4et
5. y = 5 · 5t + 6 · 6t
6. ![]()
7. y = 4 · 10x − x3
8. f(x) = 2x + 2 · 3x
9. y = 5 · 2x −5x + 4
10. y = 3x −2 · 4x
11. y = e0.7t
12. f(t) = e3t
13. P = e−0.2t
14. y = e−4t
15. P = 200e0.12t
16. P = 50e−0.6t
17. P(t) = 12.41(0.94)t
18. P(t) = 3000(1.02)t
19. y = B + Aet
20. P(t) = Cet.
21. ![]()
22. f(x) = Aex − Bx2 + C
23. D = 10 − ln p
24. R = 3 ln q
25. R(q) = q2 − 2 ln q
26. y = t2 + 5 ln t
27. f(t) = Aet + B ln t
28. y = x2 + 4x −3 ln x
In Problems 29–34, find the relative rate of change, f′(t)/f(t), of the function f(t).
29. f(t) = 15t +12
30. f(t) = 10t + 5
31. f(t) = 30e−7t
32. f(t) = 8e5t
33. f(t) = 35t−4
34. f(t) = 6t2
35. For f(t) = 4 −2et, find f′(− 1), f′(0), and f′(1). Graph f(t), and draw tangent lines at t = −1, t = 0, and t = 1. Do the slopes of the lines match the derivatives you found?
36. Find the equation of the tangent line to the graph of y = 3x at x = 1. Check your work by sketching a graph of the function and the tangent line on the same axes.
37. Find the equation of the tangent line to y = e−2t at t = 0. Check by sketching the graphs of y = e−2t and the tangent line on the same axes.
38. Find the equation of the tangent line to f(x) = 10e−0.2x at x = 4.
39. A fish population is approximated by P(t) = 10e0.6t, where t is in months. Calculate and use units to explain what each of the following tells us about the population:
(a) P(12)
(b) P′ (12)
40. The world's population3 is about f(t) = 6.91e0.011t billion, where t is time in years since 2010. Find f(0), f′(0), f(10), and f′(10). Using units, interpret your answers in terms of population.
41. The demand curve for a product is given by
![]()
where q is the quantity sold and p is the price of the product, in dollars. Find f(2) and f′(2). Explain in economic terms what information each of these answers gives you.
42. The value of an automobile purchased in 2009 can be approximated by the function V(t) = 25(0.85)t, where t is the time, in years, from the date of purchase, and V(t) is the value, in thousands of dollars.
(a) Evaluate and interpret V(4), including units.
(b) Find an expression for V′(t), including units.
(c) Evaluate and interpret V′(4), including units.
(d) Use V(t), V′(t), and any other considerations you think are relevant to write a paragraph in support of or in opposition to the following statement: “From a monetary point of view, it is best to keep this vehicle as long as possible.”
43. A new DVD is available for sale in a store one week after its release. The cumulative revenue, $R, from sales of the DVD in this store in week t after its release is
![]()
Find f(5), f′(5), and the relative rate of change f′/f at t = 5. Interpret your answers in terms of revenue.
44. In 2009, the population of Hungary4 was approximated by
![]()
where P is in millions and t is in years since 2009. Assume the trend continues.
(a) What does this model predict for the population of Hungary in the year 2020?
(b) How fast (in people/year) does this model predict Hungary's population will be decreasing in 2020?
45. With t in years since January 1, 2010, the population P of Slim Chance is predicted by
![]()
At what rate will the population be changing on January 1, 2023?
46. With a yearly inflation rate of 5%, prices are given by
![]()
where P0 is the price in dollars when t = 0 and t is time in years. Suppose P0 = 1. How fast (in cents/year) are prices rising when t = 10?
47. Find the value of c in Figure 3.16, where the line l tangent to the graph of y = 2x at (0,1) intersects the x-axis.

48. At a time t hours after it was administered, the concentration of a drug in the body is f(t) = 27e−0.14t ng/ml. What is the concentration 4 hours after it was administered? At what rate is the concentration changing at that time?
49. The cost of producing a quantity, q, of a product is given by
![]()
Find the cost and the marginal cost when q = 50. Interpret these answers in economic terms.
50. Carbon-14 is a radioactive isotope used to date objects. If A0 represents the initial amount of carbon-14 in the object, then the quantity remaining at time t, in years, is
![]()
(a) A tree, originally containing 185 micrograms of carbon-14, is now 500 years old. At what rate is the carbon-14 decaying now?
(b) In 1988, scientists found that the Shroud of Turin, which was reputed to be the burial cloth of Jesus, contained 91% of the amount of carbon-14 in freshly made cloth of the same material.5 According to this data, how old was the Shroud of Turin in 1988?
51. For the cost function C = 1000 + 300 ln q (in dollars), find the cost and the marginal cost at a production level of 500. Interpret your answers in economic terms.
52. In 2009, the population of Mexico was 111 million and growing 1.13% annually, while the population of the US was 307 million and growing 0.975% annually.6 If we measure growth rates in people/year, which population was growing faster in 2009?
53. In 2009, the population, P, of India was 1.166 billion and growing at 1.5% annually.7
(a) Give a formula for P in terms of time, t, measured in years since 2009.
(b) Find ![]() , and
, and ![]() . What do each of these represent in practical terms?
. What do each of these represent in practical terms?
54. (a) Find the equation of the tangent line to y = ln x at x = 1.
(b) Use it to calculate approximate values for ln(1.1) and ln(2).
(c) Using a graph, explain whether the approximate values are smaller or larger than the true values. Would the same result have held if you had used the tangent line to estimate ln(0.9) and ln(0.5)? Why?
55. Find the quadratic polynomial g(x) = ax2 + bx + c which best fits the function f(x) = ex at x = 0, in the sense that
![]()
Using a computer or calculator, sketch graphs of f and g on the same axes. What do you notice?
3.3 THE CHAIN RULE
We now see how to differentiate composite functions such as f(t) = ln(3t) and g(x) = e−x2.
The Derivative of a Composition of Functions
Suppose y = f (z) with z = g(t) for some inside function g and outside function f, where f and g are differentiable. A small change in t, called Δt, generates a small change in z, called Δz. In turn, Δz generates a small change in y, called Δy. Provided Δt and Δz are not zero, we can say
![]()
Since the derivative ![]() is the limit of the quotient
is the limit of the quotient ![]() as Δt gets smaller and smaller, this suggests
as Δt gets smaller and smaller, this suggests
The Chain Rule
If y = f(z) and z = g(t) are differentiable, then the derivative of y = f(g(t)) is given by
![]()
In words, the derivative of a composite function is the derivative of the outside function times the derivative of the inside function:
![]()
The following example shows us how to interpret the chain rule in practical terms.
| Example 1 | The amount of gas, G, in gallons, consumed by a car depends on the distance traveled, s, in miles, and s depends on the time, t, in hours. If 0.05 gallons of gas are consumed for each mile traveled, and the car is traveling at 30 miles/hr, how fast is gas being consumed? Give units. |
| Solution | We expect the rate of gas consumption to be in gallons/hr. We are told that
We want to calculate the rate at which gas is being consumed with respect to time, or dG/dt. We think of G as a function of s, and s as a function of t. By the chain rule we know that
Thus, gas is being consumed at a rate of 1.5 gallons/hour. |


The Chain Rule for Functions Given by Formulas
In order to use the chain rule to differentiate a composite function, we first rewrite the function using a new variable z to represent the inside function:
![]()
| Example 2 | Use a new variable z for the inside function to express each of the following as a composite function:
(a) y = ln(3t) (b) P = e−0.03t (c) w = 5(2r + 3)2. |
| Solution | (a) The inside function is 3t, so we have y = ln z with z = 3t.
(b) The inside function is −0.03t, so we have P = ez with z = −0.03t. (c) The inside function is 2r + 3, so we have w = 5z2 with z = 2r + 3. |
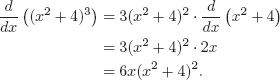
| Example 3 | Find the derivative of the following functions: (a) y = (4t2 + 1)7 (b) P = e3t. |
| Solution | (a) Here z = 4t2 + 1 is the inside function; y = z7 is the outside function. Since dy/dz = 7z6 and dz/dt = 8t, we have
(b) Let z = 3t and P = ez. Then dP/dz = ez and dz/dt = 3, so
Notice that the derivative formula for ekt introduced in Section 3.2 is just a special case of the chain rule. |
The derivative rules give us
![]()
Using the chain rule in addition, we have the following results.
| Example 4 | Differentiate (a) (3t3 −t)5 (b) ln(q2 + 1) (c) e−x2. |
| Solution | (a) Let z = 3t3 −t, giving
(b) We have z = q2 + 1, so
(c) Taking z = −x2, the derivative is
|
As we see in the following example, it is often faster to use the chain rule without introducing the new variable, z.
| Example 5 | Differentiate
|
| Solution | (a) We have
(b) We have
(c) Here we use the chain rule twice, giving
|


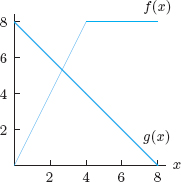
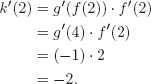
| Example 7 | Let h(x) = f (g(x)) and k(x) = g(f (x)). Use Figure 3.17 to estimate: (a) h′(1) (b) k′(2)
|
| Solution | (a) The chain rule tells us that h′(x) = f′(g(x)) · g′(x), so
We use the slopes of the lines in Figure 3.17 to find the derivatives f′(7) = 0 and g′(1) = −1. (b) The chain rule tells us that k′(x) = g′(f (x)) · f′(x), so
We use slopes to compute the derivatives g′(4) = −1 and f′(2) = 2. |

Relative Rates and Logarithms
In Section 2.3 we defined the relative rate of change of a function z = f(t) to be
![]()
Since
![]()
we have the following result:
For any positive function f(t),

Just as linear functions have constant rates of change, in the following example we see that exponential functions have constant relative rates of change.
| Example 8 | Find the relative rate of change of the exponential function z = P0 ekt. |
| Solution | Since
we have
The relative rate of change of the exponential function P0ekt is the constant k. |
| Example 9 | The surface area S of a mammal, in cm2, is a function of the body mass, M, of the mammal, in kilograms, and is given by S = 1095 · M2/3. Find the relative rate of change of S with respect to M and evaluate for a human with body mass 70 kilograms. Interpret your answer. |
| Solution | We have
Thus,
For a human with body mass M = 70 kilograms, we have
The surface area of a human with body mass 70 kilograms increases by about 0.95% if body mass increases by 1 kilogram. |

Problems for Section 3.3
Find the derivative of the functions in Problems 1–27.
1. f(x) = (x + 1)99
2. g(x) = (4x2 + 1)7
3. w = (t2 + 1)100
4. R = (q2 + 1)4
5. w = (5r − 6)3
6. f(x) = (x3 + x2)−90
7. y = 12−3x2 +2e3x
8. ![]()
9. f(x) = 6e5x + e−x2
10. C = 12(3q2 − 5)3
11. w = e−3t2
12. y = 5e5t+1
13. y = ln(5t + 1)
14. ![]()
15. f(t) = ln(t2 + 1)
16. f(x) = ln(1 − x)
17. f(x) = ln(ex + 1)
18. f(x) = ln(1 − e−x)
19. f(x) = ln(ln x)
20. f(x) = (ln x)3
21. y = 5 + ln(3t + 2)
22. y = (5 + ex)2
23. y = 5x + ln(x + 2)
24. ![]()
25. P = (1 + ln x)0.5
26. f(θ) = (eθ + e−θ)−1
27. ![]()
In Problems 28–29, find the relative rate of change f′(t) /f(t) at the given value of t. Assume t is in years and give your answer as a percent.
28. f(t) = 2e0.3t; t = 7
29. f(t) = ln(t2 + 1); t = 2
In Problems 30–33, find the relative rate of change of f(t) using the formula ![]() ln f(t)
ln f(t)
30. f(t) = 6.8e−0.5t
31. f(t) = 5e1.5t
32. f(t) = 4.5t−4
33. f(t) = 3t2
34. Find the equation of the tangent line to f(x) = (x − 1)3 at the point where x = 2.
35. If you invest P dollars in a bank account at an annual interest rate of r%, then after t years you will have B dollars, where
![]()
(a) Find dB/dt, assuming P and r are constant. In terms of money, what does dB/dt represent?
(b) Find dB/dr, assuming P and t are constant. In terms of money, what does dB/dr represent?
36. A firm estimates that the total revenue, R, received from the sale of q goods is given by
![]()
Calculate the marginal revenue when q = 10.
37. The distance, s, of a moving body from a fixed point is given as a function of time by s = 20et/2. Find the velocity, v, of the body as a function of t.
38. The distance traveled, D in feet, is a function of time, t, in seconds, with ![]() . Find f(10), f′(10), and the relative rate of change f′/f at t = 10. Interpret your answers in terms of distance traveled.
. Find f(10), f′(10), and the relative rate of change f′/f at t = 10. Interpret your answers in terms of distance traveled.
For Problems 39–42, let h(x) = f(g(x)) and k(x) = g(f (x)). Use Figure 3.18 to estimate the derivatives.
39. h′(1)
40. k′(1)
41. h′(2)
42. k′(2)
In Problems 43–48, use Figure 3.19 to evaluate the derivative.

43. ![]()
44. ![]()
45. ![]()
46. ![]()
47. ![]()
48. ![]()
49. Given y = f(x) with f (1) = 4 and f′(1) = 3, find
(a). ![]()
(b). ![]()
50. Some economists suggest that an extra year of education increases a person's wages, on average, by about 14%. Assume you could make $10 per hour with your current level of education and that inflation increases wages at a continuous rate of 3.5% per year.
(a) How much would you make per hour with four additional years of education?
(b) What is the difference between your wages in 20 years' time with and without the additional four years of education?
(c) Is the difference you found in part (b) increasing with time? If so, at what rate? (Assume the number of additional years of education stays fixed at four.)
51. Show that if the graphs of f(t) and h(t) = Aekt are tangent at t = a, then k is the relative rate of change of f at t = a.
3.4 THE PRODUCT AND QUOTIENT RULES
This section shows how to find the derivatives of products and quotients of functions.
The Product Rule
Suppose we know the derivatives of f(x) and g(x) and want to calculate the derivative of the product, f (x)g(x). We start by looking at an example. Let f(x) = x and g(x) = x2. Then
![]()
so the derivative of the product is 3x2. Notice that the derivative of the product is not equal to the product of the derivatives, since f′(x) = 1 and g′(x) = 2x, so f′(x)g′(x) = (1)(2x) = 2x. In general, we have the following rule, which is justified in the Focus on Theory section at the end of this chapter.
The Product Rule
If u = f(x) and v = g(x) are differentiable functions, then
![]()
The product rule can also be written
![]()
In words:
The derivative of a product is the derivative of the first times the second, plus the first times the derivative of the second.
We check that this rule gives the correct answers for f(x) = x and g(x) = x2. The derivative of f (x)g(x) is
![]()
This is the answer we expect for the derivative of f(x)g(x) = x · x2 = x3.
| Example 1 | Differentiate |
| Solution | (a) Using the product rule, we have
(b) Differentiating using the product rule gives
(c) The product rule gives
|


| Example 2 | Find the derivative of C = |
| Solution | We write C = e2tt−1 and use the product rule:
|

| Example 3 | A demand curve for a product has the equation p = 80e−0.003q, where p is price and q is quantity sold.
(a) Find the revenue as a function of quantity sold. (b) Find the marginal revenue function. |
| Solution | (a) Since Revenue = Price × Quantity, we have R = pq = (80e−0.003q)q = 80qe−0.003q.
(b) The marginal revenue function is the derivative of revenue with respect to quantity. The product rule gives
|

The Quotient Rule
Suppose we want to differentiate a function of the form Q(x) = f(x)/g(x). (Of course, we have to avoid points where g(x) = 0.) We want a formula for Q′ in terms of f′ and g′. We have the following rule, which is justified in the Focus on Theory section at the end of this chapter.
The Quotient Rule
If u = f(x) and v = g(x) are differentiable functions, then

or equivalently,

In words:
The derivative of a quotient is the derivative of the numerator times the denominator minus the numerator times the derivative of the denominator, all over the denominator squared.
| Example 4 | Differentiate |
| Solution | (a) Using the quotient rule
(b) Differentiating using the quotient rule yields
(c) The quotient rule gives
|


| Example 5 | If f (2) = 1 f′(2) = 5, g(2) = 3 and g′(2) = 6, find
|
| Solution | (a) Differentiating using the product rule yields
(b) Differentiating using the quotient rule yields
|

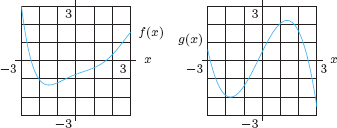
| Example 6 | Let h(x) = f(x)g(x) and k(x) = f(x)/g(x). Use Figure 3.20 to estimate: (a) h′(2) (b) k′(6)
|
| Solution | (a) The product rule tells us that h′(x) = f′(x)g(x) + f(x)g′(x), so
We use the slopes of the lines in Figure 3.20 to find the derivatives f′(2) = 2 and g′(2) = −1. (b) The quotient rule tells us that k′(x) = (f′(x)g(x) − f(x)g′(x))/[g(x)]2, so
We use slopes to compute the derivatives f′(6) = 0 and g′(6) = −1. |


Problems for Section 3.4
1. If f(x) = x2(x3 + 5), find f′(x) two ways: by using the product rule and by multiplying out before taking the derivative. Do you get the same result? Should you?
2. If f(x) = (2x + 1)(3x − 2), find f′(x) two ways: by using the product rule and by multiplying out. Do you get the same result?
For Problems 3–32, find the derivative. Assume that a, b, c, and k are constants.
3. f(t) = te−2t
4. f(x) = xex
5. y = t2(3t + 1)3
6. y = 5xex2
7. y = x ln x
8. y = (t2 + 3)et
9. y = (t3 − 7t2 + 1)et
10. z = (3t + 1)(5t + 2)
11. R = 3qe−q
12. P = t2 ln t
13. ![]()
14. ![]()
15. y = te−t2
16. f(t) = te5−2t
17. g(p) = p ln(2p + 1)
18. y = x · 2x
19. f(w) = (5w2+3)ew2
20. w = (t3 + 5t)(t2 − 7t + 2)
21. z = (te3t + e5t)9
22. ![]()
23. ![]()
24. ![]()
25. ![]()
26. ![]()
27. ![]()
28. ![]()
29. f(x) = axe−bx
30. f(x) = (ax2 + b)3
31. ![]()
32. f(t) = aebt
33. If f(x) = (3x + 8)(2x − 5), find f′(x) and f″(x).
34. Find the equation of the tangent line to the graph of ![]() at the point at which x = 0.
at the point at which x = 0.
35. Find the equation of the tangent line to the graph of f(x) = x2e−x at x = 0. Check by graphing this function and the tangent line on the same axes.
36. The quantity of a drug, Q mg, present in the body t hours after an injection of the drug is given is
![]()
Find f(1), f′(1), f(5), and f′(5). Give units and interpret the answers.
37. A drug concentration curve is given by C = f(t) = 20te−0.04t, with C in mg/ml and t in minutes.
(a) Graph C against t. Is f′(15) positive or negative? Is f′(45) positive or negative? Explain.
(b) Find f (30) and f′(30) analytically. Interpret them in terms of the concentration of the drug in the body.
38. If p is price in dollars and q is quantity, demand for a product is given by
![]()
(a) What quantity is sold at a price of $10?
(b) Find the derivative of demand with respect to price when the price is $10 and interpret your answer in terms of demand.
39. The demand for a product is given in Problem 38. Find the revenue and the derivative of revenue with respect to price at a price of $10. Interpret your answers in economic terms.
40. The quantity demanded of a certain product, q, is given in terms of p, the price, by
![]()
(a) Write revenue, R, as a function of price.
(b) Find the rate of change of revenue with respect to price.
(c) Find the revenue and rate of change of revenue with respect to price when the price is $10. Interpret your answers in economic terms.
41. If ![]() , what is f′(t)?
, what is f′(t)?
42. The quantity, q, of a certain skateboard sold depends on the selling price, p, in dollars, so we write q = f (p). You are given that f (140) = 15,000 and f′(140) = −100.
(a) What do f (140) = 15,000 and f′(140) = −100 tell you about the sales of skateboards?
(b) The total revenue, R, earned by the sale of skateboards is given by ![]() .
.
(c) What is the sign of ![]() ? If the skateboards are currently selling for $140, what happens to revenue if the price is increased to $141?
? If the skateboards are currently selling for $140, what happens to revenue if the price is increased to $141?
43. Show that the relative rate of change of a product f g is the sum of the relative rates of change of f and g.
44. Show that the relative rate of change of a quotient f/g is the difference between the relative rates of change of f and g.
![]()
46. For positive constants c and k, the Monod growth curve describes the growth of a population, P, as a function of the available quantity of a resource, r:
![]()
Find dP/dr and interpret it in terms of the growth of the population.
47. If a someone is lost in the wilderness, the search and rescue team identifies the boundaries of the search area and then uses probabilities to help optimize the chances of finding the person, assuming the subject is immobile. The probability, O, of the person being outside the search area after the search has begun and the person has not been found, is given by
![]()
where I is the probability of the person being outside the search area at the start of the search and E is the search effort, a measure of how well the search area has been covered by the resources in the field.
(a) If there was a 20% chance that the subject was not in the search area at the start of the search, and the search effort was 80%, what is the current probability of the person being outside the search area? (Probabilities are between 0 and 1, so 20% = 0.2 and 80% = 0.8.)
(b) In practical terms, what does I = 1 mean? Is this realistic?
(c) Evaluate O′(E). Is it positive or negative? What does that tell you about O as E increases?
3.5 DERIVATIVES OF PERIODIC FUNCTIONS
Since the sine and cosine functions are periodic, their derivatives must be periodic also. (Why?) Let's look at the graph of f(x) = sin x in Figure 3.21 and estimate the derivative function graphically.

Figure 3.21: The sine function
First we might ask ourselves where the derivative is zero. (At x = ±π/2, ±3π/2, ±5π/2, etc.) Then ask where the derivative is positive and where it is negative. (Positive for −π/2 < x < π/2; negative for π/2 < x < 3π/2, etc.) Since the largest positive slopes are at x = 0, 2π, and so on, and the largest negative slopes are at x = π, 3π, and so on, we get something like the graph in Figure 3.22.

Figure 3.22: Derivative of f(x) = sin x
The graph of the derivative in Figure 3.22 looks suspiciously like the graph of the cosine function. This might lead us to conjecture, quite correctly, that the derivative of the sine is the cosine. However, we cannot be sure just from the graphs.
One thing we can do is to check that the derivative function in Figure 3.22 has amplitude 1 (as it must if it is the cosine). That means we have to convince ourselves that the derivative of f(x) = sin x is 1 when x = 0. The next example suggests that this is true when x is in radians.
Warning: It is important to notice that in the previous example x was in radians; any conclusions we have drawn about the derivative of sin x are valid only when x is in radians.
| Example 2 | Starting with the graph of the cosine function, sketch a graph of its derivative. |
| Solution | The graph of g(x) = cos x is in Figure 3.23(a). Its derivative is 0 at x = 0, ±π, ±2π, and so on; it is positive for −π < x < 0, π < x < 2π, and so on, and it is negative for 0 < x < π, 2π < x < 3π, and so on. The derivative is in Figure 3.23(b).
|

As we did with the sine, we'll use the graphs to make a conjecture. The derivative of the cosine in Figure 3.23(b) looks exactly like the graph of sine, except reflected about the x-axis. It turns out that the derivative of cos x is − sin x.
For x in radians,
![]()
| Example 3 | Differentiate (a) 5 sin t − 8 cos t (b) 5 − 3 sin x + x3 |
| Solution | (a) Differentiating gives
(b) We have
|
The chain rule tells us how to differentiate composite functions involving the sine and cosine. Suppose y = sin(3t), so y = sin z and z = 3t, so
![]()
In general,
If z is a differentiable function of t, then
![]()
In many applications, z = kt for some constant k. Then we have:
If k is a constant, then
![]()
| Example 4 | Differentiate:
(a) sin(t2) (b) 5 cos(2t) (c) t sin t. |
| Solution | (a) We have y = sin z with z = t2, so
(b) We have y = 5 cos z with z = 2t, so
(c) We use the product rule:
|
Problems for Section 3.5
Differentiate the functions in Problems 1–20. Assume that A and B are constants.
1. P = 3 + cos t
2. y = 5 sin x
3. y = B + A sin t
4. y = t2 + 5 cos t
5. y = 5 sin x − 5x + 4
6. R(q) = q2 − 2 cos q
7. R = sin(5t)
8. f(x) = sin(3x)
9. y = 2 cos(5t)
10. W = 4 cos(t2)
11. y = A sin(Bt)
12. y = sin(x2)
13. y = 6 sin(2t)+cos(4t)
14. z = cos(4θ)
15. f(x) = 2x sin(3x)
16. f(x) = x2 cosx
17. ![]()
18. ![]()
19. ![]()
20. ![]()
21. Find the equation of the tangent line to the graph of y = sin x at x = π. Graph the function and the tangent line on the same axes.
22. Is the graph of y = sin(x4) increasing or decreasing when x = 10? Is it concave up or concave down?
23. Find the equations of the tangent lines to the graph of f(x) = sin x at x = 0 and at x = π/3. Use each tangent line to approximate sin(π/6). Would you expect these results to be equally accurate, since they are taken equally far away from x = π/6 but on opposite sides? If the accuracy is different, can you account for the difference?
24. If t is the number of months since June, the number of bird species, N, found in an Ohio forest oscillates approximately according to the formula
![]()
(a) Graph f(t) for 0 ≤ t ≤ 24 and describe what it shows. Use the graph to decide whether f′ (1) and f′(10) are positive or negative.
(b) Find f′(t).
(c) Find and interpret f (1), f′(1), f (10), and f′(10).
25. The average adult takes about 12 breaths per minute. As a patient inhales, the volume of air in the lung increases. As the patient exhales, the volume of air in the lung decreases. For t in seconds since start of the breathing cycle, the volume of air inhaled or exhaled since t = 0 is given,8 in hundreds of cubic centimeters, by
![]()
(a) How long is one breathing cycle?
(b) Find A′(1) and explain what it means.
26. A company's monthly sales, S(t), are seasonal and given as a function of time, t, in months, by
![]()
(a) Graph S(t) for t = 0 to t = 12. What is the maximum monthly sales? What is the minimum monthly sales? If t = 0 is January 1, when during the year are sales highest?
(b) Find S(2) and S′(2). Interpret in terms of sales.
27. A boat at anchor is bobbing up and down in the sea. The vertical distance, y, in feet, between the sea floor and the boat is given as a function of time, t, in minutes, by
![]()
(a) Find the vertical velocity, v, of the boat at time t.
(b) Make rough sketches of y and v against t.
28. The depth of the water, y, in meters, in the Bay of Fundy, Canada, is given as a function of time, t, in hours after midnight, by the function
![]()
How quickly is the tide rising or falling (in meters/hour) at each of the following times?
(a) 6:00 am
(b) 9:00 am
(c) Noon
(d) 6:00 pm
29. Paris, France, has a latitude of approximately 49° N. If t is the number of days since the start of 2009, the number of hours of daylight in Paris can be approximated by
![]()
(a) Find D(40) and D′(40). Explain what this tells about daylight in Paris.
(b) Find D(172) and D′(172). Explain what this tells about daylight in Paris.
30. On July 7, 2009, there was a full moon in the Eastern time zone.9 If t is the number of days since July 7th, the percent of moon illuminated can be represented by
![]()
(a) Find H′(t). Explain what this tells about the moon.
(b) For 0 ≤ t ≤ 30, when is H′(t) = 0? What does this tell us about the moon?
(c) For 0 ≤ t ≤ 30, when is H′(t) negative? When is it positive? Explain what positive and negative values of H′(t) tell us about the moon.
CHAPTER SUMMARY
- Derivatives of elementary functions
Powers, polynomials, exponential functions, logarithms, periodic functions
- Derivatives of sums, differences, constant multiples
- Chain rule
- Product and quotient rules
- Relative rates of change
Using logarithms
- Tangent line approximation
- Interpreting derivatives found using formulas
REVIEW PROBLEMS FOR CHAPTER THREE
Find the derivatives for the functions in Problems 1–40. Assume k is a constant.
1. f(t) = 6t4
2. f(x) = x3 − 3x2 + 5x
3. P(t) = e2t
4. W = r3 + 5r − 12
5. C = e0.08q
6. y = 5e−0.2t
7. y = xe3x
8. s(t) = (t2 +4)(5t −1)
9. g(t) = e(1+3t)2
10. f(x) = x2 + 3 ln x
11. Q(t) = 5t + 3e1.2t
12. g(z) = (z2 + 5)3
13. f(x) = 6(5x − 1)3
14. f(z) = ln(z2 + 1)
15. h(x) = (1 + ex)10
16. q = 100e−0.05p
17. y = x2 ln x
18. s(t) = t2 + 2 ln t
19. P = 4t2 + 7 sin t
20. R(t) = (sin t)5
21. h(t) = ln (e−t−t)
22. f(x) = sin(2x)
23. ![]()
24. ![]()
25. y = x2 cos x
26. h(x) = ln(1 + ex)
27. h(w) = eln w+1
28. h(x) = ln(x3 + x)
29. ![]()
30. ![]()
31. f(x) = xex
32. h(x) = sin(ex)
33. h(x) = cos(x3)
34. ![]()
35. ![]()
36. ![]()
37. ![]()
38. ![]()
39. ![]()
40. ![]()
41. Let f(x) = x2+1. Compute the derivatives f′ (0), f′(1), f′(2), and f′(−1). Check your answers graphically.
42. Let f(x) = x2 + 3x − 5. Find f′(0), f′(3), f′(−2).
43. Find the equation of the line tangent to the graph of f at (1,1), where f is given by f(x) = 2x3 − 2x2 + 1.
44. Some antique furniture increased very rapidly in price over the past decade. For example, the price of a particular rocking chair is well approximated by
![]()
where V is in dollars and t is in years since 2000. Find the rate, in dollars per year, at which the price is increasing at time t.
45. According to the US Census, the world population P, in billions, was approximately10
![]()
where t is in years since January 1, 2009. At what rate was the world's population increasing on that date? Give your answer in millions of people per year.
46. A football player kicks a ball at an angle of 30° from the ground with an initial velocity of 64 feet per second. Its height t seconds later is h(t) = 32t − 16t2.
(a) Graph the height of the ball as a function of the time.
(b) Find v(t), the velocity of the ball at time t.
(c) Find v(1), and explain what is happening to the ball at this time. What is the height of the ball at this time?
47. The graph of y = x3 − 9x2 − 16x + 1 has a slope of 5 at two points. Find the coordinates of the points.
48. (a) Find the slope of the graph of f(x) = 1 − ex at the point where it crosses the x-axis.
(b) Find the equation of the tangent line to the curve at this point.
49. Find the equation of the tangent line to the graph of P(t) = t ln t at t = 2. Graph the function P(t) and the tangent line Q(t) on the same axes.
50. The balance, $B, in a bank account t years after a deposit of $5000 is given by B = 5000e0.08t. At what rate is the balance in the account changing at t = 5 years? Use units to interpret your answer in financial terms.
51. If a cup of coffee is left on a counter top, it cools off slowly. The temperature in degrees Fahrenheit t minutes after it was left on the counter is given by
![]()
(a) What was the temperature of the coffee when it was left on the counter?
(b) If the coffee was left on the counter for a long time, what is the lowest temperature the coffee would reach? What does that temperature represent?
(c) Find C(5) and C′(5). Explain what this tells about the temperature of the coffee.
(d) Without calculation, decide if the magnitude of C′(50) is greater or less than the magnitude of C′(5)? Why?
52. With length, l, in meters, the period T, in seconds, of a pendulum is given by

(a) How fast does the period increase as l increases?
(b) Does this rate of change increase or decrease as l increases?
53. One gram of radioactive carbon-14 decays according to the formula
![]()
where Q is the number of grams of carbon-14 remaining after t years.
(a) Find the rate at which carbon-14 is decaying (in grams/year).
(b) Sketch the rate you found in part (a) against time.
54. The temperature, H, in degrees Fahrenheit (°F), of a can of soda that is put into a refrigerator to cool is given as a function of time, t, in hours, by
![]()
(a) Find the rate at which the temperature of the soda is changing (in °F/hour).
(b) What is the sign of dH/dt? Explain.
(c) When, for t ≥ 0, is the magnitude of dH/dt largest? In terms of the can of soda, why is this?
55. Explain for which values of a the function ax is increasing and for which values it is decreasing. Use the fact that, for a > 0,
![]()
56. Worldwide production of solar power, in megawatts, can be modeled by f(t) = 1040(1.3)t, where t is years11since 2000. Find f(0), f′(0), f(15), and f′(15). Give units and interpret your answers in terms of solar power.
57. The temperature Y in degrees Fahrenheit of a yam in a hot oven t minutes after it is placed there is given by
![]()
(a) What was the temperature of the yam when it was placed in the oven?
(b) What is the temperature of the oven?
(c) When does the yam reach 175° F?
(d) Estimate the rate at which the temperature of the yam is increasing when t = 20.
58. Kepler's third law of planetary motion states that P2 = kd3, where P represents the time, in earth days, it takes a planet to orbit the sun once, d is the planet's average distance, in miles, from the sun, and k is a constant.12
(a) If k = 1.65864 · 10−19, write P as a function of d.
(b) Mercury is approximately 36 million miles from the sun. How long does it take Mercury to orbit the sun?
(c) Find P′(d). What does the sign of the derivative tell us about the time it takes a planet to orbit the sun? Why does this make sense from a practical viewpoint?
59. Imagine you are zooming in on the graph of each of the following functions near the origin:

Which of them look the same? Group together those functions which become indistinguishable near the origin, and give the equations of the lines they look like.
60. Given a power function of the form f(x) = axn, with f′ (2) = 3 and f′ (4) = 24, find n and a.
61. Given r(2) = 4, s(2) = 1, s(4) = 2, r′(2) = −1, s′(2) = 3, and s′(4) = 3, compute the following derivatives, or state what additional information you would need to be able to compute the derivative.
(a) H′(2) if H(x) = r(x) + s(x)
(b) H′(2) if H(x) = 5s(x)
(c) H′(2) if H(x) = r(x) · s(x)
(d) H′(2) if H(x) = ![]()
62. Given F(2) = 1, F′(2) = 5, F(4) = 3, F′(4) = 7 and G(4) = 2, G′(4) = 6, G(3) = 4, G′(3) = 8, find:
(a) H(4) if H(x) = F(G(x))
(b) H′(4) if H(x) = F(G(x))
(c) H(4) if H(x) = G(F(x))
(d) H′(4) if H(x) = G(F(x))
63. A dose, D, of a drug causes a temperature change, T, in a patient. For C a positive constant, T is given by
![]()
(a) What is the rate of change of temperature change with respect to dose?
(b) For what doses does the temperature change increase as the dose increases?
64. A yam is put in a hot oven, maintained at a constant temperature 200° C. At time t = 30 minutes, the temperature T of the yam is 120° and is increasing at an (instantaneous) rate of 2°/min. Newton's law of cooling (or, in our case, warming) implies that the temperature at time t is given by
![]()
Find a and b.
For Problems 65–70, let h(x) = f(x) · g(x), and k(x) = f(x)/g(x), and l(x) = g(x)/f (x). Use Figure 3.24 to estimate the derivatives.

65. h′(1)
66. k′(1)
67. h′(2)
68. k′(2)
69. l′(1)
70. l′(2)
71. On what intervals is the graph of f(x) = x4 − 4x3 both decreasing and concave up?
72. Given p(x) = xn − x, find the intervals over which p is a decreasing function when:
(a) n = 2
(b) n = ![]()
(c) n = −1
73. Using the equation of the tangent line to the graph of ex at x = 0, show that
![]()
for all values of x. A sketch may be helpful.
74. In Section 1.10 the depth, y, in feet, of water in Portland, Maine is given in terms of t, the number of hours since midnight, by
![]()
(a) Find dy/dt. What does dy/dt represent, in terms of water level?
(b) For 0 ≤ t ≤ 24, when is dy/dt zero? (Figure 1.103 may be helpful.) Explain what it means (in terms of water level) for dy/dt to be zero.
75. Using a graph to help you, find the equations of all lines through the origin tangent to the parabola
![]()
Sketch the lines on the graph.
76. A museum has decided to sell one of its paintings and to invest the proceeds. If the picture is sold between the years 2000 and 2020 and the money from the sale is invested in a bank account earning 5% interest per year compounded annually, then B(t), the balance in the year 2020, depends on the year, t, in which the painting is sold and the sale price P(t). If t is measured from the year 2000 so that 0 < t < 20 then
![]()
(a) Explain why B(t) is given by this formula.
(b) Show that the formula for B(t) is equivalent to
![]()
(c) Find B′ (10), given that P(10) = 150,000 and P′(10) = 5000.
77. Figure 3.25 shows the number of gallons, G, of gasoline used on a trip of M miles.
(a) The function f is linear on each of the intervals 0 < M < 70 and 70 < M < 100. What is the slope of these lines? What are the units of these slopes?
(b) What is gas consumption (in miles per gallon) during the first 70 miles of this trip? During the next 30 miles?
(c) Figure 3.26 shows distance traveled, M (in miles), as a function of time t, in hours since the start of the trip. Describe this trip in words. Give a possible explanation for what happens one hour into the trip. What do your answers to part (b) tell you about the trip?
(d) If we let G = k(t) = f (h(t)), estimate k(0.5) and interpret your answer in terms of the trip.
(e) Find k′ (0.5) and k′ (1.5). Give units and interpret your answers.


78. The 2010 Census13 determined the population of the US was 308.75 million on April 1, 2010. If the population was increasing exponentially at a rate of 2.85 million per year on that date, find a formula for the population as a function of time, t, in years since that date.
79. The speed of sound in dry air is

where T is the temperature in degrees Celsius. Find a linear function that approximates the speed of sound for temperatures near 0°C.
80. Global temperatures have been rising, on average, for more than a century, sparking concern that the polar ice will melt and sea levels will rise. With t in years since 1880, fitting functions to the data14 gives three models for the average global temperature in Celsius:

(a) What family of functions is used in each model?
(b) Find the rate of change of temperature in 2010 in each of the three models. Give units.
(c) For each model, find the change in temperature over a 130-year period if the temperature had been changing at the rate you found in part (b) for that model.
(d) For each model, find the predicted change in temperature for the 130 years from 1880 to 2010.
(e) For which model, if any, are the answers equal in parts (c) and (d)?
(f) For which model is the discrepancy largest between the answers in parts (c) and (d)?
STRENGTHEN YOUR UNDERSTANDING
In Problems 1–50, indicate whether the statement is true or false.
1. If f(x) = 5x2 + 1 then f′ (−1) = −10.
2. The two functions f(x) = 3x5 and g(x) = 3x5 + 7 have the same derivative.
3. The derivative of h(t) = (3t2 + 1)(2t) is h′ (t) = (6t)(2) = 12t.
4. If k(s) = ![]() .
.
5. The equation of the line tangent to f(x) = x5 + 5 at x = 1 is y = 9x − 3.
6. The derivative of f(r) = 1/r5 is f′ (r) = 1/5r4.
7. The function g(w) = w3 − 3w has exactly two places where g′(w) = 0.
8. If f(x) = 3x3 − x2 + 2x then f is decreasing at x = 1.
9. If f(x) = 3x3 − x2 + 2x then the graph of f is concave up at x = 1.
10. If g(t) = tπ then g′(1) = π.
11. If f(x) = ex then f′(x) = xex−1.
12. If g(s) = 5 ln(s) then g′(2) = 5/2.
13. The function f(x) = 3ex + x has tangent line at x = 0 with equation y = 4x + 3.
14. The function h(x) = 2 ln x − x2 is decreasing at x = 1.
15. The graph of h(x) = 2 ln x − x2 is concave down at x = 1.
16. If f(x) = ln 2 then f′(x) = 1/2
17. If f(x) = e2x then f′(x) = e2x.
18. If w(q) = 10q then w′(q) = log(10) · 10q.
19. If k(p) = 5 · ep then k′(p) = ln 5 · ep.
20. If f(x) = 3e5x then f′(x) = 15e5x.
21. The derivative of f(t) = et2 is f′(t) = 2e2t.
22. If y = (x + x2)5 then dy/dx = 5(1 + 2x)4.
23. If y = ln(x2 + 4) then dy/dx = (2x)/(x2 + 4).
24. If y = ![]() .
.
25. If y = e−x then dy/dx = −e−x.
26. The chain rule says d/dt(f(g(t))) = f (g′(t)) · g(t).
27. If g(x) = ln(x2 + 3x) then g′(x) = (1/x)(2x + 3).
28. The function f(x) = e1−x is decreasing at x = 1.
29. The graph of f(x) = e1−x is concave up at x = 1.
30. If B = 30(1 + 2r)5 then dB/dr = 150(1 + 2r)4.
31. If y = ex ln(x) then y′ = ex/x.
32. If y = (x2 + 1)2x then y′ = 2x(ln 2)2x.
33. If y = x/ex then y′ = (ex − xex)/e2x = (1 − x)/ex.
34. If z = 2/(1 + t2) then z′ = −4t/(1 + t2)2.
35. If s = w2ew then s′ = 2wew.
36. If P = q ln(q2 + 1) then P′ = q/(q2 + 1) + ln(q2 + 1).
37. If y = ex ln x then y′ = ex ln x(1 + ln x).
38. Using the product rule to differentiate x2 · x2 gives the same result as differentiating x4 directly.
39. The derivative of the product of two functions is the product of their derivatives.
40. The derivative of the quotient of two functions is the quotient of their derivatives.
41. The derivative of sin t + cos t is cos t − sin t.
42. The second derivative of f(t) = sin t is f″(t) = sin t.
43. The second derivative of g(t) = cos t is g″(t) = − cos t.
44. If y = sin 2t then y′ = cos 2t.
45. If y = cos t2 then y′ = −sin 2t.
46. If z = (sin 2t) cos 3t then z′ = −6(cos 2t) sin 3t.
47. If y = sin(cos t) then y′ = cos(cos t) + sin(− sin t).
48. If P = 1/sin q then dP/dq = 1/cos q.
49. If Q = cos(π − t) then dQ/dt = sin(π − t).
50. If Q = sin(πt + 1) then dQ/dt = π cos(πt + 1).
PROJECTS FOR CHAPTER THREE
1. Coroner's Rule of Thumb
Coroners estimate time of death using the rule of thumb that a body cools about 2°F during the first hour after death and about 1°F for each additional hour. Assuming an air temperature of 68°F and a living body temperature of 98.6°F, the temperature T(t) in °F of a body at a time t hours since death is given by
![]()
(a) For what value of k will the body cool by 2°F in the first hour?
(b) Using the value of k found in part (a), after how many hours will the temperature of the body be decreasing at a rate of 1°F per hour?
(c) Using the value of k found in part (a), show that, 24 hours after death, the coroner's rule of thumb gives approximately the same temperature as the formula.
2. Air Pressure and Altitude
Air pressure at sea level is 30 inches of mercury. At an altitude of h feet above sea level, the air pressure, P, in inches of mercury, is given by
![]()
(a) Sketch a graph of P against h.
(b) Find the equation of the tangent line at h = 0.
(c) A rule of thumb used by travelers is that air pressure drops about 1 inch for every 1000-foot increase in height above sea level. Write a formula for the air pressure given by this rule of thumb.
(d) What is the relation between your answers to parts (b) and (c)? Explain why the rule of thumb works.
(e) Are the predictions made by the rule of thumb too large or too small? Why?
3. Relative Growth Rates: Population, GDP, and GDP per Capita
(a) Let Y be the world's annual production (GDP). The world GDP per capita is given by Y/P where P is world population. Figure 3.27 shows relative growth rate of GDP and GDP per capita for 1952–2000.15
(i) Explain why the vertical distance between the two curves gives the relative rate of growth of the world population.
(ii) Estimate the relative rate of population growth in 1970 and 2000.
(b) In 2006 the relative rate of change of the GDP in developing countries was 4.5% per year, and the relative rate of change of the population was 1.2%. What was the relative rate of change of the per capita GDP in developing countries?
(c) In 2006 the relative rate of change of the world's total production (GDP) was 3.8% per year, and the relative rate of change of the world's per capita production was 2.6% per year. What was the relative rate of change of the world population?

4. Keeling Curve: Atmospheric Carbon Dioxide
Since the 1950s, the carbon dioxide concentration in the air has been recorded at the Mauna Loa Observatory in Hawaii.16 A graph of this data is called the Keeling Curve, after Charles Keeling, who started recording the data. With t in years since 1950, fitting functions to the data gives three models for the carbon dioxide concentration in parts per million (ppm):

(a) What family of function is used in each model?
(b) Find the rate of change of carbon dioxide in 2010 in each of the three models. Give units.
(c) Arrange the three models in increasing order of the rates of change they give for 2010. (Which model predicts the largest rate of change in 2010? Which predicts the smallest?)
(d) Consider the same three models for all positive time t. Will the ordering in part (c) remain the same for all t? If not, how will it change?
FOCUS ON THEORY
ESTABLISHING THE DERIVATIVE FORMULAS
The graph of f(x)= x2 suggests that the derivative of x2 is f′(x) = 2x. However, as we saw in the Focus on Theory section in Chapter 2, to be sure that this formula is correct, we have to use the definition:
![]()
As in Chapter 2, we simplify the difference quotient and then take the limit as h approaches zero.
| Example 1 | Confirm that the derivative of g(x) = x3 is g′(x) = 3x2. |
| Solution | Using the definition, we calculate g′(x):
|

| Example 2 | Give an informal justification that the derivative of f(x) = ex is f′(x) = ex. |
| Solution | Using f(x) = ex, we have
What is the limit of
|


| Example 3 | Show that if f(x) = 2x2 + 1, then f′(x) = 4x. |
| Solution | We use the definition of the derivative with f(x) = 2x2 + 1:
To find the limit, look at what happens when h is close to 0, but h ≠ 0. Simplifying, we have
because as h gets close to 0, we know that 4x + 2h gets close to 4x. |

Using the Chain Rule to Establish Derivative Formulas
We use the chain rule to justify the formulas for derivatives of ln x and of ax.
Derivative of ln x
We'll differentiate an identity that involves ln x. In Section 1.6, we have elnx = x. Differentiating gives
![]()
On the left side, since ex is the outside function and ln x is the inside function, the chain rule gives
![]()
Thus, solving for ![]() , we have the result in Section 3.2,
, we have the result in Section 3.2,
![]()
Derivative of ax
Graphical arguments suggest that the derivative of ax is proportional to ax. Now we show that the constant of proportionality is ln a. For a > 0, we use the identity from Section 1.6:
![]()
On the left side, using ![]() and the chain rule gives
and the chain rule gives
![]()
Since ln a is a constant, differentiating the right side gives
![]()
Since the two sides are equal, we have
![]()
Solving for ![]() gives the result of Section 3.2. For a > 0,
gives the result of Section 3.2. For a > 0,
![]()
The Product Rule
Suppose we want to calculate the derivative of the product of differentiable functions, f(x)g(x), using the definition of the derivative. Notice that in the second step below, we are adding and subtracting the same quantity: f(x)g(x + h).

Taking the limit as h → 0 gives the product rule:
![]()
The Quotient Rule
Let Q(x) = f(x)/g(x) be the quotient of differentiable functions. Assuming that Q(x) is differentiable, we can use the product rule on f(x) = Q(x)g(x):
![]()
Substituting for Q(x) gives

Solving for Q′(x) gives

Multiplying the top and bottom by g(x) to simplify gives the quotient rule:

Problems on Establishing the Derivative Formulas
For Problems 1–7, use the definition of the derivative to obtain the following results.
1. If f(x) = 2x + 1, then f′(x) = 2.
2. If f(x) = 5x2, then f′(x) = 10x.
3. If f(x) = 2x2 + 3, then f′(x) = 4x.
4. If f(x) = x2 + x, then f′ (x) = 2x + 1.
5. If f(x) = 4x2 + 1, then f′(x) = 8x.
6. If f(x) = x4, then f′(x) = 4x3. [Hint: (x + h)4 = x4 + 4x3h + 6x2h2 + 4xh3 + h4.]
7. If f(x) = x5, then f′(x) = 5x4. [Hint: (x + h)5 = x5 + 5x4h + 10x3h2 + 10x2h3 + 5xh4 + h5.]
8. (a) Use a graph of g(h) = ![]() to explain why we believe that
to explain why we believe that ![]() .
.
(b) Use the definition of the derivative and the result from part (a) to explain why, if f(x) = 2x, we believe that f′(x) ≈ (0.6931)2x.
9. Use the definition of the derivative to show that if f(x) = C, where C is a constant, then f′(x) = 0.
10. Use the definition of the derivative to show that if f(x) = b + mx, for constants m and b, then f′(x) = m.
11. Use the definition of the derivative to show that if f(x) = k·u(x), where k is a constant and u(x) is a function, then f′(x) = k · u′(x)
12. Use the definition of the derivative to show that if f(x) = u(x) + v(x), for functions u(x) and v(x), then f′(x) = u′(x) + v′(x).
FOCUS ON PRACTICE
Find derivatives for the functions in Problems 1–63. Assume a, b, c, and k are constants.
1. f(t) = t2 + t4
2. g(x) = 5x4
3. y = 5x3 + 7x2 − 3x + 1
4. s(t) = 6t−2 + 3t3 − 4t1/2
5. ![]()
6. P(t) = 100e0.05t
7. f(x)= 5e2x − 2 · 3x
8. P(t) = 1,000(1.07)t
9. D(p) = ep2 + 5p2
10. y = t2e5t
11. ![]()
12. f(x) = ln (x2 + 1)
13. s (t) = 8 ln (2t + 1)
14. g(w) = w2 ln (w)
15. f(x) = 2x + x2 + 1
16. ![]()
17. C(q) = (2q + 1)3
18. g(x) = 5x(x + 3)2
19. P(t) = bekt
20. f(x) = ax2 + bx+ c
21. y = x2 ln (2x + 1)
22. f(t) = (et + 4)3
23. f(x) = 5 sin (2x)
24. W(r) = r2 cos r
25. g(t) = 3 sin (5t) + 4
26. y = e3t sin (2t)
27. y = 2ex + 3 sin x + 5
28. f(t) = 3t2 − 4t + 1
29. y = 17x + 24x 1/2
30. ![]()
31. ![]()
32. ![]()
33. ![]()
34. ![]()
35. g(x) = sin(2 − 3x)
36. f(z) = ![]()
37. q(r) = ![]()
38. y = x ln x − x + 2
39. j(x) = ln(eax + b)
40. ![]()
41. h(w) = (w4 − 2w)5
42. h(w) = w3 ln(10w)
43. f(x) = ln(sin x + cos x)
44. ![]()
45. ![]()
46. ![]()
47. v(t) = t2e−ct
48. ![]()
49. g(θ) = e sinθ
50. p(t) = e4t+2
51. ![]()
52. ![]()
53. ![]()
54. ![]()
55. ![]()
56. ![]()
57. ![]()
58. ![]()
59. y = (x2 + 5)3 (3x3 − 2)2
60. ![]()
61. ![]()
62. ![]()
63. ![]()
1Strogatz, S., ”Math and the City”, The New York Times, May 20, 2009.
2www.weather.gov/om/windchill/index.shtml Accessed April 21, 2009.
3http://www.indexmundi.com/world/. Accessed April 27, 2011.
4https://www.cia.gov/library/publications/the-world-factbook/print/hu.html, accessed April 14, 2009.
5The New York Times, October 18, 1988.
6https:/www.cia.gov/library/publications/the-world-factbook/print/ms.html and https://www.cia.gov/library/publications/the-world-factbook/print/us.html, accessed April 14, 2009.
7https://www.cia.gov/library/publications/the-world-factbook/print/in.html, accessed April 14, 2009.
8Based upon information obtained from Dr. Gadi Avshalomov on August 14, 2008.
9www.aa.usno.navy.mil/feq/docs/moon_phases.php, accessed on April 14, 2009.
10Based on 2009 World Population Data Sheet from http://www.prb.org/pdf09/09wpds_eng.pdf. Accessed March 10. 2013.
11https://www.solarbuzz.com/FastFactsIndustry.htm, accessed April 14, 2009.
12www.exploratorium.edu/ronh/age/index.html, accessed May 3, 2009.
13http://2010.census.gov/2010census/, accessed March 10, 2013.
14From data.giss.nasa.gov/gistemp/tabledate/GLB.Ts.txt, accessed April 2012.
15Angus Maddison, The World Economy: Historical Statistics, OECD, 2003.
16www.esrl.noaa.gov/gmd/ccgg/, accessed March 10, 2013.