

Chapter One
FUNCTIONS AND CHANGE
Contents
Function Notation and Intercepts
Increasing and Decreasing Functions
1.3 Average Rate of Change and Relative Change
Ratio of Relative Changes: Elasticity
1.4 Applications of Functions to Economics
Cost, Revenue, and Profit Functions
Marginal Cost, Revenue, and Profit
Elimination of a Drug from the Body
The General Exponential Function
Solving Equations Using Logarithms
Exponential Functions with Base e
1.7 Exponential Growth and Decay
Financial Applications: Compound Interest
1.9 Proportionality and Power Functions
Quadratic Functions and Polynomials
PROJECTS: Compound Interest, Population Center of the US, Medical Case Study: Anaphylaxis
1.1 WHAT IS A FUNCTION?
In mathematics, a function is used to represent the dependence of one quantity upon another.
Let's look at an example. Syracuse, New York has the highest annual snowfall of any US city because of the “lake-effect” snow coming from cold Northwest winds blowing over nearby Lake Ontario. Lake-effect snowfall has been heavier over the last few decades; some have suggested this is due to the warming of Lake Ontario by climate change. In December 2010, Syracuse got 66.9 inches of snow in one 12-day period, all of it from lake-effect snow. See Table 1.1.
Table 1.1 Daily snowfall in Syracuse, December 5–16, 2010
![]()
You may not have thought of something so unpredictable as daily snowfall as being a function, but it is a function of date, because each day gives rise to one snowfall total. There is no formula for the daily snowfall (otherwise we would not need a weather bureau), but nevertheless the daily snowfall in Syracuse does satisfy the definition of a function: Each date, t, has a unique snowfall, S, associated with it.
We define a function as follows:
A function is a rule that takes certain numbers as inputs and assigns to each a definite output number. The set of all input numbers is called the domain of the function and the set of resulting output numbers is called the range of the function.
The input is called the independent variable and the output is called the dependent variable. In the snowfall example, the domain is the set of December dates {5, 6, 7, 8, 9, 10, 11, 12, 13, 14, 15, 16} and the range is the set of daily snowfalls {0.0, 0.1, 1.4, 1.9, 3.4, 5.0, 6.8, 9.3, 11.9, 12.2, 14.9}. We call the function f and write S = f(t). Notice that a function may have identical outputs for different inputs (December 11 and 12, for example).
Some quantities, such as date, are discrete, meaning they take only certain isolated values (dates must be integers). Other quantities, such as time, are continuous as they can be any number. For a continuous variable, domains and ranges are often written using interval notation:
The set of numbers t such that a ≤ t ≤ b is called a closed interval and written [a, b].
The set of numbers t such that a ≤ t ≤ b is called an open interval and written (a, b).
The Rule of Four: Tables, Graphs, Formulas, and Words
Functions can be represented by tables, graphs, formulas, and descriptions in words. For example, the function giving the daily snowfall in Syracuse can be represented by the graph in Figure 1.1, as well as by Table 1.1.

Figure 1.1: Syracuse snowfall, December, 2010
Other functions arise naturally as graphs. Figure 1.2 contains electrocardiogram (EKG) pictures showing the heartbeat patterns of two patients, one normal and one not. Although it is possible to construct a formula to approximate an EKG function, this is seldom done. The pattern of repetitions is what a doctor needs to know, and these are more easily seen from a graph than from a formula. However, each EKG gives electrical activity as a function of time.

Figure 1.2: EKG readings on two patients
As another example of a function, consider the snow tree cricket. Surprisingly enough, all such crickets chirp at essentially the same rate if they are at the same temperature. That means that the chirp rate is a function of temperature. In other words, if we know the temperature, we can determine the chirp rate. Even more surprisingly, the chirp rate, C, in chirps per minute, increases steadily with the temperature, T, in degrees Fahrenheit, and can be computed, to a fair degree of accuracy, using the formula
![]()
Mathematical Modeling
A mathematical model is a mathematical description of a real situation. In this book we consider models that are functions, such as C = f(T) = 4T − 160.
Modeling almost always involves some simplification of reality. We choose which variables to include and which to ignore—for example, we consider the dependence of chirp rate on temperature, but not on other variables. The choice of variables is based on knowledge of the context (the biology of crickets, for example), not on mathematics. To test the model, we compare its predictions with observations.
In this book, we often model a situation that has a discrete domain with a continuous function whose domain is an interval of numbers. For example, the annual US gross domestic product (GDP) has a value for each year, t = 0, 1, 2, 3,.... We may model it by a function of the form G = f(t), with values for t in a continuous interval. In doing this, we expect that the values of f(t) match the values of the GDP at the points t = 0, 1, 2, 3,..., and that information obtained from f(t) closely matches observed values.
Used judiciously, a mathematical model captures trends in the data to enable us to analyze and make predictions. A common way of finding a model is described in Appendix A.
Function Notation and Intercepts
We write y = f(t) to express the fact that y is a function of t. The independent variable is t, the dependent variable is y, and f is the name of the function. The graph of a function has an intercept where it crosses the horizontal or vertical axis. Horizontal intercepts are also called the zeros of the function.
| Example 1 | (a) Graph the cricket chirp rate function, C = f(T) = 4T − 160.
(b) Solve f(T) = 0 and interpret the result. |
| Solution | (a) The graph is in Figure 1.3.
Figure 1.3: Cricket chirp rate as a function of temperature (b) Solving f(T) = 0 gives the horizontal intercept:
Thus at a temperature of 40°F, the chirp rate is zero. For temperatures below 40°F, the model would predict negative values of C, so we conclude that the model does not apply for such temperature values. |


| Example 2 | The value of a car, V, is a function of the age of the car, a, so V = g(a), where g is the name we are giving to this function.
(a) Interpret the statement g(5) = 9 in terms of the value of a car if V is in thousands of dollars and a is in years. (b) In the same units, the value of a Honda1 is approximated by g(a) = 13.78 − 0.8a. Find and interpret the vertical and horizontal intercepts of the graph of this depreciation function g. |
| Solution | (a) Since V = g(a), the statement g(5) = 9 means V = 9 when a = 5. This tells us that the car is worth $9000 when it is 5 years old.
(b) Since V = g(a), a graph of the function g has the value of the car on the vertical axis and the age of the car on the horizontal axis. The vertical intercept is the value of V when a = 0. It is V = g(0) = 13.78, so the Honda was valued at $13,780 when new. The horizontal intercept is the value of a such that g(a) = 0, so
At age 17 years, the Honda has no value. |

Increasing and Decreasing Functions
In the previous examples, the chirp rate increases with temperature, while the value of the Honda decreases with age. We express these facts saying that f is an increasing function, while g is decreasing. See Figure 1.4. In general:
A function f is increasing if the values of f(x) increase as x increases.
A function f is decreasing if the values of f(x) decrease as x increases.
The graph of an increasing function climbs as we move from left to right.
The graph of a decreasing function descends as we move from left to right.

Figure 1.4: Increasing and decreasing functions
Problems for Section 1.1
1. Which graph in Figure 1.5 best matches each of the following stories?2 Write a story for the remaining graph.
(a) I had just left home when I realized I had forgotten my books, so I went back to pick them up.
(b) Things went fine until I had a flat tire.
(c) I started out calmly but sped up when I realized I was going to be late.

In Problems 2–5, use the description of the function to sketch a possible graph. Put a label on each axis and state whether the function is increasing or decreasing.
2. The height of a sand dune is a function of time, and the wind erodes away the sand dune over time.
3. The amount of carbon dioxide in the atmosphere is a function of time, and is going up over time.
4. The number of air conditioning units sold is a function of temperature, and goes up as the temperature goes up.
5. The noise level, in decibels, is a function of distance from the source of the noise, and the noise level goes down as the distance increases.
6. The population of Washington DC grew from 1900 to 1950, stayed approximately constant during the 1950s, and decreased from about 1960 to 2005. Graph the population as a function of years since 1900.
7. Let W = f(t) represent wheat production in Argentina,3 in millions of metric tons, where t is years since 2006. Interpret the statement f(4) = 14 in terms of wheat production.
8. The concentration of carbon dioxide, C = f(t), in the atmosphere, in parts per million (ppm), is a function of years, t, since 1960.
(a) Interpret f(40) = 370 in terms of carbon dioxide.4
(b) What is the meaning of f(50)?
9. (a) The graph of r = f(p) is in Figure 1.6. What is the value of r when p is 0? When p is 3?
(b) What is f(2)?

For the functions in Problems 10–14, find f(5).
10. f(x) = 2x + 3
11. f(x) = 10x − x2
12.

13.

14.
![]()
(a) Find the value of y when x is zero.
(b) What is f(3)?
(c) What values of x give y a value of 11?
(d) Are there any values of x that give y a value of 1?
In Problems 16–19 the function S = f(t) gives the average annual sea level, S, in meters, in Aberdeen, Scotland,5 as a function of t, the number of years before 2008. Write a mathematical expression that represents the given statement.
16. In 1983 the average annual sea level in Aberdeen was 7.019 meters.
17. The average annual sea level in Aberdeen in 2008.
18. The average annual sea level in Aberdeen was the same in 1865 and 1911.
19. The average annual sea level in Aberdeen increased by 1 millimeter from 2007 to 2008.
20. (a) A potato is put in an oven to bake at time t = 0. Which of the graphs in Figure 1.7 could represent the potato's temperature as a function of time?
(b) What does the vertical intercept represent in terms of the potato's temperature?

21. An object is put outside on a cold day at time t = 0. Its temperature, H = f(t), in °C, is graphed in Figure 1.8.
(a) What does the statement f(30) = 10 mean in terms of temperature? Include units for 30 and for 10 in your answer.
(b) Explain what the vertical intercept, a, and the horizontal intercept, b, represent in terms of temperature of the object and time outside.

22. In the Andes mountains in Peru, the number, N, of species of bats is a function of the elevation, h, in feet above sea level, so N = f(h).
(a) Interpret the statement f(500) = 100 in terms of bat species.
(b) What are the meanings of the vertical intercept, k, and horizontal intercept, c, in Figure 1.9?

23. In tide pools on the New England coast, snails eat algae. Describe what Figure 1.10 tells you about the effect of snails on the diversity of algae.6 Does the graph support the statement that diversity peaks at intermediate predation levels?

24. Figure 1.11 shows the amount of nicotine, N = f(t), in mg, in a person's bloodstream as a function of the time, t, in hours, since the person finished smoking a cigarette.
(a) Estimate f(3) and interpret it in terms of nicotine.
(b) About how many hours have passed before the nicotine level is down to 0.1 mg?
(c) What is the vertical intercept? What does it represent in terms of nicotine?
(d) If this function had a horizontal intercept, what would it represent?

25. A deposit is made into an interest-bearing account. Figure 1.12 shows the balance, B, in the account t years later.
(a) What was the original deposit?
(b) Estimate f(10) and interpret it.
(c) When does the balance reach $5000?

26. The use of CFCs (chlorofluorocarbons) has declined since the 1987 Montreal Protocol came into force to reduce the use of substances that deplete the ozone layer. World annual CFC consumption, C = f(t), in million tons, is a function of time, t, in years since 1987. (CFCs are measured by the weight of ozone that they could destroy.)
(a) Interpret f(10) = 0.2 in terms of CFCs.7
(b) Interpret the vertical intercept of the graph of this function in terms of CFCs.
(c) Interpret the horizontal intercept of the graph of this function in terms of CFCs.
27. When a patient with a rapid heart rate takes a drug, the heart rate plunges dramatically and then slowly rises again as the drug wears off. Sketch the heart rate against time from the moment the drug is administered.
28. The gas mileage of a car (in miles per gallon) is highest when the car is going about 45 miles per hour and is lower when the car is going faster or slower than 45 mph. Graph gas mileage as a function of speed of the car.
29. After an injection, the concentration of a drug in a patient's body increases rapidly to a peak and then slowly decreases. Graph the concentration of the drug in the body as a function of the time since the injection was given. Assume that the patient has none of the drug in the body before the injection. Label the peak concentration and the time it takes to reach that concentration.
30. Financial investors know that, in general, the higher the expected rate of return on an investment, the higher the corresponding risk.
(a) Graph this relationship, showing expected return as a function of risk.
(b) On the figure from part (a), mark a point with high expected return and low risk. (Investors hope to find such opportunities.)
31. The number of sales per month, S, is a function of the amount, a (in dollars), spent on advertising that month, so S = f(a).
(a) Interpret the statement f(1000) = 3500.
(b) Which of the graphs in Figure 1.13 is more likely to represent this function?
(c) What does the vertical intercept of the graph of this function represent, in terms of sales and advertising?

32. Figure 1.14 shows fifty years of fertilizer use in the US, India, and the former Soviet Union.8
(a) Estimate fertilizer use in 1970 in the US, India, and the former Soviet Union.
(b) Write a sentence for each of the three graphs describing how fertilizer use has changed in each region over this 50-year period.

33. The six graphs in Figure 1.15 show frequently observed patterns of age-specific cancer incidence rates, in number of cases per 1000 people, as a function of age.9 The scales on the vertical axes are equal.
(a) For each of the six graphs, write a sentence explaining the effect of age on the cancer rate.
(b) Which graph shows a relatively high incidence rate for children? Suggest a type of cancer that behaves this way.
(c) Which graph shows a brief decrease in the incidence rate at around age 50? Suggest a type of cancer that might behave this way.
(d) Which graph or graphs might represent a cancer that is caused by toxins which build up in the body over time? (For example, lung cancer.) Explain.

34. Table 1.2 shows the average annual sea level, S, in meters, in Aberdeen, Scotland,10 as a function of time, t, measured in years before 2008.
(a) What was the average sea level in Aberdeen in 2008?
(b) In what year was the average sea level 7.019 meters? 6.957 meters?
(c) Table 1.3 gives the average sea level, S, in Aberdeen as a function of the year, x. Complete the missing values.
Problems 35–38 ask you to plot graphs based on the following story: “As I drove down the highway this morning, at first traffic was fast and uncongested, then it crept nearly bumper-to-bumper until we passed an accident, after which traffic flow went back to normal until I exited.”
35. Driving speed against time on the highway
36. Distance driven against time on the highway
37. Distance from my exit vs time on the highway
38. Distance between cars vs distance driven on the highway
1.2 LINEAR FUNCTIONS
Probably the most commonly used functions are the linear functions, whose graphs are straight lines. The chirp-rate and the Honda depreciation functions in the previous section are both linear. We now look at more examples of linear functions.
Olympic and World Records
During the early years of the Olympics, the height of the men's winning pole vault increased approximately 8 inches every four years. Table 1.4 shows that the height started at 130 inches in 1900, and increased by the equivalent of 2 inches a year between 1900 and 1912. So the height was a linear function of time.
If y is the winning height in inches and t is the number of years since 1900, we can write
![]()
Since y = f(t) increases with t, we see that f is an increasing function. The coefficient 2 tells us the rate, in inches per year, at which the height increases. This rate is the slope of the line in Figure 1.16. The slope is given by the ratio
![]()
Calculating the slope (rise/run) using any other two points on the line gives the same value.
What about the constant 130? This represents the initial height in 1900, when t = 0. Geometrically, 130 is the intercept on the vertical axis.
You may wonder whether the linear trend continues beyond 1912. Not surprisingly, it does not exactly. The formula y = 130 + 2t predicts that the height in the London 2012 Olympics would be 354 inches or 29 feet 6 inches, which is considerably higher than the actual value of 19 feet 7.04 inches.11 There is clearly a danger in extrapolating too far from the given data. You should also observe that the data in Table 1.4 is discrete, because it is given only at specific points (every four years). However, we have treated the variable t as though it were continuous, because the function y = 130 + 2t makes sense for all values of t. The graph in Figure 1.16 is of the continuous function because it is a solid line, rather than four separate points representing the years in which the Olympics were held.

Figure 1.16: Olympic pole vault records

Figure 1.17: World record time to run the mile
| Example 1 | If y is the world record time to run the mile, in seconds, and t is the number of years since 1900, then records show that, approximately,
Explain the meaning of the intercept, 260, and the slope, −0.4, in terms of the world record time to run the mile and sketch the graph. |
| Solution | The intercept, 260, tells us that the world record was 260 seconds in 1900 (at t = 0). The slope, −0.4, tells us that the world record decreased at a rate of about 0.4 seconds per year. See Figure 1.17. |
Slope and Rate of Change
We use the symbol Δ (the Greek letter capital delta) to mean “change in,” so Δx means change in x and Δy means change in y.

Figure 1.18: Difference quotient = ![]()
The slope of a linear function y = f (x) can be calculated from values of the function at two points, given by x1 and x2, using the formula

The quantity (f(x2) − f(x1))/(x2 − x1) is called a difference quotient because it is the quotient of two differences. (See Figure 1.18.) Since slope = Δy/Δx, the slope represents the rate of change of y with respect to x. The units of the slope are y-units over x-units.
Linear Functions in General
A linear function has the form
![]()
Its graph is a line such that
- m is the slope, or rate of change of y with respect to x.
- b is the vertical intercept or value of y when x is zero.
If the slope, m, is positive, then f is an increasing function. If m is negative, then f is decreasing.
Notice that if the slope, m, is zero, we have y = b, a horizontal line. For a line of slope m through the point (x0, y0), we have
![]()
Therefore we can write the equation of the line in the point-slope form:
The equation of a line of slope m through the point (x0, y0) is
![]()
| Example 2 | The solid waste generated each year in the cities of the US is increasing. The solid waste generated,12 in millions of tons, was 238.3 in 2000 and 251.3 in 2006.
(a) Assuming that the amount of solid waste generated by US cities is a linear function of time, find a formula for this function by finding the equation of the line through these two points. (b) Use this formula to predict the amount of solid waste generated in the year 2020. |
| Solution | (a) We think of the amount of solid waste, W, as a function of year, t, and the two points are (2000, 238.3) and (2006, 251.3). The slope of the line is
We use the point-slope form to find the equation of the line. We substitute the point (2000, 238.3) and the slope m = 2.167 into the equation:
The equation of the line is W = 2.167t−4095.7. Alternatively, we could use the slope-intercept form of a line to find the vertical intercept. (b) To calculate solid waste predicted for the year 2020, we substitute t = 2020 into the equation of the line, W = −4095.7 + 2.167t, and calculate W:
The formula predicts that in the year 2020, there will be 281.64 million tons of solid waste. |

Recognizing Data from a Linear Function: Values of x and y in a table could come from a linear function y = b + mx if differences in y-values are constant for equal differences in x.
| Example 3 | Which of the following tables of values could represent a linear function?
|
| Solution | Since f(x) increases by 5 for every increase of 1 in x, the values of f(x) could be from a linear function with slope = 5/1 = 5.
Between x = 0 and x = 2, the value of g(x) increases by 6 as x increases by 2. Between x = 2 and x = 4, the value of y increases by 10 as x increases by 2. Since the slope is not constant, g(x) could not be a linear function. Since h(t) decreases by 0.2 for every increase of 10 in t, the values of h(t) could be from a linear function with slope = −0.2/10 = −0.02. |
| Example 4 | The data in the following table lie on a line. Find formulas for each of the following functions, and give units for the slope in each case:
(a) q as a function of p (b) p as a function of q
|
| Solution | (a) If we think of q as a linear function of p, then q is the dependent variable and p is the independent variable. We can use any two points to find the slope. The first two points give
The units are the units of q over the units of p, or tons per dollar. To write q as a linear function of p, we use the equation q = b+mp. We know that m = −2, and we can use any of the points in the table to find b. Substituting p = 10, q = 90 gives Thus, the equation of the line is
(b) If we now consider p as a linear function of q, then p is the dependent variable and q is the independent variable. We have
The units of the slope are dollars per ton. Since p is a linear function of q, we have p = b + mq and m = −0.5. To find b, we substitute any point from the table, such as p = 10, q = 90, into this equation:
Thus, the equation of the line is
Alternatively, we could take our answer to part (a), that is q = 110 − 2p, and solve for p. |


Appendix A shows how to fit a linear function to data that is not exactly linear.
Families of Linear Functions
Formulas such as f(x) = b + mx, in which the constants m and b can take on various values, represent a family of functions. All the functions in a family share certain properties—in this case, the graphs are lines. The constants m and b are called parameters. Figures 1.19 and 1.20 show graphs with several values of m and b. Notice the greater the magnitude of m, the steeper the line.
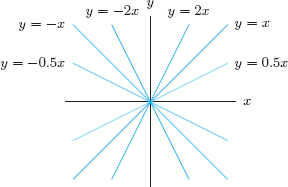
Figure 1.19: The family y = mx (with b = 0)

Figure 1.20: The family y = b+ x (with m = 1)
Problems for Section 1.2
For Problems 1–4, find an equation for the line that passes through the given points.
1. (0, 2) and (2, 3)
2. (0, 0) and (1, 1)
3. (−2, 1) and (2, 3)
4. (4, 5) and (2, −1)
For Problems 5–8, determine the slope and the y-intercept of the line whose equation is given.
5. 7y + 12x − 2 = 0
6. 3x + 2y = 8
7. 12x = 6y + 4
8. −4y + 2x + 8 = 0
9. Figure 1.21 shows four lines given by equation y = b + mx. Match the lines to the conditions on the parameters m and b.
(a) m > 0, b > 0
(b) m < 0, b > 0
(c) m > 0, b < 0
(d) m < 0, b < 0

10. (a) Which two lines in Figure 1.22 have the same slope? Of these two lines, which has the larger y-intercept?
(b) Which two lines have the same y-intercept? Of these two lines, which has the larger slope?

11. A city's population was 30,700 in the year 2010 and is growing by 850 people a year.
(a) Give a formula for the city's population, P, as a function of the number of years, t, since 2010.
(b) What is the population predicted to be in 2020?
(c) When is the population expected to reach 45,000?
12. A company rents cars at $40 a day and 15 cents a mile. Its competitor's cars are $50 a day and 10 cents a mile.
(a) For each company, give a formula for the cost of renting a car for a day as a function of the distance traveled.
(b) On the same axes, graph both functions.
(c) How should you decide which company is cheaper?
13. Figure 1.23 shows the distance from home, in miles, of a person on a 5-hour trip.
(a) Estimate the vertical intercept. Give units and interpret it in terms of distance from home.
(b) Estimate the slope of this linear function. Give units, and interpret it in terms of distance from home.
(c) Give a formula for distance, D, from home as a function of time, t in hours.

14. Which of the following tables could represent linear functions?
(a)
![]()
(b)
![]()
(c)
![]()
15. For each table in Problem 14 that could represent a linear function, find a formula for that function.
16. A cell phone company charges a monthly fee of $25 plus $0.05 per minute. Find a formula for the monthly charge, C, in dollars, as a function of the number of minutes, m, the phone is used during the month.
17. Annual revenue R from McDonald's restaurants worldwide can be estimated by R = 19.1 + 1.8t, where R is in billion dollars and t is in years since January 1, 2005.13
(a) What is the slope of this function? Include units. Interpret the slope in terms of McDonald's revenue.
(b) What is the vertical intercept of this function? Include units. Interpret the vertical intercept in terms of McDonald's revenue.
(c) What annual revenue does the function predict for 2015?
(d) When is annual revenue predicted to hit 35 billion dollars?
18. A company's pricing schedule in Table 1.5 is designed to encourage large orders. (A gross is 12 dozen.) Find a formula for:
(a) q as a linear function of p.
(b) p as a linear function of q.
19. World milk production rose at an approximately constant rate between 2000 and 2012.14 See Figure 1.24.
(a) Estimate the vertical intercept and interpret it in terms of milk production.
(b) Estimate the slope and interpret it in terms of milk production.
(c) Give an approximate formula for milk production, M, as a function of t.

20. The percentage of people, P, below the poverty level in the US15 is given in Table 1.6.
(a) Find a formula for the percentage in poverty as a linear function of time in years since 2000.
(b) Use the formula to predict the percentage in poverty in 2006.
(c) What is the difference between the prediction and the actual percentage, 12.3%?
21. World grain production was 1241 million tons in 1975 and 2048 million tons in 2005, and has been increasing at an approximately constant rate.16
(a) Find a linear function for world grain production, P, in million tons, as a function of t, the number of years since 1975.
(b) Using units, interpret the slope in terms of grain production.
(c) Using units, interpret the vertical intercept in terms of grain production.
(d) According to the linear model, what is the predicted world grain production in 2015?
(e) According to the linear model, when is grain production predicted to reach 2500 million tons?
22. Annual sales of music compact discs (CDs) have declined since 2000. Sales were 942.5 million in 2000 and 384.7 million in 2008.17
(a) Find a formula for annual sales, S, in millions of music CDs, as a linear function of the number of years, t, since 2000.
(b) Give units for and interpret the slope and the vertical intercept of this function.
(c) Use the formula to predict music CD sales in 2012.
23. Search and rescue teams work to find lost hikers. Members of the search team separate and walk parallel to one another through the area to be searched. Table 1.7 shows the percent, P, of lost individuals found for various separation distances, d, of the searchers.18
(a) Explain how you know that the percent found, P, could be a linear function of separation distance, d.
(b) Find P as a linear function of d.
(c) What is the slope of the function? Give units and interpret the answer.
(d) What are the vertical and horizontal intercepts of the function? Give units and interpret the answers.
24. In a California town, the monthly charge for waste collection is $8 for 32 gallons of waste and $12.32 for 68 gallons of waste.
(a) Find a linear formula for the cost, C, of waste collection as a function of the number of gallons of waste, w.
(b) What is the slope of the line found in part (a)? Give units and interpret your answer in terms of the cost of waste collection.
(c) What is the vertical intercept of the line found in part (a)? Give units and interpret your answer in terms of the cost of waste collection.
25. The number of species of coastal dune plants in Australia decreases as the latitude, in °S, increases. There are 34 species at 11°S and 26 species at 44°S.19
(a) Find a formula for the number, N, of species of coastal dune plants in Australia as a linear function of the latitude, l, in °S.
(b) Give units for and interpret the slope and the vertical intercept of this function.
(c) Graph this function between l = 11°S and l = 44°S. (Australia lies entirely within these latitudes.)
26. Table 1.8 gives the average weight, w, in pounds, of American men in their sixties for height, h, in inches.20
(a) How do you know that the data in this table could represent a linear function?
(b) Find weight, w, as a linear function of height, h. What is the slope of the line? What are the units for the slope?
(c) Find height, h, as a linear function of weight, w. What is the slope of the line? What are the units for the slope?
Problems 27–32 concern the maximum heart rate (MHR), which is the maximum number of times a person's heart can safely beat in one minute. If MHR is in beats per minute and a is age in years, the formulas used to estimate MHR, are
![]()
27. Which of the following is the correct statement?
(a) As you age, your maximum heart rate decreases by one beat per year.
(b) As you age, your maximum heart rate decreases by one beat per minute.
(c) As you age, your maximum heart rate decreases by one beat per minute per year.
28. Which of the following is the correct statement for a male and female of the same age?
(a) Their maximum heart rates are the same.
(b) The male's maximum heart rate exceeds the female's.
(c) The female's maximum heart rate exceeds the male's.
29. What can be said about the ages of a male and a female with the same maximum heart rate?
30. Recently21 it has been suggested that a more accurate predictor of MHR for both males and females is given by
![]()
(a) At what age do the old and new formulas give the same MHR for females? For males?
(b) Which of the following is true?
(i) The new formula predicts a higher MHR for young people and a lower MHR for older people than the old formula.
(ii) The new formula predicts a lower MHR for young people and a higher MHR for older people than the old formula.
(c) When testing for heart disease, doctors ask patients to walk on a treadmill while the speed and incline are gradually increased until their heart rates reach 85 percent of the MHR. For a 65-year-old male, what is the difference in beats per minute between the heart rate reached if the old formula is used and the heart rate reached if the new formula is used?
31. Experiments22 suggest that the female MHR decreases by 12 beats per minute by age 21, and by 19 beats per minute by age 33. Is this consistent with MHR being approximately linear with age?
32. Experiments23 suggest that the male MHR decreases by 9 beats per minute by age 21, and by 26 beats per minute by age 33. Is this consistent with MHR being approximately linear with age?
33. Let y be the percent increase in annual US national production during a year when the unemployment rate changes by u percent. (For example, u = 2 if unemployment increases from 4% to 6%.) Okun's law states that
![]()
(a) What is the meaning of the number 3.5 in Okun's law?
(b) What is the effect on national production of a year when unemployment rises from 5% to 8%?
(c) What change in the unemployment rate corresponds to a year when production is the same as the year before?
(d) What is the meaning of the coefficient −2 in Okun's law?
34. An Australian24 study found that, if other factors are constant (education, experience, etc.), taller people receive higher wages for the same work. The study reported a “height premium” for men of 3% of the hourly wage for a 10 cm increase in height; for women the height premium reported was 2%. We assume that hourly wages are a linear function of height, with slope given by the height premium at the average hourly wage for that gender.
(a) The average hourly wage25 for a 178 cm Australian man is AU$29.40. Express the average hourly wage of an Australian man as a function of his height, x cm.
(b) The average hourly wage for a 164 cm Australian woman is AU$24.78. Express the average hourly wage of an Australian woman as a function of her height, y cm.
(c) What is the difference in average hourly wages between men and women of height 178 cm?
(d) Is there a height for which men and women are predicted to have the same wage? If so, what is it?
1.3 AVERAGE RATE OF CHANGE AND RELATIVE CHANGE
Average Rate of Change
In the previous section, we saw that the height of the winning Olympic pole vault increased at an approximately constant rate of 2 inches/year between 1900 and 1912. Similarly, the world record for the mile decreased at an approximately constant rate of 0.4 seconds/year. We now see how to calculate rates of change when they are not constant.
| Example 1 | Table 1.9 shows the height of the winning pole vault at the Olympics26 during the 1960s and 1990s. Find the rate of change of the winning height between 1960 and 1968, and between 1992 and 2000. In which of these two periods did the height increase faster than during the period 1900–1912? |
| Solution | From 1900 to 1912, the height increased by 2 inches/year. To compare the 1960s and 1990s, we calculate
Thus, on average, the height was increasing more quickly during the 1960s than from 1900 to 1912. During the 1990s, the height was increasing more slowly than from 1900 to 1912. |
In Example 1, the function does not have a constant rate of change (it is not linear). However, we can compute an average rate of change over any interval. The word average is used because the rate of change may vary within the interval. We have the following general formula.
If y is a function of t, so y = f(t), then
![]()
The units of average rate of change of a function are units of y per unit of t.
The average rate of change of a linear function is the slope, and a function is linear if the average rate of change is the same on all intervals.
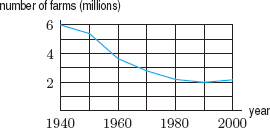
| Example 2 | Using Figure 1.25, estimate the average rate of change of the number of farms27 in the US between 1950 and 1970.
|
| Solution | Figure 1.25 shows that the number, N, of farms in the US was approximately 5.4 million in 1950 and approximately 2.8 million in 1970. If time, t, is in years, we have
The average rate of change is negative because the number of farms is decreasing. During this period, the number of farms decreased at an average rate of 0.13 million, or 130,000, per year. |
We have looked at how an Olympic record and the number of farms change over time. In the next example, we look at average rate of change with respect to a quantity other than time.
| Example 3 | Polychlorinated biphenyl (PCB) is an industrial pollutant thought dangerous to wildlife. Table 1.10 shows data on PCB levels and the thickness of pelican egg shells.28 (Thin shells break more easily.)
Find the average rate of change in the thickness of the shell as the PCB concentration changes from 87 ppm to 452 ppm. Give units and explain what the sign of the answer tells us. |
| Solution | Since we are looking for the average rate of change of thickness with respect to change in PCB concentration, we have
The units are thickness units (mm) over PCB concentration units (ppm), or millimeters over parts per million. The fact that the average rate of change is negative tells us that, for this data, the thickness of the eggshell decreases as the PCB concentration increases. The thickness of pelican eggs decreases by an average of 0.00082 mm for every additional part per million of PCB in the eggshell. |

Visualizing Rate of Change
For a function y = f(x), the change in the value of the function between x = a and x = c is Δy = f(c) − f(a). Since Δy is a difference of two y-values, it is represented by the vertical distance in Figure 1.26. The average rate of change of f between x = a and x = c is represented by the slope of the line joining the points A and C in Figure 1.27. This line is called the secant line between x = a and x = c.

Figure 1.26: The change in a function is represented by a vertical distance

Figure 1.27: The average rate of change is represented by the slope of the line
| Example 4 | (a) Find the average rate of change of y = f(x) = (b) Graph f(x) and represent this average rate of change as the slope of a line. (c) Which is larger, the average rate of change of the function between x = 1 and x = 4 or the average rate of change between x = 4 and x = 5? What does this tell us about the graph of the function? |
| Solution | (a) Since f(1) =
(b) A graph of f(x) = (c) Since the secant line between x = 1 and x = 4 is steeper than the secant line between x = 4 and x = 5, the average rate of change between x = 1 and x = 4 is larger than it is between x = 4 and x = 5. The rate of change is decreasing. This tells us that the graph of this function is bending downward.
|

Concavity
We now look at the graphs of functions whose rates of change are increasing throughout an interval or decreasing throughout an interval.
Figure 1.28 shows a graph that is bending downward because the rate of change is decreasing. The graph in Figure 1.26 bends upward because the rate of change of the function is increasing. We make the following definitions.
The graph of a function is concave up if it bends upward as we move left to right; the graph is concave down if it bends downward. (See Figure 1.29.) A line is neither concave up nor concave down.

Figure 1.29: Concavity of the graph
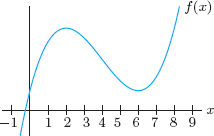
| Example 5 | Using Figure 1.30, estimate the intervals over which:
(a) The function is increasing; decreasing. (b) The graph is concave up; concave down.
|
| Solution | (a) The graph suggests that the function is increasing for x < 2 and for x > 6. It appears to be decreasing for 2 < x < 6.
(b) The graph is concave down on the left and concave up on the right. It is difficult to tell exactly where the graph changes concavity, although it appears to be about x = 4. Approximately, the graph is concave down for x < 4 and concave up for x > 4. |
| Example 6 | From the following values of f(t), does f appear to be increasing or decreasing? Do you think its graph is concave up or concave down?
|
| Solution | Since the given values of f(t) increase as t increases, f appears to be increasing. As we read from left to right, the change in f(t) starts small and gets larger (for constant change in t), so the graph is climbing faster. Thus, the graph appears to be concave up. Alternatively, plot the points and notice that a curve through these points bends up. |
Distance, Velocity, and Speed
A grapefruit is thrown up in the air. The height of the grapefruit above the ground first increases and then decreases. See Table 1.11.
| Example 7 | Find the change and average rate of change of the height of the grapefruit during the first 3 seconds. Give units and interpret your answers. |
| Solution | The change in height during the first 3 seconds is Δy = 162 − 6 = 156 ft. This means that the grapefruit goes up a total of 156 feet during the first 3 seconds. The average rate of change during this 3 second interval is 156/3 = 52 ft/sec. During the first 3 seconds, the grapefruit is rising at an average rate of 52 ft/sec. |
The average rate of change of height with respect to time is velocity. You may recognize the units (feet per second) as units of velocity.

There is a distinction between velocity and speed. Suppose an object moves along a line. If we pick one direction to be positive, the velocity is positive if the object is moving in that direction and negative if it is moving in the opposite direction. For the grapefruit, upward is positive and downward is negative. Speed is the magnitude of velocity, so it is always positive or zero.
| Example 8 | Find the average velocity of the grapefruit over the interval t = 4 to t = 6. Explain the sign of your answer. |
| Solution | Since the height is y = 150 feet at t = 4 and y = 30 feet at t = 6, we have
The negative sign means the height is decreasing and the grapefruit is moving downward. |
| Example 9 | A car travels away from home on a straight road. Its distance from home at time t is shown in Figure 1.31. Is the car's average velocity greater during the first hour or during the second hour?
Figure 1.31: Distance of car from home
|
| Solution | Average velocity is represented by the slope of a secant line. Figure 1.32 shows that the secant line between t = 0 and t = 1 is steeper than the secant line between t = 1 and t = 2. Thus, the average velocity is greater during the first hour. |


Relative Change
Is a population increase of 1000 a significant change? It depends on the original size of the community. If the town of Coyote, NM, population 1559, increases by 1000 people, the townspeople would definitely notice. On the other hand, if New York City, population 8.25 million, increases by 1000 people, almost no one will notice. To visualize the impact of the increase on the two different communities, we look at the change, 1000, as a fraction, or percentage, of the initial population. This percent change is called the relative change.
| Example 10 | If the population increases by 1000 people, find the relative change in the population for
(a) Coyote, NM (population 1559) (b) New York City (population 8,250,000) |
| Solution | (a) The population increases by 1000 from 1559 so
The population has increased by 64.1%, a significant increase. (b) The population increases by 1000 from 8,250,000 so
The population has increased by 0.012%, or less than one-tenth of one percent. |
In general, when a quantity P changes from P0 to P1, we define
![]()
The relative change is a number, without units. It is often expressed as a percentage.
| Example 11 | A price increase can be significant or inconsequential depending on the item. In each of the following cases, find the relative change in price of a $2 price increase; give your answer as a percent.
(a) A gallon of gas costing $2.25 (b) A cell phone costing $180 |
| Solution | (a) The change in the price is $2 so we have
The price of gas has gone up 88.9%. (b) We have
The price of the cell phone has gone up only 1.1%. |
Relative change can be positive or negative, as we see in the following example.
| Example 13 | The number of sales per week of a $75.99 pair of jeans is 25 pairs. The number of weekly sales goes up to 45 pairs when the price is reduced by 30.3%. Find the relative change in the weekly sales. |
| Solution | The quantity sold goes up from 25 pairs of jeans to 45 pairs. We have
The number of sales per week grows by 80%. |
Ratio of Relative Changes: Elasticity
In Example 12 and 13 we see that a 30.3% reduction in the price of a $75.99 pair of jeans increased the weekly sales by 80%. If we are interested in the percent change in quantity as a result of a 1% change in price we look at the ratio:
![]()
So the number of pair of jeans sold increases by 2.64% when the price drops by 1%. This ratio is called the elasticity. It gives information about how change in price of a product effects the change in quantity. Elasticity will be discussed in further detail in Section 4.6.
Problems for Section 1.3
In Problems 1–4, decide whether the graph is concave up, concave down, or neither.
1.

2.

3.

4.

5. Table 1.12 gives values of a function w = f(t). Is this function increasing or decreasing? Is the graph of this function concave up or concave down?
6. Graph a function f(x) which is increasing everywhere and concave up for negative x and concave down for positive x.
7. For which pairs of consecutive points in Figure 1.33 is the function graphed:
(a) Increasing and concave up?
(b) Increasing and concave down?
(c) Decreasing and concave up?
(d) Decreasing and concave down?

8. Find the average rate of change of f(x) = 2x2 between x = 1 and x = 3.
9. Find the average rate of change of f(x) = 3x2 + 4 between x = −2 and x = 1. Illustrate your answer graphically.
10. When a deposit of $1000 is made into an account paying 8% interest, compounded annually, the balance, $B, in the account after t years is given by B = 1000(1.08)t. Find the average rate of change in the balance over the interval t = 0 to t = 5. Give units and interpret your answer in terms of the balance in the account.
11. Table 1.13 gives the net sales of The Gap, Inc, which operates nearly 3000 clothing stores.29
(a) Find the change in net sales between 2008 and 2010.
(b) Find the average rate of change in net sales between 2005 and 2008. Give units and interpret your answer.
(c) From 2005 to 2010, were there any one-year intervals during which the average rate of change was positive? If so, when?
12. Table 1.14 shows world bicycle production.30
(a) Find the change in bicycle production between 1950 and 2000. Give units.
(b) Find the average rate of change in bicycle production between 1950 and 2000. Give units and interpret your answer in terms of bicycle production.
13. Table 1.15 shows attendance at NFL football games.31
(a) Find the average rate of change in the attendance from 2003 to 2007. Give units.
(b) Find the annual increase in the attendance for each year from 2003 to 2007. (Your answer should be four numbers.)
(c) Show that the average rate of change found in part (a) is the average of the four yearly changes found in part (b).
14. Figure 1.34 shows the total value of US imports, in billions of dollars.32
(a) Was the value of the imports higher in 1985 or in 2003? Approximately how much higher?
(b) Estimate the average rate of change of US imports between 1985 and 2003. Give units and interpret your answer in terms of imports.

15. Figure 1.35 shows a particle's distance from a point. What is the particle's average velocity from t = 0 to t = 3?

16. At time t in seconds, a particle's distance s(t), in cm, from a point is given in the table. What is the average velocity of the particle from t = 3 to t = 10?
![]()
17. Table 1.16 shows world population, P, in billions of people, world passenger automobile production, A, in millions of cars, and world cell phone subscribers, C, in millions of subscribers.33
(a) Find the average rate of change, with units, for each of P, A, and C between 1995 and 2005.
(b) Between 1995 and 2005, which increased faster:
(i) Population or the number of automobiles?
(ii) Population or the number of cell phone subscribers?

18. Table 1.17 gives sales of Pepsico, which operates two major businesses: beverages (including Pepsi) and snack foods.34
(a) Find the change in sales between 2003 and 2010.
(b) Find the average rate of change in sales between 2003 and 2010. Give units and interpret your answer.
19. Figure 1.36 shows a particle's distance from a point. What is the particle's average velocity from t = 1 to t = 3?

20. Do you expect the average rate of change (in units per year) of each of the following to be positive or negative? Explain your reasoning.
(a) Number of acres of rain forest in the world.
(b) Population of the world.
(c) Number of polio cases each year in the US, since 1950.
(d) Height of a sand dune that is being eroded.
(e) Cost of living in the US.
21. Table 1.18 shows the production of tobacco in the US.35
(a) What is the average rate of change in tobacco production between 2003 and 2010? Give units and interpret your answer in terms of tobacco production.
(b) During this seven-year period, is there any interval during which the average rate of change was positive? If so, when?
22. Figure 1.37 shows the length, L, in cm, of a sturgeon (a type of fish) as a function of the time, t, in years.36
(a) Is the function increasing or decreasing? Is the graph concave up or concave down?
(b) Estimate the average rate of growth of the sturgeon between t = 5 and t = 15. Give units and interpret your answer in terms of the sturgeon.

23. Table 1.19 shows the total US labor force, L. Find the average rate of change between 1940 and 2000; between 1940 and 1960; between 1980 and 2000. Give units and interpret your answers in terms of the labor force.37
24. The total world marine catch38 of fish, in metric tons, was 17 million in 1950 and 99 million in 2001. What was the average rate of change in the marine catch during this period? Give units and interpret your answer.
25. Table 1.20 gives the revenues, R, of General Motors, formerly the world's largest auto manufacturer.39
(a) Find the change in revenues between 2003 and 2008.
(b) Find the average rate of change in revenues between 2003 and 2008. Give units and interpret your answer.
(c) From 2003 to 2008, were there any one-year intervals during which the average rate of change was negative? If so, which?
26. The number of US households with cable television40 was 12,168,450 in 1977 and 73,365,880 in 2003. Estimate the average rate of change in the number of US households with cable television during this 26-year period. Give units and interpret your answer.
27. Figure 1.38 shows the amount of nicotine N = f(t), in mg, in a person's bloodstream as a function of the time, t, in hours, since the last cigarette.
(a) Is the average rate of change in nicotine level positive or negative? Explain.
(b) Find the average rate of change in the nicotine level between t = 0 and t = 3. Give units and interpret your answer in terms of nicotine.

28. Table 1.21 shows the concentration, c, of creatinine in the bloodstream of a dog.41
(a) Including units, find the average rate at which the concentration is changing between the
(i) 6th and 8th minutes.
(ii) 8th and 10th minutes.
(b) Explain the sign and relative magnitudes of your results in terms of creatinine.
29. The population of the world reached 1 billion in 1804, 2 billion in 1927, 3 billion in 1960, 4 billion in 1974, 5 billion in 1987 and 6 billion in 1999. Find the average rate of change of the population of the world, in people per minute, during each of these intervals (that is, from 1804 to 1927, 1927 to 1960, etc.).
Problems 30–31 refer to Figure 1.39, which shows the contraction velocity of a muscle as a function of the load it pulls against.

30. In terms of the muscle, interpret the
(a) Vertical intercept
(b) Horizontal intercept
31. (a) Find the change in muscle contraction velocity when the load changes from 1 kg to 3 kg. Give units.
(b) Find the average rate of change in the contraction velocity between 1 kg and 3 kg. Give units.
32. Table 1.22 gives the sales, S, of Intel Corporation, a leading manufacturer of integrated circuits.42
(a) Find the change in sales between 2005 and 2010.
(b) Find the average rate of change in sales between 2005 and 2010. Give units and interpret your answer.
33. Let f(t) be the number of US billionaires in year t.
(a) Express the following statements43 in terms of f.
(i) In 1985 there were 13 US billionaires.
(ii) In 1990 there were 99 US billionaires.
(b) Find the average yearly increase in the number of US billionaires between 1985 and 1990. Express this using f.
(c) Assuming the yearly increase remains constant, find a formula predicting the number of US billionaires in year t.
34. Figure 1.40 shows the position of an object at time t.
(a) Draw a line on the graph whose slope represents the average velocity between t = 2 and t = 8.
(b) Is average velocity greater between t = 0 and t = 3 or between t = 3 and t = 6?
(c) Is average velocity positive or negative between t = 6 and t = 9?

35. In an experiment, a lizard is encouraged to run as fast as possible. Figure 1.41 shows the distance run in meters as a function of the time in seconds.44
(a) If the lizard were running faster and faster, what would be the concavity of the graph? Does this match what you see?
(b) Estimate the average velocity of the lizard during this 0.8 second experiment.

36. Values of F(t), G(t), and H(t) are in Table 1.23. Which graph is concave up and which is concave down? Which function is linear?

37. Experiments suggest that the male maximum heart rate (the most times a male's heart can safely beat in a minute) decreases by 9 beats per minute during the first 21 years of his life, and by 26 beats per minute during the first 33 years.45 If you model the maximum heart rate as a function of age, should you use a function that is increasing or decreasing? Concave up or concave down?
38. A car starts slowly and then speeds up. Eventually the car slows down and stops. Graph the distance that the car has traveled against time.
In Problems 39–42, find the relative, or percent, change.
39. B changes from 12,000 to 15,000
40. S changes from 400 to 450
41. W changes from 0.3 to 0.05
42. R changes from 50 to 47
In Problems 43–46, which relative change is bigger in magnitude? Justify your answer.
43. The change in the Dow Jones average from 164.6 to 77.9 in 1931; the change in the Dow Jones average from 13261.8 to 8776.4 in 2008.
44. The change in the US population from 5.2 million to 7.2 million from 1800 to 1810; the change in the US population from 151.3 to 179.3 from 1950 to 1960.
45. An increase in class size from 5 to 10; an increase in class size from 30 to 50.
46. An increase in sales from $100,000 to $500,000; an increase in sales from $20,000,000 to $20,500,000.
47. Find the relative change of a population if it changes
(a) From 1000 to 2000
(b) From 2000 to 1000
(c) From 1,000,000 to 1,001,000
48. On Black Monday, October 28, 1929, the stock market on Wall Street crashed. The Dow Jones average dropped from 298.94 to 260.64 in one day. What was the relative change in the index?
49. On January 27, 2013, the cost to mail a letter in the US46 was raised from 45 cents to 46 cents. Find the relative change in the cost.
50. The US Consumer Price Index (CPI) is a measure of the cost of living. The inflation rate is the annual relative rate of change of the CPI. Use the January data in Table 1.2447 to estimate the inflation rate for each of years 2007–2012.
51. During 2008 the US economy stopped growing and began to shrink. Table 1.2548 gives quarterly data on the US Gross Domestic Product (GDP), which measures the size of the economy.
(a) Estimate the relative growth rate (percent per year) at the first four times in the table.
(b) Economists often say an economy is in recession if the GDP decreases for two quarters in a row. Was the US in recession in 2008?
52. An alternative to petroleum-based diesel fuel, biodiesel, is derived from renewable resources such as food crops, algae, and animal oils. The table shows the recent annual percent growth in US biodiesel consumption.49
![]()
(a) Find the largest time interval over which the percentage growth in the US consumption of biodiesel was an increasing function of time. Interpret what increasing means, practically speaking, in this case.
(b) Find the largest time interval over which the actual US consumption of biodiesel was an increasing function of time. Interpret what increasing means, practically speaking, in this case.
53. Hydroelectric power is electric power generated by the force of moving water. Figure 1.42 shows50 the annual percent growth in hydroelectric power consumption by the US industrial sector between 2004 and 2009.
(a) Find the largest time interval over which the percentage growth in the US consumption of hydroelectric power was a decreasing function of time. Interpret what decreasing means, practically speaking, in this case.
(b) Find the largest time interval over which the actual US consumption of hydroelectric power was a decreasing function of time. Interpret what decreasing means, practically speaking, in this case.

54. Solar panels are arrays of photovoltaic cells that convert solar radiation into electricity. The table shows the annual percent change in the US price per watt of a solar panel.51
![]()
(a) Find the largest time interval over which the percentage growth in the US price per watt of a solar panel was an increasing function of time. Interpret what increasing means, practically speaking, in this case.
(b) Find the largest time interval over which the actual price per watt of a solar panel was an increasing function of time. Interpret what increasing means, practically speaking, in this case.
55. School organizations raise money by selling candy door to door. When the price is $1 a school organization sells 2765 candies and when the price goes up to $1.25 the quantity of sold candy drops down to 2440.
(a) Find the relative change in the price of candy.
(b) Find the relative change in the quantity of candy sold.
(c) Find and interpret the ratio
![]()
and interpret your answer.
1.4 APPLICATIONS OF FUNCTIONS TO ECONOMICS
In this section, we look at some of the functions of interest to decision-makers in a firm or industry.
The Cost Function
The cost function, C(q), gives the total cost of producing a quantity q of some good.
What sort of function do you expect C to be? The more goods that are made, the higher the total cost, so C is an increasing function. Costs of production can be separated into two parts: the fixed costs, which are incurred even if nothing is produced, and the variable costs, which depend on how many units are produced.
An Example: Manufacturing Costs
Let's consider a company that makes radios. The factory and machinery needed to begin production are fixed costs, which are incurred even if no radios are made. The costs of labor and raw materials are variable costs since these quantities depend on how many radios are made. The fixed costs for this company are $24,000 and the variable costs are $7 per radio. Then,
![]()
so, if q is the number of radios produced,
![]()
This is the equation of a line with slope 7 and vertical intercept 24,000.
The variable cost for one additional unit is called the marginal cost. For a linear cost function, the marginal cost is the rate of change, or slope, of the cost function.
| Example 1 | Graph the cost function C(q) = 24,000 + 7q. Label the fixed costs and marginal cost. |
| Solution | The graph of C(q) is the line in Figure 1.43. The fixed costs are represented by the vertical intercept of 24,000. The marginal cost is represented by the slope of 7, which is the change in cost corresponding to a unit change in production.
|

If C(q) is a linear cost function,
- Fixed costs are represented by the vertical intercept.
- Marginal cost is represented by the slope.
| Example 2 | In each case, draw a graph of a linear cost function satisfying the given conditions:
(a) Fixed costs are large but marginal cost is small. (b) There are no fixed costs but marginal cost is high. |
| Solution | (a) The graph is a line with a large vertical intercept and a small slope. See Figure 1.44.
(b) The graph is a line with a vertical intercept of zero (so the line goes through the origin) and a large positive slope. See Figure 1.45. Figures 1.44 and 1.45 have the same scales.
Figure 1.44: Large fixed costs, small marginal cost
|


The Revenue Function
The revenue function, R(q), gives the total revenue received by a firm from selling a quantity, q, of some good.
If the good sells for a price of p per unit, and the quantity sold is q, then
![]()
If the price does not depend on the quantity sold, so p is a constant, the graph of revenue as a function of q is a line through the origin, with slope equal to the price p.
| Example 3 | If radios sell for $15 each, sketch the manufacturer's revenue function. Show the price of a radio on the graph. |
| Solution | Since R(q) = pq = 15q, the revenue graph is a line through the origin with a slope of 15. See Figure 1.46. The price is the slope of the line.
|

| Example 4 | Graph the cost function C(q) = 24,000 + 7q and the revenue function R(q) = 15q on the same axes. For what values of q does the company make money? |
| Solution | The company makes money whenever revenues are greater than costs, so we find the values of q for which the graph of R(q) lies above the graph of C(q). See Figure 1.47.
We find the point at which the graphs of R(q) and C(q) cross:
The company makes a profit if it produces and sells more than 3000 radios. The company loses money if it produces and sells fewer than 3000 radios.
Figure 1.47: Cost and revenue functions for the radio manufacturer: What values of q generate a profit? |


The Profit Function
Decisions are often made by considering the profit, usually written52 as π to distinguish it from the price, p. We have
Profit = Revenue − Cost so π = R − C.
The break-even point for a company is the point where the profit is zero and revenue equals cost. See Figure 1.47.
| Example 5 | Find a formula for the profit function of the radio manufacturer. Graph it, marking the break-even point. |
| Solution | Since R(q) = 15q and C(q) = 24,000 + 7q, we have
Notice that the negative of the fixed costs is the vertical intercept and the break-even point is the horizontal intercept. See Figure 1.48.
|

| Example 6 | (a) Using Table 1.26, estimate the break-even point for this company.
(b) Find the company's profit if 1000 units are produced. (c) What price do you think the company is charging for its product? |
| Solution | (a) The break-even point is the value of q for which revenue equals cost. Since revenue is below cost at q = 800 and revenue is greater than cost at q = 900, the break-even point is between 800 and 900. The values in the table suggest that the break-even point is closer to 800, as the cost and revenue are closer there. A reasonable estimate for the break-even point is q = 830.
(b) If the company produces 1000 units, the cost is $7500 and the revenue is $8000, so the profit is 8000 − 7500 = 500 dollars. (c) From the table, it appears that R(q) = 8q. This indicates the company is selling the product for $8 each. |

The Marginal Cost, Marginal Revenue, and Marginal Profit
Just as we used the term marginal cost to mean the rate of change, or slope, of a linear cost function, we use the terms marginal revenue and marginal profit to mean the rate of change, or slope, of linear revenue and profit functions, respectively. The term marginal is used because we are looking at how the cost, revenue, or profit change “at the margin,” that is, by the addition of one more unit. For example, for the radio manufacturer, the marginal cost is 7 dollars/item (the additional cost of producing one more item is $7), the marginal revenue is 15 dollars/item (the additional revenue from selling one more item is $15), and the marginal profit is 8 dollars/item (the additional profit from selling one more item is $8).
The Depreciation Function
Suppose that the radio manufacturer has a machine that costs $20,000 and is sold ten years later for $3000. We say the value of the machine depreciates from $20,000 today to a resale value of $3000 in ten years. The depreciation formula gives the value, V(t), in dollars, of the machine as a function of the number of years, t, since the machine was purchased. We assume that the value of the machine depreciates linearly.
The value of the machine when it is new (t = 0) is $20,000, so V(0) = 20,000. The resale value at time t = 10 is $3000, so V(10) = 3000. We have
![]()
This slope tells us that the value of the machine is decreasing at a rate of $1700 per year. Since V(0) = 20,000, the vertical intercept is 20,000, so
![]()
Supply and Demand Curves
The quantity, q, of an item that is manufactured and sold depends on its price, p. As the price increases, manufacturers are usually willing to supply more of the product, whereas the quantity demanded by consumers falls.
The supply curve, for a given item, relates the quantity, q, of the item that manufacturers are willing to make per unit time to the price, p, for which the item can be sold.
The demand curve relates the quantity, q, of an item demanded by consumers per unit time to the price, p, of the item.
Economists often think of the quantities supplied and demanded as functions of price. However, for historical reasons, the economists put price (the independent variable) on the vertical axis and quantity (the dependent variable) on the horizontal axis. (The reason for this state of affairs is that economists originally took price to be the dependent variable and put it on the vertical axis. Later, when the point of view changed, the axes did not.) Thus, typical supply and demand curves look like those shown in Figure 1.49.

Figure 1.49: Supply and demand curves
| Example 7 | What is the economic meaning of the prices p0 and p1 and the quantity q1 in Figure 1.49? |
| Solution | The vertical axis corresponds to a quantity of zero. Since the price p0 is the vertical intercept on the supply curve, p0 is the price at which the quantity supplied is zero. In other words, for prices below p0, the suppliers will not produce anything. The price p1 is the vertical intercept on the demand curve, so it corresponds to the price at which the quantity demanded is zero. In other words, for prices above p1, consumers buy none of the product.
The horizontal axis corresponds to a price of zero, so the quantity q1 on the demand curve is the quantity demanded if the price were zero—the quantity that could be given away free. |
Equilibrium Price and Quantity
If we plot the supply and demand curves on the same axes, as in Figure 1.50, the graphs cross at the equilibrium point. The values p* and q* at this point are called the equilibrium price and equilibrium quantity, respectively. It is assumed that the market naturally settles to this equilibrium point. (See Problem 28.)

Figure 1.50: The equilibrium price and quantity
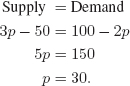
| Example 8 | Find the equilibrium price and quantity if
|
| Solution | To find the equilibrium price and quantity, we find the point at which
The equilibrium price is $30. To find the equilibrium quantity, we use either the demand curve or the supply curve. At a price of $30, the quantity produced is 100 − 2 · 30 = 40 items. The equilibrium quantity is 40 items. In Figure 1.51, the demand and supply curves intersect at p* = 30 and q* = 40.
|

The Effect of Taxes on Equilibrium
What effect do taxes have on the equilibrium price and quantity for a product? We distinguish between two types of taxes.53 A specific tax is a fixed amount per unit of a product sold regardless of the selling price. This is the case with such items as gasoline, alcohol, and cigarettes. A specific tax is usually imposed on the producer. A sales tax is a fixed percentage of the selling price. Many cities and states collect sales tax on a wide variety of items. A sales tax is usually imposed on the consumer. We consider a specific tax now; a sales tax is considered in Problems 43 and 44.
| Example 9 | A specific tax of $5 per unit is now imposed upon suppliers in Example 8. What are the new equilibrium price and quantity? |
| Solution | The consumers pay p dollars per unit, but the suppliers receive only p − 5 dollars per unit because $5 goes to the government as taxes. Since
the new supply equation is
the demand equation is unchanged:
At the equilibrium price, we have
The equilibrium price is $33. The equilibrium quantity is 34 units, since the quantity demanded is q = 100 − 2 · 33 = 34. |

In Example 8, the equilibrium price was $30; with the imposition of a $5 tax in Example 9, the equilibrium price is $33. Thus the equilibrium price increases by $3 as a result of the tax. Notice that this is less than the amount of the tax. The consumer ends up paying $3 more than if the tax did not exist. However the government receives $5 per item. The producer pays the other $2 of the tax, retaining $28 of the price paid per item. Although the tax was imposed on the producer, some of the tax is passed on to the consumer in terms of higher prices. The tax has increased the price and reduced the number of items sold. See Figure 1.52. Notice that the taxes have the effect of moving the supply curve up by $5 because suppliers have to be paid $5 more to produce the same quantity.

Figure 1.52: Specific tax shifts the supply curve, altering the equilibrium price and quantity
A Budget Constraint
An ongoing debate in the federal government concerns the allocation of money between defense and social programs. In general, the more that is spent on defense, the less that is available for social programs, and vice versa. Let's simplify the example to guns and butter. Assuming a constant budget, we show that the relationship between the number of guns and the quantity of butter is linear. Suppose that there is $12,000 to be spent and that it is to be divided between guns, costing $400 each, and butter, costing $2000 a ton. Suppose the number of guns bought is g, and the number of tons of butter is b. Then the amount of money spent on guns is $400g, and the amount spent on butter is $2000b. Assuming all the money is spent,
![]()
or
![]()
Thus, dividing both sides by 400,
![]()
This equation is the budget constraint. Since the budget constraint can be written as
![]()
the graph of the budget constraint is a line. See Figure 1.53.

Figure 1.53: Budget constraint
Problems for Section 1.4
1. In Figure 1.54, which shows the cost and revenue functions for a product, label each of the following:
(a) Fixed costs
(b) Break-even quantity
(c) Quantities at which the company:
(i) Makes a profit
(ii) Loses money

2. Figure 1.55 shows cost and revenue for a company.
(a) Approximately what quantity does this company have to produce to make a profit?
(b) Estimate the profit generated by 600 units.

3. (a) Estimate the fixed costs and the marginal cost for the cost function in Figure 1.56.
(b) Estimate C(10) and interpret it in terms of cost.

4. Values of a linear cost function are in Table 1.27. What are the fixed costs and the marginal cost? Find a formula for the cost function.
5. The cost C, in millions of dollars, of producing q items is given by C = 5.7 + 0.002q. Interpret the 5.7 and the 0.002 in terms of production. Give units.
6. (a) Give an example of a possible company where the fixed costs are zero (or very small).
(b) Give an example of a possible company where the marginal cost is zero (or very small).
7. Suppose that q = f(p) is the demand curve for a product, where p is the selling price in dollars and q is the quantity sold at that price.
(a) What does the statement f(12) = 60 tell you about demand for this product?
(b) Do you expect this function to be increasing or decreasing? Why?
8. A company has cost and revenue functions, in dollars, given by C(q) = 6000 + 10q and R(q) = 12q.
(a) Find the cost and revenue if the company produces 500 units. Does the company make a profit? What about 5000 units?
(b) Find the break-even point and illustrate it graphically.
9. The demand curve for a quantity q of a product is q = 5500 − 100p where p is price in dollars. Interpret the 5500 and the 100 in terms of demand. Give units.
10. A demand curve is given by 75p + 50q = 300, where p is the price of the product, in dollars, and q is the quantity demanded at that price. Find p- and q-intercepts and interpret them in terms of consumer demand.
In Problems 11–14, give the cost, revenue, and profit functions.
11. An online seller of T-shirts pays $500 to start up the website and $6 per T-shirt, then sells the T-shirts for $12 each.
12. A car wash operator pays $35,000 for a franchise, then spends $10 per car wash, which costs the consumer $15.
13. A couple running a house-cleaning business invests $5000 in equipment, and they spend $15 in supplies to clean a house, for which they charge $60.
14. A lemonade stand operator sets up the stand for free in front of the neighbor's house, makes 5 quarts of lemonade for $4, then sells each 8-oz cup for 25 cents.
15. A company that makes Adirondack chairs has fixed costs of $5000 and variable costs of $30 per chair. The company sells the chairs for $50 each.
(a) Find formulas for the cost and revenue functions.
(b) Find the marginal cost and marginal revenue.
(c) Graph the cost and the revenue functions on the same axes.
(d) Find the break-even point.
16. An amusement park charges an admission fee of $21 per person as well as an additional $4.50 for each ride.
(a) For one visitor, find the park's total revenue R(n) as a function of the number of rides, n, taken.
(b) Find R(2) and R(8) and interpret your answers in terms of amusement park fees.
17. A photocopying company has two different price lists. The first price list is $100 plus 3 cents per copy; the second price list is $200 plus 2 cents per copy.
(a) For each price list, find the total cost as a function of the number of copies needed.
(b) Determine which price list is cheaper for 5000 copies.
(c) For what number of copies do both price lists charge the same amount?
18. A company has cost function C(q) = 4000 + 2q dollars and revenue function R(q) = 10q dollars.
(a) What are the fixed costs for the company?
(b) What is the marginal cost?
(c) What price is the company charging for its product?
(d) Graph C(q) and R(q) on the same axes and label the break-even point, q0. Explain how you know the company makes a profit if the quantity produced is greater than q0.
(e) Find the break-even point q0.
19. A movie theater has fixed costs of $5000 per day and variable costs averaging $6 per customer. The theater charges $11 per ticket.
(a) How many customers per day does the theater need in order to make a profit?
(b) Find the cost and revenue functions and graph them on the same axes. Mark the break-even point.
20. A company producing jigsaw puzzles has fixed costs of $6000 and variable costs of $2 per puzzle. The company sells the puzzles for $5 each.
(a) Find formulas for the cost function, the revenue function, and the profit function.
(b) Sketch a graph of R(q) and C(q) on the same axes. What is the break-even point, q0, for the company?
21. Production costs for manufacturing running shoes consist of a fixed overhead of $650,000 plus variable costs of $20 per pair of shoes. Each pair of shoes sells for $70.
(a) Find the total cost, C(q), the total revenue, R(q), and the total profit, π(q), as a function of the number of pairs of shoes produced, q.
(b) Find the marginal cost, marginal revenue, and marginal profit.
(c) How many pairs of shoes must be produced and sold for the company to make a profit?
22. A $15,000 robot depreciates linearly to zero in 10 years.
(a) Find a formula for its value as a function of time.
(b) How much is the robot worth three years after it is purchased?
23. A $50,000 tractor has a resale value of $10,000 twenty years after it was purchased. Assume that the value of the tractor depreciates linearly from the time of purchase.
(a) Find a formula for the value of the tractor as a function of the time since it was purchased.
(b) Graph the value of the tractor against time.
(c) Find the horizontal and vertical intercepts, give units, and interpret them.
24. A new bus worth $100,000 in 2010 depreciates linearly to $20,000 in 2030.
(a) Find a formula for the value of the bus, V, as a function of time, t, in years since 2010.
(b) What is the value of the bus in 2015?
(c) Find and interpret the vertical and horizontal intercepts of the graph of the function.
(d) What is the domain of the function?
25. A corporate office provides the demand curve in Figure 1.57 to its ice cream shop franchises. At a price of $1.00 per scoop, 240 scoops per day can be sold.
(a) Estimate how many scoops could be sold per day at a price of 50¢ per scoop. Explain.
(b) Estimate how many scoops per day could be sold at a price of $1.50 per scoop. Explain.

26. The table shows the cost of manufacturing various quantities of an item and the revenue obtained from their sale.

(a) What range of production levels appears to be profitable?
(b) Calculate the profit or loss for each of the quantities shown. Estimate the most profitable production level.
27. One of Tables 1.28 and 1.29 represents a supply curve; the other represents a demand curve.
(a) Which table represents which curve? Why?
(b) At a price of $155, approximately how many items would consumers purchase?
(c) At a price of $155, approximately how many items would manufacturers supply?
(d) Will the market push prices higher or lower than $155?
(e) What would the price have to be if you wanted consumers to buy at least 20 items?
(f) What would the price have to be if you wanted manufacturers to supply at least 20 items?
28. Figure 1.58 shows supply and demand for a product.
(a) What is the equilibrium price for this product? At this price, what quantity is produced?
(b) Choose a price above the equilibrium price—for example, p = 12. At this price, how many items are suppliers willing to produce? How many items do consumers want to buy? Use your answers to these questions to explain why, if prices are above the equilibrium price, the market tends to push prices lower (toward the equilibrium).
(c) Now choose a price below the equilibrium price—for example, p = 8. At this price, how many items are suppliers willing to produce? How many items do consumers want to buy? Use your answers to these questions to explain why, if prices are below the equilibrium price, the market tends to push prices higher (toward the equilibrium).

29. A company produces and sells shirts. The fixed costs are $7000 and the variable costs are $5 per shirt.
(a) Shirts are sold for $12 each. Find cost and revenue as functions of the quantity of shirts, q.
(b) The company is considering changing the selling price of the shirts. Demand is q = 2000 − 40p, where p is price in dollars and q is the number of shirts. What quantity is sold at the current price of $12? What profit is realized at this price?
(c) Use the demand equation to write cost and revenue as functions of the price, p. Then write profit as a function of price.
(d) Graph profit against price. Find the price that maximizes profits. What is this profit?
30. When the price, p, charged for a boat tour was $25, the average number of passengers per week, N, was 500. When the price was reduced to $20, the average number of passengers per week increased to 650. Find a formula for the demand curve, assuming that it is linear.
31. Table 1.30 gives data for the linear demand curve for a product, where p is the price of the product and q is the quantity sold every month at that price. Find formulas for the following functions. Interpret their slopes in terms of demand.
(a) q as a function of p.
(b) p as a function of q.
32. The demand curve for a product is given by q = 120,000 − 500p and the supply curve is given by q = 1000p for 0 ≤ q ≤ 120,000, where price is in dollars.
(a) At a price of $100, what quantity are consumers willing to buy and what quantity are producers willing to supply? Will the market push prices up or down?
(b) Find the equilibrium price and quantity. Does your answer to part (a) support the observation that market forces tend to push prices closer to the equilibrium price?
33. World production, Q, of zinc in thousands of metric tons and the value, P, in dollars per metric ton are given54 in Table 1.31. Plot the value as a function of production. Sketch a possible supply curve.
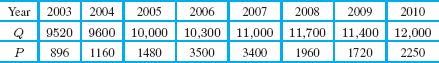
34. A taxi company has an annual budget of $720,000 to spend on drivers and car replacement. Drivers cost the company $30,000 each and car replacements cost $20,000 each.
(a) What is the company's budget constraint equation? Let d be the number of drivers paid and c be the number of cars replaced.
(b) Find and interpret both intercepts of the graph of the equation.
35. A company has a total budget of $500,000 and spends this budget on raw materials and personnel. The company uses m units of raw materials, at a cost of $100 per unit, and hires r employees, at a cost of $25,000 each.
(a) What is the equation of the company's budget constraint?
(b) Solve for m as a function of r.
(c) Solve for r as a function of m.
36. You have a budget of $2000 for the year to cover your books and social outings. Books cost (on average) $80 each and social outings cost (on average) $20 each. Let b denote the number of books purchased per year and s denote the number of social outings in a year.
(a) What is the equation of your budget constraint?
(b) Graph the budget constraint. (It does not matter which variable you put on which axis.)
(c) Find the vertical and horizontal intercepts, and give a financial interpretation for each.
37. Linear supply and demand curves are shown in Figure 1.59, with price on the vertical axis.
(a) Label the equilibrium price p0 and the equilibrium quantity q0 on the axes.
(b) Explain the effect on equilibrium price and quantity if the slope, Δp/Δq, of the supply curve increases. Illustrate your answer graphically.
(c) Explain the effect on equilibrium price and quantity if the slope, Δp/Δq, of the demand curve becomes more negative. Illustrate your answer graphically.

38. The demand for a product is given by p = 90 − 10q. Find the ratio
![]()
if the price changes from p = 50 to p = 51. Interpret this ratio.
39. A demand curve has equation q = 100 − 5p, where p is price in dollars. A $2 tax is imposed on consumers. Find the equation of the new demand curve. Sketch both curves.
40. A supply curve has equation q = 4p − 20, where p is price in dollars. A $2 tax is imposed on suppliers. Find the equation of the new supply curve. Sketch both curves.
41. A tax of $8 per unit is imposed on the supplier of an item. The original supply curve is q = 0.5p − 25 and the demand curve is q = 165−0.5p, where p is price in dollars. Find the equilibrium price and quantity before and after the tax is imposed.
42. The demand and supply curves for a product are given in terms of price, p, by
![]()
(a) Find the equilibrium price and quantity. Represent your answers on a graph.
(b) A specific tax of $6 per unit is imposed on suppliers. Find the new equilibrium price and quantity. Represent your answers on the graph.
(c) How much of the $6 tax is paid by consumers and how much by producers?
(d) What is the total tax revenue received by the government?
43. In Example 8, the demand and supply curves are given by q = 100 − 2p and q = 3p − 50, respectively; the equilibrium price is $30 and the equilibrium quantity is 40 units. A sales tax of 5% is imposed on the consumer.
(a) Find the equation of the new demand and supply curves.
(b) Find the new equilibrium price and quantity.
(c) How much is paid in taxes on each unit? How much of this is paid by the consumer and how much by the producer?
(d) How much tax does the government collect?
44. Answer the questions in Problem 43, assuming that the 5% sales tax is imposed on the supplier instead of the consumer.
1.5 EXPONENTIAL FUNCTIONS
The function f(x) = 2x, where the power is variable, is an exponential function. The number 2 is called the base. Exponential functions of the form f(x) = k · ax, where a is a positive constant, are used to represent many phenomena in the natural and social sciences.
Population Growth
The population of Burkina Faso, a sub-Saharan African country,55 from 2003 to 2009 is given in Table 1.32. To see how the population is growing, we look at the increase in population in the third column. If the population had been growing linearly, all the numbers in the third column would be the same.


Figure 1.60: Population of Burkina Faso (estimated): Exponential growth
Suppose we divide each year's population by the previous year's population. For example,

The fact that both calculations give 1.034 shows the population grew by about 3.4% between 2003 and 2004 and between 2004 and 2005. Similar calculations for other years show that the population grew by a factor of about 1.034, or 3.4%, every year. Whenever we have a constant percent increase (here 3.4%), we have exponential growth. If t is the number of years since 2003 and population is in millions,

So P, the population in millions t years after 2003, is given by
![]()
Since the variable t is in the exponent, this is an exponential function. The base, 1.034, represents the factor by which the population grows each year and is called the growth factor. Assuming that the formula holds for 50 years, the population graph has the shape in Figure 1.60. The population is growing, so the function is increasing. Since the population grows faster as time passes, the graph is concave up. This behavior is typical of an exponential function. Even exponential functions that climb slowly at first, such as this one, eventually climb extremely quickly.
Elimination of a Drug from the Body
Now we look at a quantity that is decreasing instead of increasing. When a patient is given medication, the drug enters the bloodstream. The rate at which the drug is metabolized and eliminated depends on the particular drug. For the antibiotic ampicillin, approximately 40% of the drug is eliminated every hour. A typical dose of ampicillin is 250 mg. Suppose Q = f(t), where Q is the quantity of ampicillin, in mg, in the bloodstream at time t hours since the drug was given. At t = 0, we have Q = 250. Since the quantity remaining at the end of each hour is 60% of the quantity remaining the hour before, we have

So, after t hours,
![]()
This function is called an exponential decay function. As t increases, the function values get arbitrarily close to zero. The t-axis is a horizontal asymptote for this function.
Notice the way the values in Table 1.33 are decreasing. Each additional hour a smaller quantity of drug is removed than the previous hour (100 mg the first hour, 60 mg the second, and so on). This is because as time passes, there is less of the drug in the body to be removed. Thus, the graph in Figure 1.61 bends upward. Compare this to the exponential growth in Figure 1.60, where each step upward is larger than the previous one. Notice that both graphs are concave up.


Figure 1.61: Drug elimination: Exponential decay
The General Exponential Function
Exponential growth is often described in terms of percent growth rates. The population of Burkina Faso is growing at 3.4% per year, so it increases by a factor of a = 1 + 0.034 = 1.034 every year. Similarly, 40% of the ampicillin is removed every hour, so the quantity remaining decays by a factor of a = 1 − 0.40 = 0.6 each hour. We have the following general formulas.
We say that P is an exponential function of t with base a if
![]()
where P0 is the initial quantity (when t = 0) and a is the factor by which P changes when t increases by 1. If a > 1, we have exponential growth; if 0 < a < 1, we have exponential decay. The factor a is given by
![]()
where r is the decimal representation of the percent rate of change; r may be positive (for growth) or negative (for decay).
The largest possible domain for the exponential function is all real numbers,56 provided a > 0.
Comparison Between Linear and Exponential Functions
Every exponential function changes at a constant percent, or relative, rate. For example, the population of Burkina Faso increased approximately 3.4% per year. Every linear function changes at a constant absolute rate. For example, the Olympic pole vault record increased by 2 inches per year.
A linear function has a constant rate of change.
An exponential function has a constant percent, or relative, rate of change.
| Example 1 | The amount of adrenaline in the body can change rapidly. Suppose the initial amount is 15 mg. Find a formula for A, the amount in mg, at a time t minutes later if A is:
(a) Increasing by 0.4 mg per minute. (b) Decreasing by 0.4 mg per minute. (c) Increasing by 3% per minute. (d) Decreasing by 3% per minute. |
| Solution | (a) This is a linear function with initial quantity 15 and slope 0.4, so
(b) This is a linear function with initial quantity 15 and slope −0.4, so
(c) This is an exponential function with initial quantity 15 and base 1 + 0.03 = 1.03, so
(d) This is an exponential function with initial quantity 15 and base 1 − 0.03 = 0.97, so
|
| Example 2 | Wolves were once common in the western US. By the 1990s, the wolf population in Wyoming had been wiped out by hunters and wolves put on the endangered species list. In 1995, wolves were reintroduced to Wyoming from Canada. Starting with 14 wolves, their number increased to 207 wolves in 2012.57 Assuming the Wyoming wolf population was growing exponentially, find a function of the form P = P0at, where P is the population t years after 1995. What is the annual percent growth rate? |
| Solution | We know that P0 = 14 when t = 0. In 2012, when t = 17, we have P = 207. Substituting in P = P0at gives an equation we can solve for a:
Dividing both sides by 14 gives
Taking the 17th root of both sides, we get
Since a = 1.172, the Wyoming wolf population as a function of the number of years since 1995 is given by
During this period, the population increased by about 17% per year. |
The Family of Exponential Functions and the Number e
The formula P = P0at gives a family of exponential functions with parameters P0 (the initial quantity) and a (the base). The base tells us whether the function is increasing (a > 1) or decreasing (0 < a < 1). Since a is the factor by which P changes when t is increased by 1, large values of a mean fast growth; values of a near 0 mean fast decay. (See Figures 1.62 and 1.63.) All members of the family P = P0at are concave up if P0 > 0.

Figure 1.62: Exponential growth: P = at, for a > 1

Figure 1.63: Exponential decay: P = at, for 0 < a < 1
In practice the most commonly used base is the number e = 2.71828. . . . The fact that most calculators have an ex button is an indication of how important e is. Since e is between 2 and 3, the graph of y = et in Figure 1.62 is between the graphs of y = 2t and y = 3t.
The base e is used so often that it is called the natural base. At first glance, this is somewhat mysterious: What could be natural about using 2.71828... as a base? The full answer to this question must wait until Chapter 3, where you will see that many calculus formulas come out more neatly when e is used as the base. (See Appendix B for the relation to compound interest.)
Problems for Section 1.5
1. The following functions give the populations of four towns with time t in years.
(i) P = 600(1.12)t
(ii) P = 1,000(1.03)t
(iii) P = 200(1.08)t
(iv) P = 900(0.90)t
(a) Which town has the largest percent growth rate? What is the percent growth rate?
(b) Which town has the largest initial population? What is that initial population?
(c) Are any of the towns decreasing in size? If so, which one(s)?
2. Each of the following functions gives the amount of a substance present at time t. In each case, give the amount present initially (at t = 0), state whether the function represents exponential growth or decay, and give the percent growth or decay rate.
(a) A = 100(1.07)t
(b) A = 5.3(1.054)t
(c) A = 3500(0.93)t
(d) A = 12(0.88)t
3. Figure 1.64 shows graphs of several cities' populations against time. Match each of the following descriptions to a graph and write a description to match each of the remaining graphs.
(a) The population increased at 5% per year.
(b) The population increased at 8% per year.
(c) The population increased by 5000 people per year.
(d) The population was stable.

Give a possible formula for the functions in Problems 4–5.
4.

5.

6. The gross domestic product, G, of Switzerland was 310 billion dollars in 2007. Give a formula for G (in billions of dollars) t years after 2007 if G increases by
(a) 3% per year
(b) 8 billion dollars per year
7. A town has a population of 1000 people at time t = 0. In each of the following cases, write a formula for the population, P, of the town as a function of year t.
(a) The population increases by 50 people a year.
(b) The population increases by 5% a year.
8. A product costs $80 today. How much will the product cost in t days if the price is reduced by
(a) $4 a day
(b) 5% a day
9. An air-freshener starts with 30 grams and evaporates. In each of the following cases, write a formula for the quantity, Q grams, of air-freshener remaining t days after the start and sketch a graph of the function. The decrease is:
(a) 2 grams a day
(b) 12% a day
10. World population is approximately P = 6.4(1.0126)t, with P in billions and t in years since 2004.
(a) What is the yearly percent rate of growth of the world population?
(b) What was the world population in 2004? What does this model predict for the world population in 2010?
(c) Use part (b) to find the average rate of change of the world population between 2004 and 2010.
11. A 50 mg dose of quinine is given to a patient to prevent malaria. Quinine leaves the body at a rate of 6% per hour.
(a) Find a formula for the amount, A (in mg), of quinine in the body t hours after the dose is given.
(b) How much quinine is in the body after 24 hours?
(c) Graph A as a function of t.
(d) Use the graph to estimate when 5 mg of quinine remains.
12. The consumer price index (CPI) for a given year is the amount of money in that year that has the same purchasing power as $100 in 1983. At the start of 2009, the CPI was 211. Write a formula for the CPI as a function of t years after 2009, assuming that the CPI increases by 2.8% every year.
13. During the 1980s, Costa Rica had the highest deforestation rate in the world, at 2.9% per year. (This is the rate at which land covered by forests is shrinking.) Assuming the rate continues, what percent of the land in Costa Rica covered by forests in 1980 will be forested in 2015?
14. Graph y = 100e−0.4x. Describe what you see.
15. (a) Make a table of values for y = ex using x = 0, 1, 2, 3.
(b) Plot the points found in part (a). Does the graph look like an exponential growth or decay function?
(c) Make a table of values for y = e−x using x = 0, 1, 2, 3.
(d) Plot the points found in part (c). Does the graph look like an exponential growth or decay function?
For Problems 16–17, find a possible formula for the function represented by the data.
16.
![]()
17.
![]()
In Problems 18–19, find all the tables that have the given characteristic.

18. y could be a linear function of x.
19. y could be an exponential function of x.
In Problems 20–23, a quantity P is an exponential function of time t. Use the given information about the function P = P0at to:
(a) Find values for the parameters a and P0.
(b) State the initial quantity and the percent rate of growth or decay.
20. P0a3 = 75 and P0a2 = 50
21. P0a4 = 18 and P0a3 = 20
22. P = 320 when t = 5 and P = 500 when t = 3
23. P = 1600 when t = 3 and P = 1000 when t = 1
24. If the world's population increased exponentially from 5.937 billion in 1998 to 6.771 billion in 2008 and continued to increase at the same percentage rate between 2008 and 2012, calculate what the world's population would have been in 2012. How does this compare to the Population Reference Bureau estimate of 7.07 billion in July 2012?58
25. The number of passengers using a railway fell from 190,205 to 174,989 during a 5-year period. Find the annual percentage decrease over this period.
26. The company that produces Cliffs Notes (abridged versions of classic literature) was started in 1958 with $4000 and sold in 1998 for $14,000,000. Find the annual percent increase in the value of this company over the 40 years.
27. Find a formula for the number of zebra mussels in a bay as a function of the number of years since 2010, given that there were 2700 at the start of 2010 and 3186 at the start of 2011.
(a) Assume that the number of zebra mussels is growing linearly. Give units for the slope of the line and interpret it in terms of zebra mussels.
(b) Assume that the number of zebra mussels is growing exponentially. What is the annual percent growth rate of the zebra mussel population?
28. Worldwide, wind energy59 generating capacity, W, was 39,295 megawatts in 2003 and 120,903 megawatts in 2008.
(a) Use the values given to write W, in megawatts, as a linear function of t, the number of years since 2003.
(b) Use the values given to write W as an exponential function of t.
(c) Graph the functions found in parts (a) and (b) on the same axes. Label the given values.
(d) Use the functions found in parts (a) and (b) to predict the wind energy generated in 2010. The actual wind energy generated in 2010 was 196,653 megawatts. Comment on the results: Which estimate is closer to the actual value?
29. (a) Which (if any) of the functions in the following table could be linear? Find formulas for those functions.
(b) Which (if any) of these functions could be exponential? Find formulas for those functions.
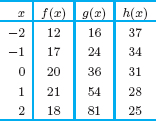
30. Determine whether each of the following tables of values could correspond to a linear function, an exponential function, or neither. For each table of values that could correspond to a linear or an exponential function, find a formula for the function.

31. (a) Could the data on annual world soybean production60 in Table 1.34 correspond to a linear function or an exponential function? If so, which?
(b) Find a formula for P, world soybean production in millions of tons, as a function of time, t, in years since 2000.
(c) What is the annual percent increase in soybean production?
32. The 2004 US presidential debates questioned whether the minimum wage has kept pace with inflation. Decide the question using the following information:61 In 1938, the minimum wage was 25¢ in 2004, it was $5.15. During the same period, inflation averaged 4.3%.
33. (a) Niki invested $10,000 in the stock market. The investment was a loser, declining in value 10% per year each year for 10 years. How much was the investment worth after 10 years?
(b) After 10 years, the stock began to gain value at 10% per year. After how long will the investment regain its initial value ($10,000)?
34. A photocopy machine can reduce copies to 80% of their original size. By copying an already reduced copy, further reductions can be made.
(a) If a page is reduced to 80%, what percent enlargement is needed to return it to its original size?
(b) Estimate the number of times in succession that a page must be copied to make the final copy less than 15% of the size of the original.
35. Whooping cough was thought to have been almost wiped out by vaccinations. It is now known that the vaccination wears off, leading to an increase in the number of cases, w, from 1248 in 1981 to 18,957 in 2004.
(a) With t in years since 1980, find an exponential function that fits this data.
(b) What does your answer to part (a) give as the average annual percent growth rate of the number of cases?
(c) On May 4, 2005, the Arizona Daily Star reported (correctly) that the number of cases had more than doubled between 2000 and 2004. Does your model confirm this report? Explain.
36. Aircraft require longer takeoff distances, called takeoff rolls, at high altitude airports because of diminished air density. The table shows how the takeoff roll for a certain light airplane depends on the airport elevation. (Takeoff rolls are also strongly influenced by air temperature; the data shown assume a temperature of 0° C.) Determine a formula for this particular aircraft that gives the takeoff roll as an exponential function of airport elevation.
![]()
Problems 37–38 concern biodiesel, a fuel derived from renewable resources such as food crops, algae, and animal oils. The table shows the percent growth over the previous year in US biodiesel consumption.62
![]()
37. (a) According to the US Department of Energy, the US consumed 91 million gallons of biodiesel in 2005. Approximately how much biodiesel (in millions of gallons) did the US consume in 2006? In 2007?
(b) Graph the points showing the annual US consumption of biodiesel, in millions of gallons of biodiesel, for the years 2005 to 2009. Label the scales on the horizontal and vertical axes.
38. (a) True or false: The annual US consumption of biodiesel grew exponentially from 2003 to 2005. Justify your answer without doing any calculations.
(b) According to this data, during what single year(s), if any, did the US consumption of biodiesel at least double?
(c) According to this data, during what single year(s), if any, did the US consumption of biodiesel at least triple?
39. Hydroelectric power is electric power generated by the force of moving water. The table shows the annual percent change in hydroelectric power consumption by the US industrial sector.63
![]()
(a) According to the US Department of Energy, the US industrial sector consumed about 29 trillion BTUs of hydroelectric power in 2006. Approximately how much hydroelectric power (in trillion BTUs) did the US consume in 2007? In 2005?
(b) Graph the points showing the annual US consumption of hydroelectric power, in trillion BTUs, for the years 2004 to 2009. Label the scales on the horizontal and vertical axes.
(c) According to this data, when did the largest yearly decrease, in trillion BTUs, in the US consumption of hydroelectric power occur? What was this decrease?
Problems 40–41 concern wind power, which has been used for centuries to propel ships and mill grain. Modern wind power is obtained from windmills that convert wind energy into electricity. Figure 1.65 shows the annual percent growth in US wind power consumption64 between 2005 and 2009.

40. (a) According to the US Department of Energy, the US consumption of wind power was 341 trillion BTUs in 2007. How much wind power did the US consume in 2006? In 2008?
(b) Graph the points showing the annual US consumption of wind power, in trillion BTUs, for the years 2005 to 2009. Label the scales on the horizontal and vertical axes.
(c) Based on this data, in what year did the largest yearly increase, in trillion BTUs, in the US consumption of wind power occur? What was this increase?
41. (a) According to Figure 1.65, during what single year(s), if any, did the US consumption of wind power energy increase by at least 40%? Decrease by at least 40%?
(b) Did the US consumption of wind power energy double from 2006 to 2008?
1.6 THE NATURAL LOGARITHM
If t is in years since 2000, the population of Nevada (in millions) can be modeled by the function
![]()
How do we find when the population is projected to reach 4 million? We want to find the value of t for which
![]()
We use logarithms to solve for a variable in an exponent.
Definition and Properties of the Natural Logarithm
We define the natural logarithm of x, written ln x, as follows:
The natural logarithm of x, written ln x, is the power of e needed to get x. In other words,
![]()
The natural logarithm is sometimes written loge x.
For example, ln e3 = 3 since 3 is the power of e needed to give e3. Similarly, ln(1/e) = ln e−1 = −1. A calculator gives ln 5 = 1.6094, because e1.6094 = 5. However if we try to find ln(−7) on a calculator, we get an error message because e to any power is never negative or 0. In general

To work with logarithms, we use the following properties:
Properties of the Natural Logarithm
- ln(AB) = ln A + ln B
- ln
 = In A − In B
 - ln (Ap) = p ln A
- ln ex = x
- elnx = x
In addition, ln 1 = 0 because e0 = 1, and ln e = 1 because e1 = e.
Using the ![]() button on a calculator, we get the graph of f(x) = ln x in Figure 1.66. Observe that, for large x, the graph of y = ln x climbs very slowly as x increases. The x-intercept is x = 1, since ln 1 = 0. For x > 1, the value of ln x is positive; for 0 < x < 1, the value of ln x is negative.
button on a calculator, we get the graph of f(x) = ln x in Figure 1.66. Observe that, for large x, the graph of y = ln x climbs very slowly as x increases. The x-intercept is x = 1, since ln 1 = 0. For x > 1, the value of ln x is positive; for 0 < x < 1, the value of ln x is negative.

Figure 1.66: The natural logarithm function climbs very slowly
Solving Equations Using Logarithms
Natural logs can be used to solve for unknown exponents.
| Example 1 | Find t such that 3t = 10. |
| Solution | First, notice that we expect t to be between 2 and 3, because 32 = 9 and 33 = 27. To find t exactly, we take the natural logarithm of both sides and solve for t:
The third property of logarithms tells us that ln(3t) = t ln 3, so we have
Using a calculator to find the natural logs gives
|

| Example 3 | Find t such that 12 = 5e3t. |
| Solution | It is easiest to begin by isolating the exponential, so we divide both sides of the equation by 5:
Now take the natural logarithm of both sides:
Since ln(ex) = x, we have
so, using a calculator, we get
|
Exponential Functions with Base e
An exponential function with base a has formula
![]()
For any positive number a, we can write a = ek where k = ln a. Thus, the exponential function can be rewritten as
![]()
If a > 1, then k is positive, and if 0 < a < 1, then k is negative. We conclude:
Writing a = ek, so k = ln a, any exponential function can be written in two forms
![]()
- If a > 1, we have exponential growth; if 0 < a < 1, we have exponential decay.
- If k > 0, we have exponential growth; if k < 0, we have exponential decay.
- k is called the continuous growth or decay rate.
The word continuous in continuous growth rate is used in the same way to describe continuous compounding of interest earned on money. (See Appendix A.)
| Example 4 | (a) Convert the function P = 1000e0.05t to the form P = P0at.
(b) Convert the function P = 500(1.06)t to the form P = P0ekt. |
| Solution | (a) Since P = 1000e0.05t, we have P0 = 1000. We want to find a so that
We take a = e0.05 = 1.0513, so the following two functions give the same values:
So a continuous growth rate of 5% is equivalent to a growth rate of 5.13% per unit time. (b) We have P0 = 500 and we want to find k with
so we take
The following two functions give the same values:
So a growth rate of 6% per unit time is equivalent to a continuous growth rate of 5.83%. |
| Example 5 | Sketch graphs of P = e0.5t, a continuous growth rate of 50%, and Q = 5e−0.2t, a continuous decay rate of 20%. |
| Solution | The graph of P = e0.5t is in Figure 1.67. Notice that the graph is the same shape as the previous exponential growth curves: increasing and concave up. The graph of Q = 5e−0.2t is in Figure 1.68; it has the same shape as other exponential decay functions.
Figure 1.67: Continuous exponential growth function
|


Problems for Section 1.6
For Problems 1–16, solve for t using natural logarithms.
1. 10 = 2t
2. 5t = 7
3. 2 = (1.02)t
4. 130 = 10t
5. 10 = et
6. 100 = 25(1.5)t
7. 50 = 10 · 3t
8. 5 = 2et
9. e3t = 100
10. 10 = 6e0.5t
11. 40 = 100e−0.03t
12. a = bt
13. B = Pert
14. 2P = Pe0.3t
15. 7 · 3t = 5 · 2t
16. 5e3t = 8e2t
The functions in Problems 17–20 represent exponential growth or decay. What is the initial quantity? What is the growth rate? State if the growth rate is continuous.
17. P = 5(1.07)t
18. P = 7.7(0.92)t
19. P = 15e−0.06t
20. P = 3.2e0.03t
Write the functions in Problems 21–24 in the form P = P0at. Which represent exponential growth and which represent exponential decay?
21. P = 15e0.25t
22. P = 2e−0.5t
23. P = P0e0.2t
24. P = 7e−πt
In Problems 25–28, put the functions in the form P = P0ekt.
25. P = 15(1.5)t
26. P = 10(1.7)t
27. P = 174(0.9)t
28. P = 4(0.55)t
In Problems 29–30, a quantity P is an exponential function of time t. Use the given information about the function P = P0ekt to:
(a) Find values for the parameters k and P0.
(b) State the initial quantity and the continuous percent rate of growth or decay.
29. P = 140 when t = 3 and P = 100 when t = 1
30. P = 40 when t = 4 and P = 50 when t = 3
31. (a) What is the continuous percent growth rate for P = 100e0.06t, with time, t, in years?
(b) Write this function in the form P = P0at. What is the annual percent growth rate?
32. (a) What is the annual percent decay rate for P = 25(0.88)t, with time, t, in years?
(b) Write this function in the form P = P0ekt. What is the continuous percent decay rate?
33. What annual percent growth rate is equivalent to a continuous percent growth rate of 8%?
34. What continuous percent growth rate is equivalent to an annual percent growth rate of 10%?
35. The following formulas give the populations of four different towns, A, B, C, and D, with t in years from now.
PA = 600e0.08t PB = 1000e−0.02t
PC = 1200e0.03t PD = 900e0.12t
(a) Which town is growing fastest (that is, has the largest percentage growth rate)?
(b) Which town is the largest now?
(c) Are any of the towns decreasing in size? If so, which one(s)?
36. A city's population is 1000 and growing at 5% a year.
(a) Find a formula for the population at time t years from now assuming that the 5% per year is an:
(i) Annual rate
(ii) Continuous annual rate
(b) In each case in part (a), estimate the population of the city in 10 years.
37. The population, P, in millions, of Nicaragua was 5.4 million in 2004 and growing at an annual rate of 3.4%. Let t be time in years since 2004.
(a) Express P as a function in the form P = P0at.
(b) Express P as an exponential function using base e.
(c) Compare the annual and continuous growth rates.
38. The gross world product is W = 32.4(1.036)t, where W is in trillions of dollars and t is years since 2001. Find a formula for gross world product using a continuous growth rate.
39. The population of the world can be represented by P = 7(1.0115)t, where P is in billions of people and t is years since 2012. Find a formula for the population of the world using a continuous growth rate.
40. A fishery stocks a pond with 1000 young trout. The number of trout t years later is given by P(t) = 1000e−0.5t.
(a) How many trout are left after six months? After 1 year?
(b) Find P(3) and interpret it in terms of trout.
(c) At what time are there 100 trout left?
(d) Graph the number of trout against time, and describe how the population is changing. What might be causing this?
41. The Hershey Company is the largest US producer of chocolate. In 2011, annual net sales were 6.1 billion dollars and were increasing at a continuous rate of 4.2% per year.65
(a) Write a formula for annual net sales, S, as a function of time, t, in years since 2011.
(b) Estimate annual net sales in 2015.
(c) Use a graph to estimate the year in which annual net sales are expected to pass 8 billion dollars and check your estimate using logarithms.
42. During a recession a firm's revenue declines continuously so that the revenue, R (measured in millions of dollars), in t years' time is given by R = 5e−0.15t.
(a) Calculate the current revenue and the revenue in two years' time.
(b) After how many years will the revenue decline to $2.7 million?
43. The population of a city is 50,000 in 2008 and is growing at a continuous yearly rate of 4.5%.
(a) Give the population of the city as a function of the number of years since 2008. Sketch a graph of the population against time.
(b) What will be the city's population in the year 2018?
(c) Calculate the time for the population of the city to reach 100,000. This is called the doubling time of the population.
44. For children and adults with diseases such as asthma, the number of respiratory deaths per year increases by 0.33% when pollution particles increase by a microgram per cubic meter of air.66
(a) Write a formula for the number of respiratory deaths per year as a function of quantity of pollution in the air. (Let Q0 be the number of deaths per year with no pollution.)
(b) What quantity of air pollution results in twice as many respiratory deaths per year as there would be without pollution?
45. The concentration of the car exhaust fume nitrous oxide, NO2, in the air near a busy road is a function of distance from the road. The concentration decays exponentially at a continuous rate of 2.54% per meter.67 At what distance from the road is the concentration of NO2 half what it is on the road?
46. With time, t, in years since the start of 1980, textbook prices have increased at 6.7% per year while inflation has been 3.3% per year.68 Assume both rates are continuous growth rates.
(a) Find a formula for B(t), the price of a textbook in year t if it cost $B0 in 1980.
(b) Find a formula for P(t), the price of an item in year t if it cost $P0 in 1980 and its price rose according to inflation.
(c) A textbook cost $50 in 1980. When is its price predicted to be double the price that would have resulted from inflation alone?
47. In 2011, the populations of China and India were approximately 1.34 and 1.19 billion people69, respectively. However, due to central control the annual population growth rate of China was 0.4% while the population of India was growing by 1.37% each year. If these growth rates remain constant, when will the population of India exceed that of China?
48. In 2010, there were about 246 million vehicles (cars and trucks) and about 308.7 million people in the US.70 The number of vehicles grew 15.5% over the previous decade, while the population has been growing at 9.7% per decade. If the growth rates remain constant, when will there be, on average, one vehicle per person?
1.7 EXPONENTIAL GROWTH AND DECAY
Many quantities in nature change according to an exponential growth or decay function of the form P = P0ekt, where P0 is the initial quantity and k is the continuous growth or decay rate.
| Example 1 | The Environmental Protection Agency (EPA) investigated a spill of radioactive iodine. The radiation level at the site was about 2.4 millirems/hour (four times the maximum acceptable limit of 0.6 millirems/hour), so the EPA ordered an evacuation of the surrounding area. The level of radiation from an iodine source decays at a continuous hourly rate of k = −0.004.
(a) What was the level of radiation 24 hours later? (b) Find the number of hours until the level of radiation reached the maximum acceptable limit, and the inhabitants could return. |
| Solution | (a) The level of radiation, R, in millirems/hour, at time t, in hours since the initial measurement, is given by
so the level of radiation 24 hours later was
(b) A graph of R = 2.4e−0.004t is in Figure 1.69. The maximum acceptable value of R is 0.6 millirems per hour, which occurs at approximately t = 350. Using logarithms, we have
The inhabitants will not be able to return for 346.57 hours, or about 15 days.
|
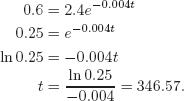

| Example 2 | The population of Kenya71 was 19.5 million in 1984 and 39.0 million in 2009. Assuming the population increases exponentially, find a formula for the population of Kenya as a function of time. |
| Solution | We measure the population, P, in millions and time, t, in years since 1984. We can express P in terms of t using the continuous growth rate k by
where P0 = 19.5 is the initial value of P. We find k using the fact that P = 39.0 when t = 25:
Divide both sides by 19.5, giving
Take natural logs of both sides:
Since ln(e25k) = 25k, this becomes
and therefore
Since k = 0.028 = 2.8%, the population of Kenya was growing at a continuous rate of 2.8% per year. |
Doubling Time and Half-Life
Every exponential growth function has a constant doubling time and every exponential decay function has a constant half-life.
The doubling time of an exponentially increasing quantity is the time required for the quantity to double.
The half-life of an exponentially decaying quantity is the time required for the quantity to be reduced by a factor of one half.
| Example 3 | Show algebraically that every exponentially growing function has a fixed doubling time. |
| Solution | Consider the exponential function P = P0at. For any base a with a > 1, there is a positive number d such that ad = 2. We show that d is the doubling time. If the population is P at time t, then at time t + d, the population is
So, no matter what the initial quantity and no matter what the initial time, the size of the population is doubled d time units later. |
| Example 4 | The release of chlorofluorocarbons used in air conditioners and household sprays (hair spray, shaving cream, etc.) destroys the ozone in the upper atmosphere. The quantity of ozone, Q, is decaying exponentially at a continuous rate of 0.25% per year. What is the half-life of ozone? In other words, at this rate, how long will it take for half the ozone to disappear? |
| Solution | If Q0 is the initial quantity of ozone and t is in years, then
We want to find the value of t making Q = Q0/2, so
Dividing both sides by Q0 and taking natural logs gives
so
Half the present atmospheric ozone will be gone in 277 years. |
Financial Applications: Compound Interest
We deposit $100 in a bank paying interest at a rate of 8% per year. How much is in the account at the end of the year? This depends on how often the interest is compounded. If the interest is paid into the account annually, that is, only at the end of the year, then the balance in the account after one year is $108. However, if the interest is paid twice a year, then 4% is paid at the end of the first six months and 4% at the end of the year. Slightly more money is earned this way, since the interest paid early in the year will earn interest during the rest of the year. This effect is called compounding.
In general, the more often interest is compounded, the more money is earned (although the increase may not be large). What happens if interest is compounded more frequently, such as every minute or every second? The benefit of increasing the frequency of compounding becomes negligible beyond a certain point. When that point is reached, we find the balance using the number e and we say that the interest per year is compounded continuously. If we have deposited $100 in an account paying 8% interest per year compounded continuously, the balance after one year is 100e0.08 = $108.33. Compounding is discussed further in Appendix B. In general:
An amount P0 is deposited in an account paying interest at a rate of r per year. Let P be the balance in the account after t years.
- If interest is compounded annually, then P = P0 (1 + r)t.
- If interest is compounded continuously, then P = P0ert, where e = 2.71828....
We write P0 for the initial deposit because it is the value of P when t = 0. Note that for a 7% interest rate, r = 0.07. If a rate is continuous, we will say so explicitly.
| Example 5 | A bank advertises an interest rate of 8% per year. If you deposit $5000, how much is in the account 3 years later if the interest is compounded (a) Annually? (b) Continuously? |
| Solution | (a) For annual compounding, P = P0(1 + r)t = 5000(1.08)3 = $6298.56.
(b) For continuous compounding, P = P0ert = 5000e0.08.3 = $6356.25. As expected, the amount in the account 3 years later is larger if the interest is compounded continuously ($6356.25) than if the interest is compounded annually ($6298.56). |
| Example 6 | If $10,000 is deposited in an account paying interest at a rate of 5% per year, compounded continuously, how long does it take for the balance in the account to reach $15,000? |
| Solution | Since interest is compounded continuously, we use P = P0ert with r = 0.05 and P0 10,000. We want to find the value of t for which P = 15,000. The equation is
Now divide both sides by 10,000, then take logarithms and solve for t:
It takes about 8.1 years for the balance in the account to reach $15,000. |
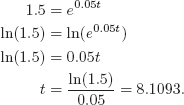
| Example 7 | (a) Calculate the doubling time, D, for interest rates of 2%, 3%, 4%, and 5% per year, compounded annually.
(b) Use your answers to part (a) to check that an interest rate of i% gives a doubling time approximated for small values of i by
This is the “Rule of 70” used by bankers: To compute the approximate doubling time of an investment, divide 70 by the percent annual interest rate. |
| Solution | (a) We find the doubling time for an interest rate of 2% per year using the formula P = P0(1.02)t with t in years. To find the value of t for which P = 2P0, we solve
With an annual interest rate of 2%, it takes about 35 years for an investment to double in value. Similarly, we find the doubling times for 3%, 4%, and 5% in Table 1.35. (b) We compute (70/i) for i = 2,3,4,5. The results are shown in Table 1.36. Comparing Tables 1.35 and 1.36, we see that the quantity (70/i) gives a reasonably accurate approximation to the doubling time, D, for the small interest rates we considered. |

Present and Future Value
Many business deals involve payments in the future. For example, when a car is bought on credit, payments are made over a period of time. Being paid $100 in the future is clearly worse than being paid $100 today for many reasons. If we are given the money today, we can do something else with it—for example, put it in the bank, invest it somewhere, or spend it. Thus, even without considering inflation, if we are to accept payment in the future, we would expect to be paid more to compensate for this loss of potential earnings.72 The question we consider now is, how much more?
To simplify matters, we consider only what we would lose by not earning interest; we do not consider the effect of inflation. Let's look at some specific numbers. Suppose we deposit $100 in an account that earns 7% interest per year compounded annually, so that in a year's time we have $107. Thus, $100 today is worth $107 a year from now. We say that the $107 is the future value of the $100, and that the $100 is the present value of the $107. In general, we say the following:
- The future value, B, of a payment, P, is the amount to which the P would have grown if deposited today in an interest-bearing bank account.
- The present value, P, of a future payment, B, is the amount that would have to be deposited in a bank account today to produce exactly B in the account at the relevant time in the future.
Due to the interest earned, the future value is larger than the present value. The relation between the present and future values depends on the interest rate, as follows.
Suppose B is the future value of P and P is the present value of B.
If interest is compounded annually at a rate r for t years, then
![]()
If interest is compounded continuously at a rate r for t years, then
![]()
The rate, r, is sometimes called the discount rate. The present value is often denoted by PV and the future value by FV.
| Example 8 | You win the lottery and are offered the choice between $1 million in four yearly installments of $250,000 each, starting now, and a lump-sum payment of $920,000 now. Assuming a 6% interest rate per year, compounded continuously, and ignoring taxes, which should you choose? |
| Solution | We assume that you pick the option with the largest present value. The first of the four $250,000 payments is made now, so
The second payment is made one year from now and so
Calculating the present value of the third and fourth payments similarly, we find:
Since the present value of the four payments is less than $920,000, you are better off taking the $920,000 now. Alternatively, we can compare the future values of the two pay schemes. We calculate the future value of both schemes three years from now, on the date of the last $250,000 payment. At that time,
The future value of the first $250,000 payment is $250,000e0.06(3). Calculating the future value of the other payments similarly, we find:
As we expect, the future value of the $920,000 payment is greater, so you are better off taking the $920,000 now.73 |
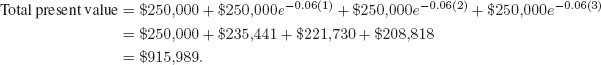

Problems for Section 1.7
1. Figure 1.70 shows the balances in two bank accounts. Both accounts pay the same interest rate, but one compounds continuously and the other compounds annually. Which curve corresponds to which compounding method? What is the initial deposit in each case?

2. The exponential function y(x) = Ceαx satisfies the conditions y(0) = 2 and y(1) = 1. Find the constants C and α. What is y(2)?
3. Suppose $1000 is invested in an account paying interest at a rate of 5.5% per year. How much is in the account after 8 years if the interest is compounded
(a) Annually?
(b) Continuously?
4. If you deposit $10,000 in an account earning interest at an 8% annual rate compounded continuously, how much money is in the account after five years?
5. If you need $20,000 in your bank account in 6 years, how much must be deposited now? The interest rate is 10%, compounded continuously.
6. If $12,000 is deposited in an account paying 8% interest per year, compounded continuously, how long will it take for the balance to reach $20,000?
7. If a bank pays 6% per year interest compounded continuously, how long does it take for the balance in an account to double?
8. Find the doubling time of a quantity that is increasing by 7% per year.
9. The half-life of nicotine in the blood is 2 hours. A person absorbs 0.4 mg of nicotine by smoking a cigarette. Fill in the following table with the amount of nicotine remaining in the blood after t hours. Estimate the length of time until the amount of nicotine is reduced to 0.04 mg.
![]()
10. World wind energy generating74 capacity, W, was 18,000 megawatts in 2000 and has been increasing at a continuous rate of approximately 27% per year. Assume this rate continues.
(a) Give a formula for W, in megawatts, as a function of time, t, in years since 2000.
(b) When is wind capacity predicted to pass 250,000 megawatts?
11. From October 2002 to October 2006 the number N(t) of Wikipedia articles was approximated by N(t) = N0et/500, where t is the number of days after October 1, 2002. Find the doubling time for the number of Wikipedia articles during this period.
12. You want to invest money for your child's education in a certificate of deposit (CD). You want it to be worth $12,000 in 10 years. How much should you invest if the CD pays interest at a 9% annual rate compounded
(a) Annually?
(b) Continuously?
13. A cup of coffee contains 100 mg of caffeine, which leaves the body at a continuous rate of 17% per hour.
(a) Write a formula for the amount, A mg, of caffeine in the body t hours after drinking a cup of coffee.
(b) Graph the function from part (a). Use the graph to estimate the half-life of caffeine.
(c) Use logarithms to find the half-life of caffeine.
14. A population, currently 200, is growing at 5% per year.
(a) Write a formula for the population, P, as a function of time, t, years in the future.
(b) Graph P against t.
(c) Estimate the population 10 years from now.
(d) Use the graph to estimate the doubling time of the population.
15. Air pressure, P, decreases exponentially with height, h, above sea level. If P0 is the air pressure at sea level and h is in meters, then
![]()
(a) At the top of Mount McKinley, height 6194 meters (about 20,320 feet), what is the air pressure, as a percent of the pressure at sea level?
(b) The maximum cruising altitude of an ordinary commercial jet is around 12,000 meters (about 39,000 feet). At that height, what is the air pressure, as a percent of the sea level value?
16. The antidepressant fluoxetine (or Prozac) has a half-life of about 3 days. What percentage of a dose remains in the body after one day? After one week?
17. A firm decides to increase output at a constant relative rate from its current level of 20,000 to 30,000 units during the next five years. Calculate the annual percent rate of increase required to achieve this growth.
18. The half-life of a radioactive substance is 12 days. There are 10.32 grams initially.
(a) Write an equation for the amount, A, of the substance as a function of time.
(b) When is the substance reduced to 1 gram?
19. One of the main contaminants of a nuclear accident, such as that at Chernobyl, is strontium-90, which decays exponentially at a rate of approximately 2.5% per year.
(a) Write the percent of strontium-90 remaining, P, as a function of years, t, since the nuclear accident. [Hint: 100% of the contaminant remains at t = 0.]
(b) Graph P against t.
(c) Estimate the half-life of strontium-90.
(d) After the Chernobyl disaster, it was predicted that the region would not be safe for human habitation for 100 years. Estimate the percent of original strontium-90 remaining at this time.
20. The number of people living with HIV infections increased worldwide approximately exponentially from 2.5 million in 1985 to 34 million in 2010.75 (HIV is the virus that causes AIDS.)
(a) Give a formula for the number of HIV infections, H, (in millions) as a function of years, t, since 1985. Use the form H = H0ekt. Graph this function.
(b) What was the yearly continuous percent change in the number of HIV infections between 1985 and 2010?
21. (a) Figure 1.71 shows exponential growth. Starting at t = 0, estimate the time for the population to double.
(b) Repeat part (a), but this time start at t = 3.
(c) Pick any other value of t for the starting point, and notice that the doubling time is the same no matter where you start.

22. An exponentially growing animal population numbers 500 at time t = 0; two years later, it is 1500. Find a formula for the size of the population in t years and find the size of the population at t = 5.
23. If the quantity of a substance decreases by 4% in 10 hours, find its half-life.
24. Pregnant women metabolize some drugs at a slower rate than the rest of the population. The half-life of caffeine is about 4 hours for most people. In pregnant women, it is 10 hours.76 (This is important because caffeine, like all psychoactive drugs, crosses the placenta to the fetus.) If a pregnant woman and her husband each have a cup of coffee containing 100 mg of caffeine at 8 am, how much caffeine does each have left in the body at 10 pm?
25. The half-life of radioactive strontium-90 is 29 years. In 1960, radioactive strontium-90 was released into the atmosphere during testing of nuclear weapons, and was absorbed into people's bones. How many years does it take until only 10% of the original amount absorbed remains?
26. In 1923, koalas were introduced on Kangaroo Island off the coast of Australia. In 1996, the population was 5000. By 2005, the population had grown to 27,000, prompting a debate on how to control their growth and avoid koalas dying of starvation.77 Assuming exponential growth, find the (continuous) rate of growth of the koala population between 1996 and 2005. Find a formula for the population as a function of the number of years since 1996, and estimate the population in the year 2020.
27. The population of the US was 281.4 million in 2000 and 308.7 million in 2010.78 Assuming exponential growth,
(a) In what year is the population expected to go over 350 million?
(b) What population is predicted for the 2020 census?
28. In 2012, the world's population was 7 billion, and the population is projected79 to reach 8 billion by the year 2025. What annual growth rate is projected?
29. A picture supposedly painted by Vermeer (1632–1675) contains 99.5% of its carbon-14 (half-life 5730 years). From this information decide whether the picture is a fake. Explain your reasoning.
30. In November 2010, a “tiger summit” was held in St. Petersburg, Russia.80 In 1900, there were 100,000 wild tigers worldwide; in 2010 the number was 3200.
(a) Assuming the tiger population has decreased exponentially, find a formula for f(t), the number of wild tigers t years since 1900.
(b) Between 2000 and 2010, the number of wild tigers decreased by 40%. Is this percentage larger or smaller than the decrease in the tiger population predicted by your answer to part (a)?
31. The world population was 6.9 billion at the end of 2010 and is predicted to reach 9 billion by the end of 2050.81
(a) Assuming the population is growing exponentially, what is the continuous growth rate per year?
(b) The United Nations celebrated the “Day of 5 Billion” on July 11, 1987, and the “Day of 6 Billion” on October 12, 1999. Using the growth rate in part (a), when is the “Day of 7 Billion” predicted to be?
32. The number of alternative fuel vehicles82 running on E85, fuel that is up to 85% plant-derived ethanol, increased exponentially in the US between 2003 and 2008.
(a) Use this information to complete the missing table values.
(b) How many E85-powered vehicles were there in the US in 2003?
(c) By what percent did the number of E85-powered vehicles grow from 2004 to 2008?
![]()
33. Find the future value in 8 years of a $10,000 payment today, if the interest rate is 3% per year compounded continuously.
34. Find the future value in 15 years of a $20,000 payment today, if the interest rate is 3.8% per year compounded continuously.
35. Find the present value of an $8000 payment to be made in 5 years. The interest rate is 4% per year compounded continuously.
36. Find the present value of a $20,000 payment to be made in 10 years. Assume an interest rate of 3.2% per year compounded continuously.
37. Interest is compounded annually. Consider the following choices of payments to you:
Choice 1: $1500 now and $3000 one year from now
Choice 2: $1900 now and $2500 one year from now
(a) If the interest rate on savings were 5% per year, which would you prefer?
(b) Is there an interest rate that would lead you to make a different choice? Explain.
38. The island of Manhattan was sold for $24 in 1626. Suppose the money had been invested in an account which compounded interest continuously.
(a) How much money would be in the account in the year 2012 if the yearly interest rate was
(i) 5%?
(ii) 7%?
(b) If the yearly interest rate was 6%, in what year would the account be worth one billion dollars?
39. (a) Use the Rule of 70 to predict the doubling time of an investment which is earning 8% interest per year.
(b) Find the doubling time exactly, and compare your answer to part (a).
40. A business associate who owes you $3000 offers to pay you $2800 now, or else pay you three yearly installments of $1000 each, with the first installment paid now. If you use only financial reasons to make your decision, which option should you choose? Justify your answer, assuming a 6% interest rate per year, compounded continuously.
41. A person is to be paid $2000 for work done over a year. Three payment options are being considered. Option 1 is to pay the $2000 in full now. Option 2 is to pay $1000 now and $1000 in a year. Option 3 is to pay the full $2000 in a year. Assume an annual interest rate of 5% a year, compounded continuously.
(a) Without doing any calculations, which option is the best option financially for the worker? Explain.
(b) Find the future value, in one year's time, of all three options.
(c) Find the present value of all three options.
42. A company is considering whether to buy a new machine, which costs $97,000. The cash flows (adjusted for taxes and depreciation) that would be generated by the new machine are given in the following table:
![]()
(a) Find the total present value of the cash flows. Treat each year's cash flow as a lump sum at the end of the year and use an interest rate of 7.5% per year, compounded annually.
(b) Based on a comparison of the cost of the machine and the present value of the cash flows, would you recommend purchasing the machine?
43. Big Tree McGee is negotiating his rookie contract with a professional basketball team. They have agreed to a three-year deal which will pay Big Tree a fixed amount at the end of each of the three years, plus a signing bonus at the beginning of his first year. They are still haggling about the amounts and Big Tree must decide between a big signing bonus and fixed payments per year, or a smaller bonus with payments increasing each year. The two options are summarized in the table. All values are payments in millions of dollars.

(a) Big Tree decides to invest all income in stock funds which he expects to grow at a rate of 10% per year, compounded continuously. He would like to choose the contract option which gives him the greater future value at the end of the three years when the last payment is made. Which option should he choose?
(b) Calculate the present value of each contract offer.
44. You win $38,000 in the state lottery to be paid in two installments—$19,000 now and $19,000 one year from now. A friend offers you $36,000 in return for your two lottery payments. Instead of accepting your friend's offer, you take out a one-year loan at an interest rate of 8.25% per year, compounded annually. The loan will be paid back by a single payment of $19,000 (your second lottery check) at the end of the year. Which is better, your friend's offer or the loan?
45. You are considering whether to buy or lease a machine whose purchase price is $12,000. Taxes on the machine will be $580 due in one year, $464 due in two years, and $290 due in three years. If you buy the machine, you expect to be able to sell it after three years for $5,000. If you lease the machine for three years, you make an initial payment of $2650 and then three payments of $2650 at the end of each of the next three years. The leasing company will pay the taxes. The interest rate is 7.75% per year, compounded annually. Should you buy or lease the machine? Explain.
46. You are buying a car that comes with a one-year warranty and are considering whether to purchase an extended warranty for $375. The extended warranty covers the two years immediately after the one-year warranty expires. You estimate that the yearly expenses that would have been covered by the extended warranty are $150 at the end of the first year of the extension and $250 at the end of the second year of the extension. The interest rate is 5% per year, compounded annually. Should you buy the extended warranty? Explain.
1.8 NEW FUNCTIONS FROM OLD
We have studied linear and exponential functions and the logarithm function. In this section, we learn how to create new functions by composing, stretching, and shifting functions we already know.
Composite Functions
A drop of water falls onto a paper towel. The area, A of the circular damp spot is a function of r, its radius, which is a function of time, t. We know A = f(r) = πr2; suppose r = g(t) = t + 1. By substitution, we express A as a function of t:
![]()
The function f(g(t)) is a “function of a function,” or a composite function, in which there is an inside function and an outside function. To find f(g(2)), we first add one (g(2) = 2 + 1 = 3) and then square and multiply by π. We have

The inside function is t + 1 and the outside function is squaring and multiplying by π. In general, the inside function represents the calculation that is done first and the outside function represents the calculation done second.
| Example 1 | If f(t) = t2 and g(t) = t + 2, find
(a) f(t + 1) (b) f(t) + 3 (c) f(t + h) (d) f(g(t)) (e) g(f(t)) |
| Solution | (a) Since t + 1 is the inside function, f(t + 1) = (t + 1)2.
(b) Here 3 is added to f(t), so f(t) + 3 = t2 + 3. (c) Since t + h is the inside function, f (t + h) = (t + h)2. (d) Since g(t) = t + 2, substituting t + 2 into f gives f g(t)) = f (t + 2) = (t + 2)2. (e) Since f(t) = t2, substituting t2 into g gives g(f(t)) = g(t2) = t2 + 2. |
| Example 3 | Using the following table, find g(f(0)), f(g(0)), f(g(1)), and g(f(1)).
|
| Solution | To find g(f(0)), we first find f (0) = 3 from the table. Then we have g(f(0)) = g(3) = 6. For f(g(0)), we must find g(0) first. Since g(0) = 0, we have f(g(0)) = f(0) = 3. Similar reasoning leads to f(g(1)) = f(2) = −1 and g(f(1)) = g(1) = 2. |

We can write a composite function using a new variable u to represent the value of the inside function. For example
![]()
Other expressions for u, such as u = (t + 1)2, with y = u2, are also possible.
| Example 4 | Use a new variable u for the inside function to express each of the following as a composite function:
(a) y = ln(3t) (b) w = 5(2r + 3)2 (c) P = e−0.03t |
| Solution | (a) We take the inside function to be 3t, so y = ln u with u = 3t.
(b) We take the inside function to be 2r + 3, so w = 5u2 with u = 2r + 3. (c) We take the inside function to be −0.03t, so P = eu with u = −0.03t. |
Stretches of Graphs
If the demand function is linear, the graph of a possible revenue function R = f(p) is in Figure 1.72. What does the graph of R = 3f(p) look like? The factor 3 in the function R = 3f(p) stretches each f(p) revenue value by multiplying it by 3. See Figure 1.73. If c is positive, the graph of R = cf(p) is the graph of R = f(p) stretched or shrunk vertically by c units. If c is negative, the function no longer makes sense as a revenue function, but we can still draw the graph. What does the graph of R = −2f(p) look like? The factor −2 in the function R = −2f(p) stretches f(p) by multiplying by 2 and reflecting it about the x-axis. See Figure 1.73.
Multiplying a function by a constant, c, stretches the graph vertically (if c > 1) or shrinks the graph vertically (if 0 < c < 1). A negative sign (if c < 0) reflects the graph about the x-axis, in addition to shrinking or stretching.


Figure 1.73: Multiples of the function f(p)
Shifted Graphs
Consider the function y = x2 + 4. The y-coordinates for this function are exactly 4 units larger than the corresponding y-coordinates of the function y = x2. So the graph of y = x2 + 4 is obtained from the graph of y = x2 by adding 4 to the y-coordinate of each point, that is, by moving the graph of y = x2 up 4 units. (See Figure 1.74.)

Figure 1.74: Vertical shift: Graphs of y = x2 and y = x2 + 4
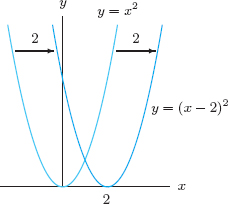
Figure 1.75: Horizontal shift: Graphs of y = x2 and y = (x − 2)2
A graph can also be shifted to the left or to the right. In Figure 1.75, we see that the graph of y = (x − 2)2 is the graph of y = x2 shifted to the right 2 units. In general,
- The graph of y = f(x) + k is the graph of y = f(x) moved up k units (down if k is negative).
- The graph of y = f (x − k) is the graph of y = f(x) moved to the right k units (to the left if k is negative).
| Example 5 | (a) A cost function, C(q), for a company is shown in Figure 1.76. The fixed cost increases by $1000. Sketch a graph of the new cost function.
(b) A supply curve, S, for a product is given in Figure 1.77. A new factory opens and produces 100 units of the product no matter what the price. Sketch a graph of the new supply curve.
|
| Solution | (a) For each quantity, the new cost is $1000 more than the old cost. The new cost function is C(q) + 1000, whose graph is the graph of C(q) shifted vertically up 1000 units. (See Figure 1.78.)
(b) To see the effect of the new factory, look at an example. At a price of 10 dollars, approximately 800 units are currently produced. With the new factory, this amount increases by 100 units, so the new amount produced is 900 units. At each price, the quantity produced increases by 100, so the new supply curve is S shifted horizontally to the right by 100 units. (See Figure 1.79.) |


Figure 1.78: New cost function (original curve dashed)

Problems for Section 1.8
In Problems 1–3, find the following:
(a) f(g(x))
(b) g(f(x))
(c) f(f(x))
1. f(x) = 5x − 1 and g(x) = 3x + 2
2. f(x) = x − 2 and g(x) = x2 + 8
3. f(x) = 3x and g(x) = e2x
4. Let f(x) = x2 and g(x) = 3x −1. Find the following:
(a) f(2) + g(2)
(b) f(2)· g(2)
(c) f(g(2))
(d) g(f(2))
5. For g(x) = x2 + 2x + 3, find and simplify:
(a) g(2 + h)
(b) g(2)
(c) g(2 + h)−g(2)
6. If f(x) = x2 + 1, find and simplify:
(a) f(t + 1)
(b) f(t2 + 1)
(c) f(2)
(d) 2f(t)
(e) (f(t))2 + 1
For the functions f and g in Problems 7–10, find
(a) f(g(1))
(b) g(f(1))
(c) f(g(x))
(d) g(f(x))
(e) f(t)g(t)
7. f(x) = x 2, g(x) = x + 1
8. ![]()
9. f(x) = ex, g(x)= x2
10. f(x) = 1/x,g(x) = 3x + 4
11. Use Table 1.37 to find:
(a) f(g(1))
(b) g(f(1))
(c) f(g(4))
(d) g(f(4))
(e) f(g(6))
(f) g(f(6))

12. Use Table 1.38 to find:
(a) f(g(0))
(b) f(g(1))
(c) f(g(2))
(d) g(f(2))
(e) g(f(3))

13. Make a table of values for each of the following functions using Table 1.38:
(a) f(x) + 3
(b) f(x − 2)
(c) 5g(x)
(d) −f(x) + 2
(e) g(x − 3)
(f) f(x) + g(x)
14. Use the variable u for the inside function to express each of the following as a composite function:
(a) y = (5t2 − 2)6
(b) P = 12e−0.6t
(c) C = 12 ln(q3 + 1)
15. Use the variable u for the inside function to express each of the following as a composite function:
(a) y = 23x−1
(b) ![]()
(c) w = 2 ln(3r + 4)
Simplify the quantities in Problems 16–19 using m(z) = z2.
16. m(z + 1) − m(z)
17. m(z + h) − m(z)
18. m(z) − m(z − h)
19. m(z + h) − m(z − h)
For Problems 20–25, use the graphs in Figure 1.80.

20. Estimate f(g(1)).
21. Estimate g(f(1)).
22. Estimate f(g(4)).
23. Estimate g(f(4)).
24. Estimate f(f(2)).
25. Estimate g(g(2)).
For Problems 26–29, use the graphs in Figure 1.81.

26. Estimate f(g(1)).
27. Estimate g(f(2)).
28. Estimate f(f(1)).
29. Estimate f(g(3)).
30. Using Table 1.39, create a table of values for f(g(x)) and for g(f(x)).

31. A tree of height y meters has, on average, B branches, where B = y − 1. Each branch has, on average, n leaves, where n = 2B2 − B. Find the average number of leaves on a tree as a function of height.
In Problems 32–35, use Figure 1.82 to estimate the function value or explain why it cannot be done.

32. u(v(10))
33. u(v(40))
34. v(u(10))
35. v(u(40))
36. The Heaviside step function, H, is graphed in Figure 1.83. Graph the following functions.
(a) 2H(x)
(b) H(x + 1)
(c) H(x + 1)
(d) −H(x)
(e) H(−x)

In Problems 37–42, use Figure 1.84 to graph the function.

37. y = f(x) + 1
38. y = f(x − 2)
39. y = 3f(x)
40. y = f(x + 1) − 2
41. y = −f(x) + 3
42. y = −2f(x − 1)
For the functions f in Problems 43–45, graph:
(a) f(x + 2)
(b) f(x − 1)
(c) f(x) − 4
(d) f(x + 1) + 3
(e) 3f(x)
(f) −f(x) + 1
43.

44.

45.
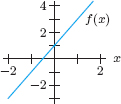
In Problems 46–51, use Figure 1.85 to graph the function.

46. y = f(x) + 2
47. y = 2f(x)
48. y = f(x − 1)
49. y = −3f(x)
50. y = 2f(x) − 1
51. y = 2−f(x)
52. Morphine, a pain-relieving drug, is administered to a patient intravenously starting at 8 am. The drug saturation curve Q = f(t) in Figure 1.86 gives the quantity, Q, of morphine in the blood t hours after 8 am.
(a) Draw the drug saturation curve Q = g(t) if the IV line is started at noon instead of 8 am.
(b) Is g one of the following transformations of f: vertical shift, vertical stretch, horizontal shift, horizontal stretch? If so, which?
(c) Write g(t) in terms of the function f.

53. (a) Write an equation for a graph obtained by vertically stretching the graph of y = x2 by a factor of 2, followed by a vertical upward shift of 1 unit. Sketch it.
(b) What is the equation if the order of the transformations (stretching and shifting) in part (a) is interchanged?
(c) Are the two graphs the same? Explain the effect of reversing the order of transformations.
In Problems 54–57 the functions r = f(t) and V = g(r) give the radius and the volume of a commercial hot air balloon being inflated for testing. The variable t is in minutes, r is in feet, and V is in cubic feet. The inflation begins at t = 0. In each case, give a mathematical expression that represents the given statement.
54. The volume of the balloon t minutes after inflation began.
55. The volume of the balloon if its radius were twice as big.
56. The time that has elapsed when the radius of the balloon is 30 feet.
57. The time that has elapsed when the volume of the balloon is 10,000 cubic feet.
1.9 PROPORTIONALITY AND POWER FUNCTIONS
Proportionality
A common functional relationship occurs when one quantity is proportional to another. For example, if apples are $1.40 a pound, we say the price you pay, p dollars, is proportional to the weight you buy, w pounds, because
![]()
As another example, the area, A, of a circle is proportional to the square of the radius, r:
![]()
We say y is (directly) proportional to x if there is a nonzero constant k such that
![]()
This k is called the constant of proportionality.
We also say that one quantity is inversely proportional to another if one is proportional to the reciprocal of the other. For example, the speed, v, at which you make a 50-mile trip is inversely proportional to the time, t, taken, because v is proportional to 1/t:
![]()
Notice that if y is directly proportional to x, then the magnitude of one variable increases (decreases) when the magnitude of the other increases (decreases). If, however, y is inversely proportional to x, then the magnitude of one variable increases when the magnitude of the other decreases.
| Example 1 | The heart mass of a mammal is proportional to its body mass.83
(a) Write a formula for heart mass, H, as a function of body mass, B. (b) A human with a body mass of 70 kilograms has a heart mass of 0.42 kilograms. Use this information to find the constant of proportionality. (c) Estimate the heart mass of a horse with a body mass of 650 kg. |
| Solution | (a) Since H is proportional to B, for some constant k, we have
(b) We use the fact that H = 0.42 when B = 70 to solve for k:
(c) Since k = 0.006, we have H = 0.006 B, so the heart mass of the horse is given by
|

| Example 2 | The period of a pendulum, T, is the amount of time required for the pendulum to make one complete swing. For small swings, the period, T, is approximately proportional to the square root of l, the pendulum's length. So
Notice that T is not directly proportional to l, but T is proportional to |
| Example 3 | An object's weight, w, is inversely proportional to the square of its distance, r, from the earth's center. So, for some constant k,
Here w is not inversely proportional to r, but to r2. |
Power Functions
In each of the previous examples, one quantity is proportional to the power of another quantity. We make the following definition:
We say that Q(x) is a power function of x if Q(x) is proportional to a constant power of x. If k is the constant of proportionality, and if p is the power, then
![]()
For example, the function H = 0.006B is a power function with p = 1. The function T = ![]() is a power function with p = 1/2, and the function w = k/r2 = kr−2 is a power function with p = −2.
is a power function with p = 1/2, and the function w = k/r2 = kr−2 is a power function with p = −2.
| Example 4 | Which of the following are power functions? For those which are, write the function in the form y = kxp, and give the coefficient k and the exponent p.
|
| Solution | (a) Since y = 5x−3, this is a power function with k = 5 and p = −3.
(b) Since y = (2/3)x−1, this is a power function with k = 2/3 and p = −1. (c) Since y = (5/2)x2, this is a power function with k = 5/2 = 2.5 and p = 2. (d) This is not a power function. It is an exponential function. (e) Since y = 3x1/2, this is a power function with k = 3 and p = 1/2. (f) Since y = 33 · (x2)3 = 27x6, this is a power function with k = 27 and p = 6. |

Graphs of Power Functions
The graph of y = x2 is shown in Figure 1.87. It is decreasing for negative x and increasing for positive x. Notice that it is bending upward, or concave up, for all x. The graph of y = x3 is shown in Figure 1.88. Notice that it is bending downward, or concave down for negative x and bending upward, or concave up for positive x. The graph of ![]() is shown in Figure 1.89. Notice that the graph is increasing and concave down.
is shown in Figure 1.89. Notice that the graph is increasing and concave down.
Since x2 increases without bound as x increases, we often say that it tends to infinity as x approaches infinity, which we write in symbols as
![]()
Since x3 decreases without bound as x decreases, we write
![]()


Figure 1.89: Graph of y = x1/2
| Example 5 | If N is the average number of species found on an island and A is the area of the island, observations have shown84 that N is approximately proportional to the cube root of A. Write a formula for N as a function of A and describe the shape of the graph of this function. |
| Solution | For some positive constant k, we have
Figure 1.90: Graphs of negative powers of x It turns out that the value of k depends on the region of the world in which the island is found. The graph of N against A (for A > 0) has a shape similar to the graph in Figure 1.89. It is increasing and concave down. Thus, larger islands have more species on them (as we would expect), but the increase slows as the island gets larger. |

The function y = x0 = 1 has a graph that is a horizontal line. For negative powers, rewriting
![]()
makes it clear that as x > 0 increases, the denominators increase and the functions decrease. The graphs of y = x−1 and y = x−2 have both the x and y-axes as asymptotes. (See Figure 1.90.)
Quadratic Functions and Polynomials
Sums of power functions with nonnegative integer exponents are called polynomials, which are functions of the form
![]()
Here, n is a nonnegative integer, called the degree of the polynomial, and an is a nonzero number called the leading coefficient. We call anxn the leading term.
If n = 2, the polynomial is called quadratic and has the form ax2 + bx + c with a ≠ 0. The graph of a quadratic polynomial is a parabola. It opens up if the leading coefficient a is positive and opens down if a is negative.
| Example 6 | A company finds that the average number of people attending a concert is 75 if the price is $50 per person. At a price of $35 per person, the average number of people in attendance is 120.
(a) Assume that the demand curve is a line. Write the demand, q, as a function of price, p. (b) Use your answer to part (a) to write the revenue, R, as a function of price, p. (c) Use a graph of the revenue function to determine what price should be charged to obtain the greatest revenue. |
| Solution | (a) Two points on the line are (p, q) = (50, 75) and (p, q) = (35, 120). The slope of the line is
To find the vertical intercept of the line, we use the slope and one of the points:
The demand function is q = 225 − 3p. (b) Since R = pq and q = 225 − 3p, we see that R = p(225 − 3p) = 225p − 3p2. (c) The revenue function is the quadratic polynomial graphed in Figure 1.91. The maximum revenue occurs at p = 37.5. Thus, the company maximizes revenue by charging $37.50 per person.
|

Problems for Section 1.9
In Problems 1–12, determine whether or not the function is a power function. If it is a power function, write it in the form y = kxp and give the values of k and p.
1. ![]()
2. ![]()
3. ![]()
4. ![]()
5. ![]()
6. ![]()
7. y = (3x5)2
8. ![]()
9. y = 3 · 5x
10. ![]()
11. y = (5x)3
12. y = 3x2 + 4
In Problems 13–16, write a formula representing the function.
13. The strength, S, of a beam is proportional to the square of its thickness, h.
14. The energy, E, expended by a swimming dolphin is proportional to the cube of the speed, v, of the dolphin.
15. The average velocity, v, for a trip over a fixed distance, d, is inversely proportional to the time of travel, t.
16. The gravitational force, F, between two bodies is inversely proportional to the square of the distance d between them.
17. Use shifts of power functions to find a possible formula for each of the graphs:
(a)

(b)

18. The surface area of a mammal, S, satisfies the equation S = kM2/3, where M is the body mass, and the constant of proportionality k depends on the body shape of the mammal. A human of body mass 70 kilograms has surface area 18,600 cm2. Find the constant of proportionality for humans. Find the surface area of a human with body mass 60 kilograms.
19. The number of species of lizards, N, found on an island off Baja California is proportional to the fourth root of the area, A, of the island.85 Write a formula for N as a function of A. Graph this function. Is it increasing or decreasing? Is the graph concave up or concave down? What does this tell you about lizards and island area?
20. The blood mass of a mammal is proportional to its body mass. A rhinoceros with body mass 3000 kilograms has blood mass of 150 kilograms. Find a formula for the blood mass of a mammal as a function of the body mass and estimate the blood mass of a human with body mass 70 kilograms.
21. Kleiber's Law states that the metabolic needs (such as calorie requirements) of a mammal are proportional to its body weight raised to the 0.75 power.86 Surprisingly, the daily diets of mammals conform to this relation well. Assuming Kleiber's Law holds:
(a) Write a formula for C, daily calorie consumption, as a function of body weight, W.
(b) Sketch a graph of this function. (You do not need scales on the axes.)
(c) If a human weighing 150 pounds needs to consume 1800 calories a day, estimate the daily calorie requirement of a horse weighing 700 lbs and of a rabbit weighing 9 lbs.
(d) On a per-pound basis, which animal requires more calories: a mouse or an elephant?
22. Allometry is the study of the relative size of different parts of a body as a consequence of growth. In this problem, you will check the accuracy of an allometric equation: the weight of a fish is proportional to the cube of its length.87 Table 1.40 relates the weight, y, in gm, of plaice (a type of fish) to its length, x, in cm. Does this data support the hypothesis that (approximately) y = kx3? If so, estimate the constant of proportionality, k.

23. Biologists estimate that the number of animal species of a certain body length is inversely proportional to the square of the body length.88 Write a formula for the number of animal species, N, of a certain body length as a function of the length, L. Are there more species at large lengths or at small lengths? Explain.
24. The specific heat, s, of an element is the number of calories of heat required to raise the temperature of one gram of the element by one degree Celsius. Use the following table to decide if s is proportional or inversely proportional to the atomic weight, w, of the element. If so, find the constant of proportionality.
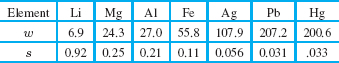
25. The circulation time of a mammal (that is, the average time it takes for all the blood in the body to circulate once and return to the heart) is proportional to the fourth root of the body mass of the mammal.
(a) Write a formula for the circulation time, T, in terms of the body mass, B.
(b) If an elephant of body mass 5230 kilograms has a circulation time of 148 seconds, find the constant of proportionality.
(c) What is the circulation time of a human with body mass 70 kilograms?
26. Zipf's Law, developed by George Zipf in 1949, states that in a given country, the population of a city is inversely proportional to the city's rank by size in the country.89 Assuming Zipf's Law:
(a) Write a formula for the population, P, of a city as a function of its rank, R.
(b) If the constant of proportionality k is 300,000, what is the approximate population of the largest city (rank 1)? The second largest city (rank 2)? The third largest city?
(c) Answer the questions of part (b) if k = 6 million.
(d) Interpret the meaning of the constant of proportionality k in this context.
27. The infrastructure needs of a region (for example, the number of miles of electrical cable, the number of miles of roads, the number of gas stations) depend on its population. Cities enjoy economies of scale.90 For example, the number of gas stations is proportional to the population raised to the power of 0.77.
(a) Write a formula for the number, N, of gas stations in a city as a function of the population, P, of the city.
(b) If city A is 10 times bigger than city B, how do their number of gas stations compare?
(c) Which is expected to have more gas stations per person, a town of 10,000 people or a city of 500,000 people?
28. According to the National Association of Realtors,91 the minimum annual gross income, m, in thousands of dollars, needed to obtain a 30-year home loan of A thousand dollars at 9% is given in Table 1.41. Note that the larger the loan, the greater the income needed. Of course, not every mortgage is financed at 9%. In fact, excepting for slight variations, mortgage interest rates are generally determined not by individual banks but by the economy as a whole. The minimum annual gross income, m, in thousands of dollars, needed for a home loan of $100,000 at various interest rates, r, is given in Table 1.42. Note that obtaining a loan at a time when interest rates are high requires a larger income.
(a) Is the size of the loan, A, proportional to the minimum annual gross income, m?
(b) Is the percentage rate, r, proportional to the minimum annual gross income, m?
29. A sporting goods wholesaler finds that when the price of a product is $25, the company sells 500 units per week. When the price is $30, the number sold per week decreases to 460 units.
(a) Find the demand, q, as a function of price, p, assuming that the demand curve is linear.
(b) Use your answer to part (a) to write revenue as a function of price.
(c) Graph the revenue function in part (b). Find the price that maximizes revenue. What is the revenue at this price?
30. A health club has cost and revenue functions given by C = 10,000 + 35q and R = pq, where q is the number of annual club members and p is the price of a one-year membership. The demand function for the club is q = 3000 − 20p.
(a) Use the demand function to write cost and revenue as functions of p.
(b) Graph cost and revenue as a function of p, on the same axes. (Note that price does not go above $170 and that the annual costs of running the club reach $120,000.)
(c) Explain why the graph of the revenue function has the shape it does.
(d) For what prices does the club make a profit?
(e) Estimate the annual membership fee that maximizes profit. Mark this point on your graph.
1.10 PERIODIC FUNCTIONS
What Are Periodic Functions?
Many functions have graphs that oscillate, resembling a wave. Figure 1.92 shows the number of new housing construction starts (one-family units) in the US, 2002–2005, where t is time in quarter-years.92 Notice that few new homes begin construction during the first quarter of a year (January, February, and March), whereas many new homes are begun in the second quarter (April, May, and June). Since 2008, as the economy has slowed, the pattern of oscillations has been replaced by a sharp drop in housing construction.

Figure 1.92: New housing construction starts, 2002–2005

Figure 1.93: Temperature in Phoenix after midnight February 17, 2005
Let's look at another example. Figure 1.93 is a graph of the temperature (in °C) in Phoenix, AZ, in hours after midnight, February 17, 2005. Notice that the maximum is in the afternoon and the minimum is in the early morning.93 Again, the graph looks like a wave.
Functions whose values repeat at regular intervals are called periodic. Many processes, such as the number of housing starts or the temperature, are approximately periodic. The water level in a tidal basin, the blood pressure in a heart, retail sales in the US, and the position of air molecules transmitting a musical note are also all periodic functions of time.
Amplitude and Period
Periodic functions repeat exactly the same cycle forever. If we know one cycle of the graph, we know the entire graph.
For any periodic function of time:
- The amplitude is half the difference between its maximum and minimum values.
- The period is the time for the function to execute one complete cycle.
| Example 1 | Estimate the amplitude and period of the new housing starts function shown in Figure 1.92. |
| Solution | Figure 1.92 is not exactly periodic, since the maximum and minimum are not the same for each cycle. Nonetheless, the minimum is about 300, and the maximum is about 450. The difference between them is 150, so the amplitude is about The wave completes a cycle between t = 1 and t = 5, so the period is t = 4 quarter-years, or one year. The business cycle for new housing construction is one year. |
| Example 2 | Figure 1.94 shows the temperature in an unopened freezer. Estimate the temperature in the freezer at 12:30 and at 2:45.
Figure 1.94: Oscillating freezer temperature. Estimate the temperature at 12:30 and 2:45 |
| Solution | The maximum and minimum values each occur every 25 minutes, so the period is 25 minutes. The temperature at 12:30 should be the same as at 12:55 and at 1:20, namely, 2°F. Similarly, the temperature at 2:45 should be the same as at 2:20 and 1:55, or about −1.5°F. |

The Sine and Cosine
Many periodic functions are represented using the functions called sine and cosine. The keys for the sine and cosine on a calculator are usually labeled as ![]() and
and ![]() .
.
Warning: Your calculator can be in either “degree” mode or “radian” mode. For this book, always use “radian” mode.
Graphs of the Sine and Cosine
The graphs of the sine and the cosine functions are periodic; see Figures 1.95 and 1.96. Notice that the graph of the cosine function is the graph of the sine function, shifted π/2 to the left.

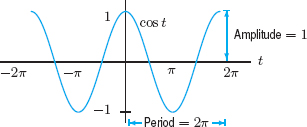
The maximum and minimum values of sin t are + 1 and −1, so the amplitude of the sine function is 1. The graph of y = sin t completes a cycle between t = 0 and t = 2π; the rest of the graph repeats this portion. The period of the sine function is 2π.
| Example 3 | Use a graph of y = 3 sin 2t to estimate the amplitude and period of this function. |
| Solution | In Figure 1.97, the waves have a maximum of + 3 and a minimum of −3, so the amplitude is 3. The graph completes one complete cycle between t = 0 and t = π, so the period is π.
|

| Example 4 | Explain how the graphs of each of the following functions differ from the graph of y = sin t.
(a) y = 6 sin t (b) y = 5 + sin t (c) |
| Solution | (a) The graph of y = 6 sin t is in Figure 1.98. The maximum and minimum values are +6 and −6, so the amplitude is 6. This is the graph of y = sin t stretched vertically by a factor of 6.
(b) The graph of y = 5 + sin t is in Figure 1.99. The maximum and minimum values of this function are 6 and 4, so the amplitude is (6 − 4)/2 = 1. The amplitude (or size of the wave) is the same as for y = sin t, since this is a graph of y = sin t shifted up 5 units. (c) The graph of y = sin(t + π/2) is in Figure 1.100. This has the same amplitude, namely 1, and period, namely 2π, as the graph of y = sin t. It is the graph of y = sin t shifted π/2 units to the left. (In fact, this is the graph of y = cos t.)
Figure 1.98: Graph of y = 6 sin t
Figure 1.99: Graph of y = 5 + sin t
|


Families of Curves: The Graph of y = A sin(Bt)
The constants A and B in the expression y = A sin(Bt) are called parameters. We can study families of curves by varying one parameter at a time and studying the result.
| Example 5 | (a) Graph y = A sin t for several positive values of A. Describe the effect of A on the graph.
(b) Graph y = sin(Bt) for several positive values of B. Describe the effect of B on the graph. |
| Solution | (a) From the graphs of y = A sin t for A = 1, 2, 3 in Figure 1.101, we see that A is the amplitude.
Figure 1.101: Graphs of y = A sin t with A = 1, 2, 3 (b) The graphs of y = sin(Bt) for B =
|


In Example 5, the amplitude of y = A sin (Bt) was determined by the parameter A, and the period was determined by the parameter B. In general, we have
The functions y = A sin(Bt) + C and y = A cos (Bt) + C are periodic with
![]()
| Example 6 | Find possible formulas for the following periodic functions.
|
| Solution | (a) This function looks like a sine function of amplitude 3, so g(t) = 3 sin(Bt). Since the function executes one full oscillation between t = 0 and t = 12π, when t changes by 12π, the quantity Bt changes by 2π. This means B · 12π = 2π, so B = 1/6. Therefore, g(t) = 3sin(t/6) has the graph shown.
(b) This function looks like an upside-down cosine function with amplitude 2, so f(t) = −2cos(Bt). The function completes one oscillation between t = 0 and t = 4. Thus, when t changes by 4, the quantity Bt changes by 2π, so B · 4 = 2π, or B = π/2. Therefore, f(t) = −2cos(πt/2) has the graph shown. (c) This function looks like a cosine function. The maximum is 700 and the minimum is 300, so the amplitude is |
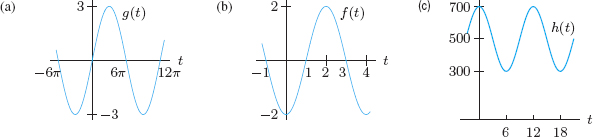
| Example 7 | On June 23, 2009, high tide in Portland, Maine was at midnight.94 The height of the water in the harbor is a periodic function, since it oscillates between high and low tide. If t is in hours since midnight, the height (in feet) is approximated by the formula
(a) Graph this function from t = 0 to t = 24. (b) What was the water level at high tide? (c) When was low tide, and what was the water level at that time? (d) What is the period of this function, and what does it represent in terms of tides? (e) What is the amplitude of this function, and what does it represent in terms of tides? |
| Solution | (a) See Figure 1.103.
(b) The water level at high tide was 9.3 feet (given by the y-intercept on the graph). (c) Low tide occurs at t = 6 (6 am) and at t = 18 (6 pm). The water level at this time is 0.5 feet. (d) The period is 12 hours and represents the interval between successive high tides or successive low tides. Of course, there is something wrong with the assumption in the model that the period is 12 hours. If so, the high tide would always be at noon or midnight, instead of progressing slowly through the day, as it in fact does. The interval between successive high tides actually averages about 12 hours 39 minutes, which could be taken into account in a more precise mathematical model. (e) The maximum is 9.3, and the minimum is 0.5, so the amplitude is (9.3 − 0.5)/2, which is 4.4 feet. This represents half the difference between the depths at high and low tide.
Figure 1.103: Graph of the function approximating the depth of the water in Portland, Maine on June 23, 2009 |

Problems for Section 1.10
In Problems 1–6, graph the function. What is the amplitude and period?
1. y = 3 sin x
2. y = 4 cos 2x
3. y = −3sin 2θ
4. y = 3sin 2x
5. y = 5 − sin 2t
6. y = 4 cos![]()
7. Figure 1.104 shows quarterly beer production during the period 1997 to 1999. Quarter 1 reflects production during the first three months of the year, etc.95
(a) Explain why a periodic function should be used to model these data.
(b) Approximately when does the maximum occur? The minimum? Why does this make sense?
(c) What are the period and amplitude for these data?

8. Sketch a possible graph of sales of sunscreen in the north-eastern US over a 3-year period, as a function of months since January 1 of the first year. Explain why your graph should be periodic. What is the period?
9. The following table shows values of a periodic function f(x). The maximum value attained by the function is 5.
(a) What is the amplitude of this function?
(b) What is the period of this function?
(c) Find a formula for this periodic function.
![]()
10. A person breathes in and out every three seconds. The volume of air in the person's lungs varies between a minimum of 2 liters and a maximum of 4 liters. Which of the following is the best formula for the volume of air in the person's lungs as a function of time?
(a) ![]()
(b) ![]()
(c) ![]()
(d) ![]()
11. Values of a function are given in the following table. Explain why this function appears to be periodic. Approximately what are the period and amplitude of the function? Assuming that the function is periodic, estimate its value at t = 15, at t = 75, and at t = 135.
![]()
12. Average daily high temperatures in Ottawa, the capital of Canada, range from a low of −6° Celsius on January 1 to a high of 26° Celsius on July 1 six months later. See Figure 1.105. Find a formula for H, the average daily high temperature in Ottawa in, °C, as a function of t, the number of months since January 1.

13. Figure 1.106 shows the levels of the hormones estrogen and progesterone during the monthly ovarian cycles in females.96 Is the level of both hormones periodic? What is the period in each case? Approximately when in the monthly cycle is estrogen at a peak? Approximately when in the monthly cycle is progesterone at a peak?
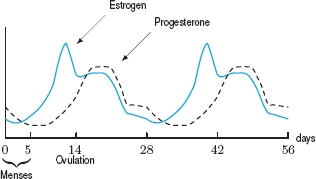
14. Delta Cephei is one of the most visible stars in the night sky. Its brightness has periods of 5.4 days, the average brightness is 4.0 and its brightness varies by ±0.35. Find a formula that models the brightness of Delta Cephei as a function of time, t, with t = 0 at peak brightness.
15. Most breeding birds in the northeast US migrate elsewhere during the winter. The number of bird species in an Ohio forest preserve oscillates between a high of 28 in June and a low of 10 in December.97
(a) Graph the number of bird species in this preserve as a function of t, the number of months since June. Include at least three years on your graph.
(b) What are the amplitude and period of this function?
(c) Find a formula for the number of bird species, B, as a function of the number of months, t since June.
In Problems 16–27, find a possible formula for the graph.
16.

17.

18.

19.


21.

22.

23.

24.

25.
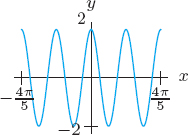
26.

27.

28. The Bay of Fundy in Canada has the largest tides in the world. The difference between low and high water levels is 15 meters (nearly 50 feet). At a particular point the depth of the water, y meters, is given as a function of time, t, in hours since midnight by
![]()
(a) What is the physical meaning of D?
(b) What is the value of A?
(c) What is the value of B? Assume the time between successive high tides is 12.4 hours.
(d) What is the physical meaning of C?
29. The depth of water in a tank oscillates once every 6 hours. If the smallest depth is 5.5 feet and the largest depth is 8.5 feet, find a possible formula for the depth in terms of time in hours.
30. The desert temperature, H, oscillates daily between 40°F at 5 am and 80°F at 5 pm. Write a possible formula for H in terms of t, measured in hours from 5 am.
31. Table 1.43 gives values for g(t), a periodic function.
(a) Estimate the period and amplitude for this function.
(b) Estimate g(34) and g(60).
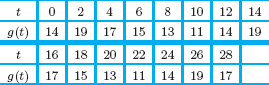
32. In Figure 1.107, the blue curve shows monthly mean carbon dioxide (CO2) concentration, in parts per million (ppm) at Mauna Loa Observatory, Hawaii, as a function of t, in months, since December 2005. The black curve shows the monthly mean concentration adjusted for seasonal CO2 variation.98
(a) Approximately how much did the monthly mean CO2 increase between December 2005 and December 2010?
(b) Find the average monthly rate of increase of the monthly mean CO2 between December 2005 and December 2010. Use this information to find a linear function that approximates the black curve.
(c) The seasonal CO2 variation between December 2005 and December 2010 can be approximated by a sinusoidal function of the form A sin Bt. What is the approximate period of the function? What is its amplitude? Give a formula for the function.
(d) The blue curve may be approximated by a function of the form h(t) = f(t) + g(t), where f(t) is sinusoidal and g(t) is linear. Using your work in parts (b) and (c), find a possible formula for h(t). Graph h(t) using the scale in Figure 1.107.

CHAPTER SUMMARY
- Function terminology
Domain/range, increasing/decreasing, concavity, intercepts.
- Linear functions
Slope, y-intercept. Grow by equal amounts in equal times.
- Economic applications
Cost, revenue, and profit functions, break-even point. Supply and demand curves, equilibrium point. Depreciation function. Budget constraint. Present and future value.
- Change, average rate of change, relative change
- Exponential functions
Exponential growth and decay, growth rate, the number e, continuous growth rate, doubling time, half-life, compound interest. Grow by equal percentages in equal times.
- The natural logarithm function
- New functions from old
Composition, shifting, stretching.
- Power functions and proportionality
- Polynomials
- Periodic functions
Sine, cosine, amplitude, period.
REVIEW PROBLEMS FOR CHAPTER ONE
1. The population of a city, P, in millions, is a function of t, the number of years since 1970, so P = f(t). Explain the meaning of the statement f(35) = 12 in terms of the population of this city.
2. The time T, in minutes, that it takes Dan to run x kilometers is a function T = f(x). Explain the meaning of the statement f(5) = 23 in terms of running.
3. Describe what Figure 1.108 tells you about an assembly line whose productivity is represented as a function of the number of workers on the line.

4. It warmed up throughout the morning, and then suddenly got much cooler around noon, when a storm came through. After the storm, it warmed up before cooling off at sunset. Sketch temperature as a function of time.
5. A gas tank 6 meters underground springs a leak. Gas seeps out and contaminates the soil around it. Graph the amount of contamination as a function of the depth (in meters) below ground.
6. You drive at a constant speed from Chicago to Detroit, a distance of 275 miles. About 120 miles from Chicago you pass through Kalamazoo, Michigan. Sketch a graph of your distance from Kalamazoo as a function of time.
7. The graphs in Figure 1.109 represent the temperature, H, of four loaves of bread each put into an oven at time t = 0.
(a) Which curve corresponds to the bread that was put into the hottest oven?
(b) Which curve corresponds to the bread that had the lowest temperature at the time that it was put into the oven?
(c) Which two curves correspond to loaves of bread that were at the same temperature when they were put into the oven?
(d) Write a sentence describing any differences between the curves shown in (II) and (III). In terms of bread, what might cause this difference?

Find the equation of the line passing through the points in Problems 8–11.
8. (0, −1) and (2, 3)
9. (−1, 3) and (2, 2)
10. (0, 2) and (2, 2)
11. (−1, 3) and (−1, 4)
12. Match the graphs in Figure 1.110 with the following equations. (Note that the x and y scales may be unequal.)
(a) y = x − 5
(b) −3x + 4 = y
(c) 5 = y
(d) y = −4x − 5
(e) y = x + 6
(f) y = x/2

13. Find a linear function that generates the values in Table 1.44.
14. Residents of the town of Maple Grove who are connected to the municipal water supply are billed a fixed amount monthly plus a charge for each cubic foot of water used. A household using 1000 cubic feet was billed $40, while one using 1600 cubic feet was billed $55.
(a) What is the charge per cubic foot?
(b) Write an equation for the total cost of a resident's water as a function of cubic feet of water used.
(c) How many cubic feet of water used would lead to a bill of $100?
15. A controversial 1992 Danish study99 reported that men's average sperm count decreased from 113 million per milliliter in 1940 to 66 million per milliliter in 1990.
(a) Express the average sperm count, S, as a linear function of the number of years, t, since 1940.
(b) A man's fertility is affected if his sperm count drops below about 20 million per milliliter. If the linear model found in part (a) is accurate, in what year will the average male sperm count fall below this level?
16. Let y = f(x) = 3x − 5.
(a) What is f(1)?
(b) Find the value of y when x is 5.
(c) Find the value of x when y is 4.
(d) Find the average rate of change of f between x = 2 and x = 4.
In Problems 17–22, find the average velocity for the position function s(t), in mm, over the interval 1 ≤ t ≤ 3, where t is in seconds.
17. s(t) = 12t − t2
18. s(t) = ln(t)
19.

20.

21.

22.

23. The yield, Y, of an apple orchard (in bushels) as a function of the amount, a, of fertilizer (in pounds) used on the orchard is shown in Figure 1.111.
(a) Describe the effect of the amount of fertilizer on the yield of the orchard.
(b) What is the vertical intercept? Explain what it means in terms of apples and fertilizer.
(c) What is the horizontal intercept? Explain what it means in terms of apples and fertilizer.
(d) What is the range of this function for 0 ≤ a ≤ 80?
(e) Is the function increasing or decreasing at a = 60?
(f) Is the graph concave up or down near a = 40?

24. Sketch reasonable graphs for the following. Pay particular attention to the concavity of the graphs.
(a) The total revenue generated by a car rental business, plotted against the amount spent on advertising.
(b) The temperature of a cup of hot coffee standing in a room, plotted as a function of time.
25. Each of the functions g, h, k in Table 1.45 is increasing, but each increases in a different way. Which of the graphs in Figure 1.112 best fits each function?


26. When a new product is advertised, more and more people try it. However, the rate at which new people try it slows as time goes on.
(a) Graph the total number of people who have tried such a product against time.
(b) What do you know about the concavity of the graph?
27. Figure 1.113 shows the age-adjusted death rates from different types of cancer among US males.100
(a) Discuss how the death rate has changed for the different types of cancers.
(b) For which type of cancer has the average rate of change between 1930 and 1967 been the largest? Estimate the average rate of change for this cancer type. Interpret your answer.
(c) For which type of cancer has the average rate of change between 1930 and 1967 been the most negative? Estimate the average rate of change for this cancer type. Interpret your answer.

28. Find the average rate of change between x = 0 and x = 10 of each of the following functions: y = x, y = x2, y = x3, and y = x4. Which has the largest average rate of change? Graph the four functions, and draw lines whose slopes represent these average rates of change.
29. The volume of water in a pond over a period of 20 weeks is shown in Figure 1.114.
(a) Is the average rate of change of volume positive or negative over the following intervals?
(i) t = 0 and t = 5
(ii) t = 0 and t = 10
(iii) t = 0 and t = 15
(iv) t = 0 and t = 20
(b) During which of the following time intervals was the average rate of change larger?
(i) 0 ≤ t ≤ 5 or 0 ≤ t ≤ 10
(ii) 0 ≤ t ≤ 10 or 0 ≤ t ≤ 20
(c) Estimate the average rate of change between t = 0 and t = 10. Interpret your answer in terms of water.

30. (a) What are the fixed costs and the marginal cost for the cost function in Figure 1.115?
(b) Explain what C(100) = 2500 tells you about costs.

31. The Quick-Food company provides a college meal-service plan. Quick-Food has fixed costs of $350,000 per term and variable costs of $400 per student. Quick-Food charges $800 per student per term. How many students must sign up with the Quick-Food plan in order for the company to make a profit?
32. For tax purposes, you may have to report the value of your assets, such as cars or refrigerators. The value you report drops with time. “Straight-line depreciation” assumes that the value is a linear function of time. If a $950 refrigerator depreciates completely in seven years, find a formula for its value as a function of time.
33. One of the graphs in Figure 1.116 is a supply curve, and the other is a demand curve. Which is which? Explain how you made your decision using what you know about the effect of price on supply and demand.

34. Figure 1.117 shows supply and demand curves.
(a) What is the equilibrium price for this product? At this price, what quantity is produced?
(b) Choose a price above the equilibrium price—for example, p = 300. At this price, how many items are suppliers willing to produce? How many items do consumers want to buy? Use your answers to these questions to explain why, if prices are above the equilibrium price, the market tends to push prices lower (toward the equilibrium).
(c) Now choose a price below the equilibrium price—for example, p = 200. At this price, how many items are suppliers willing to produce? How many items do consumers want to buy? Use your answers to these questions to explain why, if prices are below the equilibrium price, the market tends to push prices higher (toward the equilibrium).

Find possible formulas for the graphs in Problems 35–40.
35.

36.
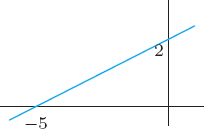
37.

38.

39.

40.

41. Table 1.46 gives values for three functions. Which functions could be linear? Which could be exponential? Which are neither? For those which could be linear or exponential, give a possible formula for the function.

42. The worldwide carbon dioxide emission101, C, from consumption of fossil fuels was 22.0 billion tons in 1995 and 28.2 billion tons in 2005. Find a formula for the emission C in t years after 1995 if:
(a) C is a linear function of t. What is the annual rate of increase in carbon dioxide emission?
(b) C is an exponential function of t. What is the annual percent rate of increase in carbon dioxide emission?
43. The population of a region is growing exponentially. There were 40,000,000 people in 2000 (t = 0) and 48,000,000 in 2010. Find an expression for the population at any time t, in years. What population would you predict for the year 2020? What is the doubling time?
For Problems 44–47, solve for x using logs.
44. 3x = 11
45. 20 = 50(1.04)x
46. e5x = 100
47. 25e3x = 10
48. Write the exponential functions P = e0.08t and Q = e−0.3t in the form P = at and Q = bt.
49. (a) What is the continuous percent growth rate for the function P = 10e0.15t?
(b) Write this function in the form P = P0at.
(c) What is the annual (not continuous) percent growth rate for this function?
(d) Graph P = 10e0.15t and your answer to part (b) on the same axes. Explain what you see.
50. You need $10,000 in your account 3 years from now and the interest rate is 8% per year, compounded continuously. How much should you deposit now?
51. If Q0 is the quantity of radioactive carbon-14 in an organism at the time of death, the quantity, Q, remaining t years later is given by
![]()
(a) A skull uncovered at an archeological dig has 15% of the original amount of carbon-14 present. Estimate its age.
(b) Calculate the half-life of carbon-14.
52. A radioactive substance has a half-life of 8 years. If 200 grams are present initially, how much remains at the end of 12 years? How long until only 10% of the original amount remains?
53. The size of an exponentially growing bacteria colony doubles in 5 hours. How long will it take for the number of bacteria to triple?
54. When the Olympic Games were held outside Mexico City in 1968, there was much discussion about the effect the high altitude (7340 feet) would have on the athletes. Assuming air pressure decays exponentially by 0.4% every 100 feet, by what percentage is air pressure reduced by moving from sea level to Mexico City?
55. The third-quarter revenue of Apple® went from $3.68 billion102 in 2005 to $15.68 billion103 in 2010. Find an exponential function to model the revenue as a function of years since 2005. What is the continuous percent growth rate, per year, of revenue?
56. The total world marine catch in 1950 was 17 million tons and in 2001 was 99 million tons.104 If the marine catch is increasing exponentially, find the (continuous) rate of increase. Use it to predict the total world marine catch in the year 2020.
57. You have the option of renewing the service contract on your three-year old dishwasher. The new service contract is for three years at a price of $200. The interest rate is 7.25% per year, compounded annually, and you estimate that the costs of repairs if you do not buy the service contract will be $50 at the end of the first year, $100 at the end of the second year, and $150 at the end of the third year. Should you buy the service contract? Explain.
58. If h(x) = x3 + 1 and g(x) = ![]() , find
, find
(a) g(h(x))
(b) h(g(x))
(c) h(h(x))
(d) g(x) + 1
(e) g(x + 1)
59. Let f(x) = 2x + 3 and g(x) = ln x. Find formulas for each of the following functions.
(a) g(f(x))
(b) f(g(x))
(c) f(f(x))
In Problems 60–62, find the following:
(a) f(g(x))
(b) g(f (x))
(c) f(f(x))
60. f(x) = 2x2 and g(x) = x + 3
61. f(x) = 2x + 3 and g(x) = 5x2
62. f(x) = x2 + 1 and g(x) = ln x
In Problems 63–65, use Figure 1.118 to graph the function.

63. 5f(x)
64. f(x + 5)
65. f(x) + 5
For the functions f(x) in Problems 66–69, graph:
(a) y = f(x) + 2
(b) y = f(x − 1)
(c) y = 3f(x)
(d) y = −f(x)
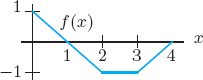
67.
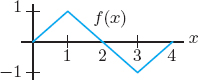
68.

69.

In Problems 70–73, use Figure 1.119 to graph the functions.

70. n(t) = m(t) + 2
71. p(t) = m(t − 1)
72. k(t) = m(t + 1.5)
73. w(t) = m(t − 0.5) − 2.5
74. A plan is adopted to reduce the pollution in a lake to the legal limit. The quantity Q of pollutants in the lake after t weeks of clean-up is modeled by the function Q = f(t) where f(t) = A + BeCt.
(a) What are the signs of A, B and C?
(b) What is the initial quantity of pollution in the lake?
(c) What is the legal limit of pollution in the lake?
In Problems 75–76, use shifts of a power function to find a possible formula for the graph.
75.

76.

77. The following table gives values for a function p = f(t). Could p be proportional to t?

78. The DuBois formula relates a person's surface area s, in m2, to weight w, in kg, and height h, in cm, by
![]()
(a) What is the surface area of a person who weighs 65 kg and is 160 cm tall?
(b) What is the weight of a person whose height is 180 cm and who has a surface area of 1.5 m2?
(c) For people of fixed weight 70 kg, solve for h as a function of s. Simplify your answer.
Find the period and amplitude in Problems 79–81.
79. y = 7 sin(3t)
80. z = 3 cos(u/4) + 5
81. r = 0.1 sin(πt) + 2
82. A graduate student in environmental science studied the temperature fluctuations of a river. Figure 1.120 shows the temperature of the river (in °C) every hour, with hour 0 being midnight of the first day.
(a) Explain why a periodic function could be used to model these data.
(b) Approximately when does the maximum occur? The minimum? Why does this make sense?
(c) What is the period for these data? What is the amplitude?

83. Figure 1.121 shows the number of reported105 cases of mumps by month, in the US, for 1972–73.
(a) Find the period and amplitude of this function, and interpret each in terms of mumps.
(b) Predict the number of cases of mumps 30 months and 45 months after January 1, 1972.

84. A population of animals varies periodically between a low of 700 on January 1 and a high of 900 on July 1. Graph the population against time.
For Problems 85–86, find a possible formula for each graph.
85.

86.

STRENGTHEN YOUR UNDERSTANDING
In Problems 1–105, indicate whether the statement is true or false.
1. The domain is the set of outputs of a function.
2. If V = f(a), where V is the value of a car (in thousands of dollars) and a is the car's age (in years), then f(10) is the age of a car valued at $10,000.
3. If f(x) = x2, then the point (2, 4) is on the graph of f(x).
4. The set of numbers between 3 and 4, including 3 and 4, is written (3, 4).
5. The function D = f(r) given by D = −3r + 10 has vertical intercept 10.
6. A function is always given by a formula.
7. If f(x) = x2 + 2x + 1 then f(3) = 16.
8. The graph of a function can have more than one horizontal intercept.
9. The graph of a function can have more than one vertical intercept.
10. The vertical intercept on the graph of C = f(q), where C is the cost to produce q items, represents the cost to produce no items.
11. The slope of the graph of a linear function f(p) is (f(p2) − f(p1))/(p2 − p1).
12. The graph of the linear function with formula m(x) = 3x + 2 has slope 2.
13. The slope of the graph of a linear function can be zero.
14. An equation of a line with slope −1 that passes through the point (2, 5) is y = −x + 7.
15. The function whose values are shown in the following table could be linear:
![]()
16. The graphs of two different linear functions must intersect in a point.
17. A line with positive slope must also have a positive y-intercept.
18. The linear function f(x) with f(4) = 2 and f(9) = 3 has slope 5.
19. If number of acres of harvested land is a linear function of elevation in meters, the units of the slope are meters per acre.
20. If (2, 5) is a point on the graph of a line with slope 3, then (3, 8) is also a point on the line.
21. The function D = f(r) given by D = −3r + 10 is an increasing function of r.
22. The average rate of change of a linear function f(t) between t = a and t = b is (f(b) − f(a))/(b − a).
23. If C(n) is the total cost, in dollars, to feed n students in the campus cafeteria, then the average rate of change of C(n) has units of students per dollar.
24. If s(z) = z2, then the average rate of change between z = −1 and z = 2 is positive.
25. A function f(x) can be both increasing and concave down over the interval 0 ≤ x ≤ 1.
26. The function Q(r) given in the following table appears to be concave up:
![]()
27. The speed and velocity of a moving object are the same.
28. The average rate of change of a function is the slope of the line between two points on the graph of the function.
29. A particle whose position s, in feet, at time t, in seconds, is given by s(t) = 3t + 2 has average velocity 3 feet per second.
30. If the graph of a function is concave up, the function must be increasing.
31. The relative change in a quantity is the change divided by the size of the quantity before the change.
32. If production is measured in tons, the units of the percent change of production is also measured in tons.
33. If cost is $1000 for a quantity of 500 and percent change is 15% when the quantity increases by 100 units, then the cost to produce 600 units is $1150.
34. Relative change is always positive.
35. If P in grams is a function of t in hours, then the relative rate of change is measured in grams per hour.
36. Profit is the sum of cost and revenue.
37. Revenue from selling a product is the selling price times the quantity sold.
38. The graph of the cost function C(q) always passes through the origin.
39. The cost function C(q) is a decreasing function of quantity q.
40. If the selling price is constant, the revenue function R(q) is an increasing function of quantity q.
41. Demand is always greater than supply.
42. At equilibrium price p* and quantity q*, the supply and demand curves intersect.
43. The units of marginal cost are the same as the units of marginal revenue.
44. The marginal profit is the marginal revenue minus the marginal cost.
45. The imposition of a sales tax won't change the equilibrium price and quantity.
46. The function Q(t) = 5 · 3t is exponential.
47. An exponential function has a constant percent growth or decay rate.
48. Exponential functions are always increasing.
49. The function P(t) = 10 · (1.03)t has a 30% growth rate.
50. The function Q(x) = 35(1/3)x has Q(2)/Q(1) = 1/3.
51. The function R(s) = 16 · 5s has a vertical intercept of 16.
52. The number e satisfies 2 < e < 3.
53. The function f(t) = 5t grows more quickly than the function g(t) = et.
54. If P = 25(1.15)t gives the size of a population in year t, then the population is growing by 15% per year.
55. The function Q(r) given in the following table could be exponential:
![]()
56. The value of ln(0) is 1.
57. The value of ln(1) is 0.
58. For all a > 0 and b > 0, we have ln(a + b) = ln(a) · ln(b).
59. The value of ln(e2) is 2.
60. The function f(x) = ln(x) is an increasing function of x.
61. If 5t = 36, then t ln 5 = ln 36.
62. The function P = 10e5t is an exponential growth function.
63. When b > 0, we have eln b = ln(eb).
64. When B > 0, we have ln(2B) = 2 ln(B).
65. When A > 0 and B > 0, we have ln(AB) = B ln(A).
66. The doubling time of P(t) = 3e5t and Q(t) = 6e5t is the same.
67. If the half-life of a quantity is 6 years, then 100 mg of the substance will decay to 25 mg in 9 years.
68. The half-life of P(t) = 2e−0.6t is twice the half-life of Q(t) = e−0.6t.
69. An amount of $1000 invested in a bank account at an interest rate of 3% compounded annually has a balance after t years of 1000e0.03t.
70. The doubling time of a continuous rate of 6% is more than the doubling time of a continuous rate of 3%.
71. To find the doubling time of P(t) = 5e2t, we can solve 10 = 5e2t for t.
72. Present value is always less than future value if interest rates are greater than zero.
73. Assuming continuous growth rate of 3%, the future value five years from now of a $1000 payment today is 1000e0.15.
74. The future value in five years of a $1000 payment made today is less than its future value in ten years (assuming an annual interest rate of 2%).
75. The present value of a payment of $1000 five years from now is less than the present value of a $1000 payment made ten years from now (assuming an annual interest rate of 2%).
76. The graph of f(x + 5) is the same as the graph of f(x) + 5.
77. If the graph of f(x) is always increasing, then so is the graph of f(x + k).
78. If the graph of g(t) is concave up, then the graph of −2g(t) is concave down.
79. If the graph of f(x) crosses the x-axis at x = 1, then so does the graph of 5f(x).
80. If the graph of f(x) crosses the x-axis at x = 1, then the graph of f(x + 1) crosses the x-axis at x = 0.
81. If g(s) = s2 then g(3 + h) = 9 + h2.
82. If f(t) = t2 and g(t) = t + 1 then fg(t)) = g(f(t)).
83. If f(x) = x3 − 5 and g(x) = ln x then f(g(x)) = (ln x)3 − 5.
84. The function h(x) = (3x2 + 2)3 can be written g(u(x)) where g(t) = t3 and u(x) = 3x2 + 2.
85. If f(x) = x2 − 1 then f(x + h) − f(x) = h2.
86. If A is proportional to B, then A = kB for some nonzero constant k.
87. If A is inversely proportional to B, then A = −kB for some nonzero constant k.
88. The function f(x) = 3x10 is a power function.
89. The function h(s) = 3 · 10s is a power function.
90. The function h(x) = ![]() can be written as a power function in the form h(x) = 3x−2.
can be written as a power function in the form h(x) = 3x−2.
91. The function g(x) = 3/(2x2) can be written as a power function in the form g(x) = 6x−2.
92. The function f(x) = ![]() can be written as the power function f(x) = 1.5x1/2.
can be written as the power function f(x) = 1.5x1/2.
93. If w = 10.25r3, then w is proportional to the cube of r.
94. If S = 25/![]() , then S is inversely proportional to the cube root of t.
, then S is inversely proportional to the cube root of t.
95. If p is proportional to q, then the ratio p/q is constant.
96. The amplitude of f(x) = 3 sin x is 3/2.
97. The period of g(x) = cos x + 2 is 2π.
98. The value of sin(3t)/sin(5t) is 3/5.
99. The graph of y = cos x is a horizontal shift of the graph of y = sin x.
100. The period of y = 3 cos(5t) + 7 is 5.
101. The period of y = sin(2t) is twice the period of y = sin(t).
102. The functions f(t) = 5 sin t and g(t) = 8 + 5 sin t have the same amplitude.
103. The graphs of y = (sin x)2 and y = sin(x2) are the same.
104. For all x, we have 0 ≤ sin(x) ≤ 1.
105. For all x, we have sin2 x + cos2 x = 1.
PROJECTS FOR CHAPTER ONE
1. Compound Interest
The newspaper article below is from The New York Times, May 27, 1990. Fill in the three blanks. (For the first blank, assume that daily compounding is essentially the same as continuous compounding. For the last blank, assume the interest has been compounded yearly, and give your answer in dollars. Ignore the occurrence of leap years.)
213 Years After Loan, Uncle Sam Is Dunned
By LISA BELKIN
Special to The New York Times
SAN ANTONIO, May 26 — More than 200 years ago, a wealthy Pennsylvania merchant named Jacob DeHaven lent $450,000 to the Continental Congress to rescue the troops at Valley Forge. That loan was apparently never repaid.
So Mr. DeHaven's descendants are taking the United States Government to court to collect what they believe they are owed. The total: __ in today's dollars if the interest is compounded daily at 6 percent, the going rate at the time. If compounded yearly, the bill is only __.
Family Is Flexible
The descendants say that they are willing to be flexible about the amount of a settlement and that they might even accept a heartfelt thank you or perhaps a DeHaven statue. But they also note that interest is accumulating at __ a second.
2. Population Center of the US
Since the opening up of the West, the US population has moved westward. To observe this, we look at the “population center” of the US, which is the point at which the country would balance if it were a flat plate with no weight, and every person had equal weight. In 1790 the population center was east of Baltimore, Maryland. It has been moving westward ever since, and in 2000 it was in Edgar Springs, Missouri. During the second half of the 20th century, the population center has moved about 50 miles west every 10 years.
(a) Let us measure position westward from Edgar Springs along the line running through Baltimore. For the years since 2000, express the approximate position of the population center as a function of time in years from 2000.
(b) The distance from Baltimore to Edgar Springs is a bit over 1000 miles. Could the population center have been moving at roughly the same rate for the last two centuries?
(c) Could the function in part (a) continue to apply for the next four centuries? Why or why not? [Hint: You may want to look at a map. Note that distances are in air miles and are not driving distances.]
3. Medical Case Study: Anaphylaxis106
During surgery, a patient's blood pressure was observed to be dangerously low. One possible cause is a severe allergic reaction called anaphylaxis. A diagnosis of anaphylaxis is based in part on a blood test showing the elevation of the serum tryptase, a molecule released by allergic cells. In anaphylaxis, the concentration of tryptase in the blood rises rapidly and then decays back to baseline in a few hours.
However, low blood pressure from an entirely different cause (say from a heart problem) can also lead to an elevation in tryptase. Before diagnosing anaphylaxis, the medical team needs to make sure that the observed tryptase elevation is the result of an allergy problem, not a heart problem. To do this, they need to know the peak level reached by the serum tryptase. The normal range for the serum tryptase is 0−15 ng/ml (nanograms per milliliter). Mild to moderate elevations from low blood pressure are common, but if the peak were three times the normal maximum (that is, above 45 ng/ml), then a diagnosis of anaphylaxis would be made.
The surgeons who resuscitated this patient ran two blood tests to measure Tr, the serum tryptase concentration; the results are in Table 1.47. Use the test results to estimate the peak serum tryptase level at the time of surgery assuming that tryptase decays exponentially. Did this patient experience anaphylaxis?
1From data obtained from the Kelley Blue Book, www.kbb.com.
2Adapted from Jan Terwel, “Real Math in Cooperative Groups in Secondary Education.” Cooperative Learning in Mathematics, ed. Neal Davidson, p. 234 (Reading: Addison Wesley, 1990).
3http://ageconsearch.umn.edu/bitstream/115558/2/AAE680.pdf, accessed September 2012.
4Vital Signs 2007-2008, The Worldwatch Institute, W.W. Norton & Company, 2007, p. 43.
5www.decc.gov.uk, accessed June 2011
6Rosenzweig, M.L., Species Diversity in Space and Time, p. 343 (Cambridge: Cambridge University Press, 1995).
7Vital Signs 2007-2008, The Worldwatch Institute, W.W. Norton & Company, 2007, p. 47.
8The Worldwatch Institute, Vital Signs 2001, p. 32 (New York: W.W. Norton, 2001).
9Abraham M. Lilienfeld, Foundations of Epidemiology, p. 155 (New York: Oxford University Press, 1976).
10www.decc.gov.uk, accessed June 2011.
11http://www.london2012.com/athletics/event=athletics-men-pole-vault/.
12Statistical Abstracts of the US, 2009, Table 361.
13Based on McDonald's Annual Report 2007, accessed at www.mcdonalds.com, May 2012.
14http://www.dairyco.org.uk/library/market-information/datum/world-milk-production.aspx, accessed May 2012.
15www.census.gov/hhes/www/poverty/histpov/hstpov2.html
16Vital Signs 2007-2008, The Worldwatch Institute, W.W. Norton & Company, 2007, p. 21.
17The World Almanac and Book of Facts 2008 (New York).
18From An Experimental Analysis of Grid Sweep Searching, by J. Wartes (Explorer Search and Rescue, Western Region, 1974).
19Rosenzweig, M.L., Species Diversity in Space and Time, p. 292 (Cambridge: Cambridge University Press, 1995).
20Adapted from “Average Weight of Americans by Height and Age,” The World Almanac (New Jersey: Funk and Wagnalls, 1992), p. 956.
21www.physsportsmed.com/issues/2001/07_01/jul01news.htm, accessed January 4. 2005.
22www.css.edu/users/tboone2/asep/May2002JEPonline.html, accessed January 4, 2005.
23www.css.edu/users/tboone2/asep/May2002JEPonline.html, accessed January 4, 2005.
24“Study finds tall people at top of wages ladder”, Yahoo News, May 17, 2009.
25Australian Fair Pay Commission, August 2007.
26The World Almanac and Book of Facts, 2005, p. 866 (New York).
27The World Almanac and Book of Facts, 2005, p. 136 (New York).
28Risebrough, R. W., “Effects of environmental pollutants upon animals other than man.” Proceedings of the 6th Berkeley Symposium on Mathematics and Statistics, VI, p. 443–463 (Berkeley: University of California Press, 1972). PCBs were banned in the US in 1979.
29http://www.sec.gov/Archives/edgar/data/39911/000119312510068386/d10k.html#tx95595_10, accessed May 2012.
30www.earth-policy.org/Indicators/indicator11_datal.htm, accessed April 19. 2005.
31Statistical Abstracts of the United States 2009, Table 1204.
32www.ita.doc.gov/td/industry/otea/usfth/aggregate/H03t26.pdf, accessed April 19, 2005.
33Vital Signs 2007-2008, The Worldwatch Institute, W.W. Norton & Company, 2007, p. 51 and 67.
34www.pepsico.com, accessed August, 2012.
35http://www.fda.gov/downloads/TobaccoProducts/NewsEvents/UCM242577.pdf, accessed August, 2012.
36Data from von Bertalanffy, L., General System Theory, p. 177 (New York: Braziller, 1968).
37The World Almanac and Book of Facts 2005, p. 144 (New York).
38The World Almanac and Book of Facts 2005, p. 143 (New York).
39www.gm.com/company/investor_information/earnings/hist_earnings/index.html, accessed May 23. 2009.
40The World Almanac and Book of Facts 2005, p. 310 (New York).
41From Cullen, M.R., Linear Models in Biology (Chichester: Ellis Horwood, 1985).
42Intel 2010 Annual Report, www.intel.com/intel/finance, accessed August, 2012.
43//hypertextbook.com/facts/2005/MichelleLee.shtml
44Data from Huey, R.B. and Hertz, P.E., “Effects of Body Size and Slope on the Acceleration of a Lizard,” J. Exp. Biol., Volume 110, 1984, p. 113-123.
45www.css.edu/users/tboone2/asep/May2002JEPonline.html, accessed January 4, 2005.
46http://en.wikipedia.org/wiki/History_of_United_States_postage_rates
47http://www.usinflationcalculator.com/, accessed August 2012.
48www.bea.gov/national/nipaweb, Table 1.1.5.
49http://www.eia.doe.gov/aer/renew.html. Accessed February 2011.
50Yearly values have been joined with segments to highlight trends in the data; however, values in between years should not be inferred from the segments. From http://www.eia.doe.gov/aer/renew.html. Accessed February 2011.
51We use the official price per peak watt, which uses the maximum number of watts a solar panel can produce under ideal conditions. From http://www.eia.doe.gov/aer/renew.html. Accessed February 2011.
52This π has nothing to do with the area of a circle, and merely stands for the Greek equivalent of the letter “p.”
53Adapted from Barry Bressler, A Unified Approach to Mathematical Economics, p. 81–88 (New York: Harper & Row, 1975).
54http://minerals.usgs.gov/ds/2005/140/, accessed September, 2012.
55dataworldbank.org, accessed January 12, 2011.
56The reason we do not want a ≤ 0 is that, for example, we cannot define a1/2 if a < 0. Also, we do not usually have a = 1, since P = P0at = P01t = P0 is then a constant function.
57Based on “Wyoming drops federal protection of gray wolves”, BBC, August 31, 2012, and Wyoming Wolf Program Status Report, US Fish and Wildlife Services, September, 2012.
58ww.prb.org/Publications/Datasheets/2012/2012populationclock.aspx, accessed August 2012.
59http://www.wwindea.org/home/index.php, accessed September 2012.
60Vital Signs 2007-2008, The Worldwatch Institute, W.W. Norton & Company, 2007, p. 23.
61http://www.dol.gov/esa/minwage/chart.htm#5.
62http://www.eia.doe.gov/aer/renew.html. Accessed February 2011.
63From http://www.eia.doe.gov/aer/renew.html. Accessed February 2011.
64Yearly values have been joined with segments to highlight trends in the data. Actual values in between years should not be inferred from the segments. From http://www.eia.doe.gov/aer/renew.html. Accessed February 2011.
652011 Annual Report to Stockholders, accessed at www.thehersheycompany.com, August 2012.
66Brook, R. D., Franklin, B., Cascio, W., Hong, Y., Howard, G., Lipsett, M., Luepker, R., Mittleman, M., Samet, J., and Smith, S. C. (2004). “Air pollution and cardiovascular disease.” Circulation, 109(21):2655267.
67Rickwood, P. and Knight, D. (2009). “The health impacts of local traffic pollution on primary school age children.” State of Australian Cities 2009 Conference Proceedings.
68Data from “Textbooks headed for ash heap of history”, http://educationtechnews.com, Vol 5, 2010.
69http://www.indexmundi.com/. Accessed April 17, 2011.
70http://www.autoblog.com/2010/01/04/report-number-of-cars-in-the-u-s-dropped-by-four-million-in-20/ and http://2010.census.gov/news/releases/operations/cb10-cn93.html. Accessed February 2012.
71www.cia.gov/library/publications/the-world-factbook.
72This is referred to as the time value of money.
73If you read the fine print, you will find that many lotteries do not make their payments right away, but often spread them out, sometimes far into the future. This is to reduce the present value of the payments made, so that the value of the prizes is less than it might first appear!
74World Wind Energy Association, www.wwindea.org, accessed September 6, 2009.
75http://www.unaids.org/en/media/unaids/contentassets/restore/AIDS30_KEY_FINDINGS_en.pdf, accessed September 2012.
76From Robert M. Julien, A Primer of Drug Action, 7th ed., p. 159 (New York: W. H. Freeman, 1995).
77news.yahoo.com/s/afp/australiaanimalskoalas, accessed June 1, 2005.
78http://2010.census.gov/2010census/. Accessed April 17, 2011.
79http://geography.about.com/od/obtainpopulationdata/a/worldpopulation.htm, accessed September 2012.
80“Tigers would be extinct in Russia if unprotected,” Yahoo! News, Nov. 21, 2010.
81“Reviewing the Bidding on the Climate Files”, in About Dot Earth, New York Times, Nov. 19, 2010.
82http://www.eia.doe.gov/aer/renew.html
83K. Schmidt-Nielson: Scaling–Why is Animal Size So Important? (Cambridge: CUP, 1984).
84Scientific American, p. 112 (September, 1989).
85Rosenzweig, M.L., Species Diversity in Space and Time, p. 143 (Cambridge: Cambridge University Press, 1995).
86Strogatz, S., “Math and the City”, The New York Times, May 20, 2009. Kleiber originally estimated the exponent as 0.74; it is now believed to be 0.75.
87Adapted from “On the Dynamics of Exploited Fish Populations” by R. J. H. Beverton and S. J. Holt, Fishery Investigations, Series II, 19, 1957.
88US News & World Report, August 18, 1997, p. 79.
89Strogatz, S., ”Math and the City”, The New York Times, May 20, 2009.
90Strogatz, S., ”Math and the City”, The New York Times, May 20, 2009.
91“Income Needed to Get a Mortgage,” The World Almanac 1992, p. 720.
92http://www.census.gov/const/www/quarterly_starts_completions.pdf, accessed May 25. 2009.
93http://www.weather.com, accessed February 20, 2005.
94www.maineboats.com/tidecharts/tides?T=junpt09.
95www.beerinstitute.org/pdfs/PRODUCTION_AND_WITHDRAWALS_OF_MALT_BEVERAGES_1997_1999.pdf, accessed May 7, 2005.
96Robert M. Julien, A Primer of Drug Action, Seventh Edition, p. 360 (W. H. Freeman and Co., New York: 1995).
97M. L. Rosenzweig, Species Diversity in Space and Time, p. 71 (Cambridge University Press, 1995).
98http://www.esrl.noaa.gov/gmd/ccgg/trends/. Accessed March 2011. Monthly means joined by segments to highlight trends.
99“Investigating the Next Silent Spring,” US News and World Report, pp. 50–52 (March 11, 1996).
100Abraham M. Lilienfeld, Foundations of Epidemiology, p. 67 (New York; Oxford University Press, 1976).
101Statistical Abstracts of the United States 2009, Table 1304.
102http://www.apple.com/pr/library/2005/oct/11results.html. Accessed April 27, 2011.
103http://www.apple.com/pr/library/2010/01/25results.html. Accessed April 27, 2011.
104The World Almanac and Book of Facts 2005, p. 143 (New York).
105Center for Disease Control, 1974, Reported Morbidity and Mortality in the United States 1973, Vol. 22, No. 53. Prior to the licensing of the vaccine in 1967, 100,000–200,000 cases of mumps were reported annually. Since 1995, fewer than 1000 cases are reported annually. Source: CDC.
106From David E. Sloane, M.D., drawing from an actual episode in his clinic.