
Chapter 5
Assessing Readiness for Transformation
In This Chapter
![]() Identifying your business strategy
Identifying your business strategy
![]() Considering your strategic plan
Considering your strategic plan
![]() Getting to grips with the capability maturity road map
Getting to grips with the capability maturity road map
This chapter discusses the importance of assessing whether your organisation is ready to undertake a major transformation and how to undertake that assessment. We consider various ways you can validate that your strategy is likely to be effective, robust and comprehensive – which will all be required for an effective transformation. These include using capability maturity models and we look at how these can be used not only for this purpose before starting on the transformation journey but also as that journey progresses.
Assuring an Appropriate Business Strategy
Having an appropriate business strategy is a prerequisite to an effective transformation programme. Our approach to successful Lean Six Sigma deployment involves:
- Doing the right work
- Doing the work right
- Creating the right environment
Figure 5-1 demonstrates these key considerations for effective deployment of Lean Six Sigma.
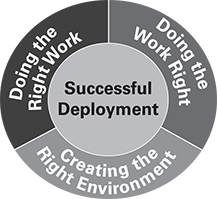
Figure 5-1: Effective deployment of Lean Six Sigma.
Applied to transformation these points can be read as:
- Having the right strategy
- Deploying the strategy right
- Creating the right environment
Figure 5-2 demonstrates effective deployment of transformation.
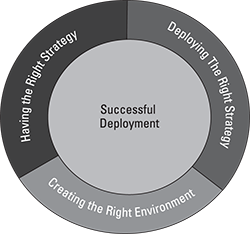
Figure 5-2: Effective deployment of transformation.
This book isn’t focused on creating or developing strategy, as that should be a prerequisite of organisational transformation. However, covering the ways in which you can verify whether or not a given strategy is likely to be appropriate will be useful. While no guarantees exist that any given strategy will be successful, you can apply certain tests that will, at the very least, screen out inappropriate or incomplete strategies or those involving an unacceptable level of risk.
Identifying your strategy
The typical key components of a strategic plan include an understanding of an entity’s vision, mission, values and strategies. In a commercial organisation a vision statement or a mission statement may encapsulate the vision and mission.
- Vision outlines what the organisation wants to be or how it wants the world in which it operates to be.
- Mission defines the fundamental purpose of the organisation, succinctly describing why it exists and what it does to achieve its vision.
- Values are beliefs that are shared among the stakeholders of an organisation.
- Strategy is the means by which the mission and vision are to be achieved.
An organisation’s strategy describes how it intends to achieve its mission and vision and create value for its stakeholders (including shareholders for a commercial business), customers, and society at large. Its mission is the what it attends to achieve; its vision is where it wants to be.
For any strategy to be effective it must be appropriate, comprehensive, and well described and articulated; it should also be robust in relation to future external developments. You can reasonably test for each of these requirements and validate how well your strategy meets them.
For a strategy to be appropriate, it needs to take proper account of the external business and economic environment and have a real understanding of the competitive landscape. It must also realistically address the internal environment; that is, whether those in the organisation are capable of operating, growing, and developing together within the resource constraints that define and limit options. An effective strategy needs to be both realistic and stretching.
For a strategy to be comprehensive, it must be holistic and address all reasonable internal and external perspectives. It cannot take the form of just a financial plan for revenue and profit growth nor for products and services; nor can it simply focus on a core operational process value stream or on the organisation’s employees. It has to cover all of these and more, including addressing the perspectives of key external stakeholders such as customers, suppliers and other business partners, competitors, and regulators – as well as the organisation’s owners or shareholders. And all of these perspectives need to be joined up without gaps or undue overlaps.
Testing and validating your strategy
A well described and articulated strategy requires it to be effectively quantified and documented. It should be capable of being simply demonstrated, visually as well as in words, and the numbers need to be credible and to add up. A robust strategy should be capable of continuing to be deployed even if significant changes occur in the external and competitive environment. It should be able to address a range of foreseeable different scenarios.
Of course, some overlap exists between these requirements, so unsurprisingly the tools available to test and validate your strategy may well cover more than one of them. These tools include:
- Strategy maps: These enable you to visualise the strategy. They also show the cause-and-effect relationships amongst the components of an organisation’s strategy.
- Balanced scorecard: This ensures that a holistic approach is taken from four perspectives: ‘financial’, ‘customer’, internal processes’, and ‘learning and growth’. The balanced scorecard also requires quantification because the outcomes of appropriate metrics and their associated targets link to strategic activities across it.
- Scenario planning: This tests that the strategy is robust in relation to a reasonable range of evolving circumstances.
- Capability/maturity assessment and road map: These test that the strategy is realistic and meaningful.
- DRIVE model: This overall methodology explicitly incorporates the testing and validation of strategy.
We cover each of these tools in more detail in the following sections and later in this chapter.
Strategy maps
You use strategy maps to ensure that your strategy is balanced; they allow you to see how operational plans and initiatives are linked and work toward achieving your strategic objectives. In the example shown in Figure 5-3, a ‘swimlane’ approach is taken to show how the various elements populate the four different scorecard perspectives (for example, ERP system in ‘Learning and Growth’, faster service in ‘Customer’).
Clearly all of the various elements must connect through to the desired strategic goal, otherwise any loose ends will demonstrate that the strategy is incomplete or not fully thought through. Likewise, each individual path must be logical and credible. Furthermore, the viewer can reasonably question whether further paths are necessary for the strategy to be realised.
This approach is highly visual and if a strategy cannot reasonably be pictured in this way, there’s likely to be something wrong or incomplete about it. The strategy map doesn’t guarantee that the strategy is appropriate, but it does provide a simple test for checking comprehensiveness and articulation; however, it does not test for quantification.
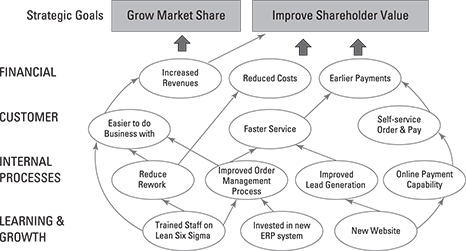
Figure 5-3: Example strategy map.
 Draw a strategy map for all of your key strategies, making sure it’s comprehensive and illustrates all relevant linkages.
The balanced scorecard
Still considering appropriateness and comprehensiveness, an effective strategy must cover all bases as they relate to stakeholders and competitors. You need to consider what the strategy will deliver to them – and how it will do so.
One way of checking that your organisation’s strategy covers all bases is to view it through the perspective of a balanced scorecard, as illustrated in Figure 5-4. A balanced scorecard is a means of presenting a holistic set of performance measures for the organisation. In its most typical configuration it has four perspectives, or quadrants:
- Financial: It encourages the identification of a few relevant high-level financial measures. It should answer the question, ‘How do we look to shareholders?’
- Customer: It encourages the identification of measures that answer the question, ‘How do customers see us?’
- Internal business processes: It encourages the identification of measures that answer the question, ‘What must we excel at?’
- Learning and growth: It encourages the identification of measures that answer the question, ‘How can we continue to improve, create value, and innovate?’
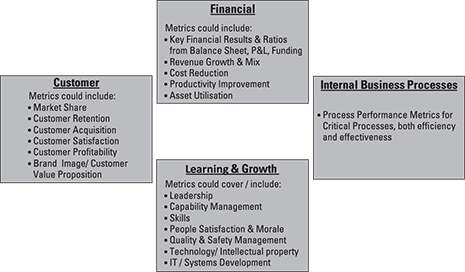
Figure 5-4: The balanced scorecard.
You can also impose a strategy map over the balanced scorecard quadrants to show how the individual metrics are interrelated and delivered using the strategy in question. Thus, from the financial perspective, you look at things through the eyes of the organisation’s owners and investors. What has the strategy got to deliver to them in return for their investment? From the customer perspective, you look at the impact on other external stakeholders. Although nominally the customer quadrant, it can also encompass other stakeholders such as regulatory bodies. Accordingly it looks at the strategy from their perspectives and asks what value it will deliver to them. Competition is also considered in this quadrant because market share and account penetration are typical outcomes targeted and reported here.
The internal perspective is addressed in the internal business processes quadrant. As it is representative of core operational issues, process effectiveness and efficiency are reviewed. Reviewing these issues will also reveal how the organisation’s processes are seen by employees and suppliers.
The learning and growth perspective essentially covers the impact of investment in the organisation’s staff and systems. This can also include the impact of investment in Lean Six Sigma – showing the number of people trained and certified – as well as people development more generally. Investments in IT systems and technology are also reported in this quadrant.
Taken as a whole, these different quadrants should cover all the different perspectives, stakeholders, and bases. Most commercial organisations typically use this four-quadrant configuration. For public and voluntary sector organisations, the more complex range of stakeholders may require alternative configurations, with additional perspectives identified and separately shown – but the principle remains the same.
Wherever possible, develop and review a suitable balanced scorecard showing the core target metrics tying back to the organisation’s strategy. Doing so will soon illustrate whether the strategy is holistic or purely one-dimensional.
If your strategy is holistic, the various metrics shown on the balanced scorecard should exhibit suitable cause-and-effect linkages, which can also be shown as strategy maps across the scorecard. If any loose ends exist, the various elements of your strategy won’t all hang together.
To ensure a process of transformation rather than evolutionary change, the strategy must involve stretching goals and objectives. ‘No pain, no gain’ is certainly true here; the more stretching, the more challenging the strategy will be to resource, and the quicker the changes will need to happen.
Identify the constraints potentially bounding the strategy and consider the degree of challenge they pose. Unless innovative approaches are required to address these constraints, it’s quite likely that the strategy is insufficiently stretching. In the opposite direction, you have to be realistic – it’s clearly impossible to have more than a 100 per cent market share and you can’t move faster than the speed of light!
 Assess the constraints from a realistic perspective and consider whether any aspect of the strategy is indeed a step too far or too fast.
Scenario planning
You need to test the robustness of your strategy. The only certain thing you know about the future is that it will be different from what you forecast; what’s uncertain, of course, is how different it will be. Thus, whatever strategy you’ve devised must not only be appropriate for the future scenario you forecast but also have a realistic chance of remaining appropriate for the actual future that will, in due course, occur.
The best way to test the robustness of your strategy is to consider a set of alternative scenarios that are likely to be within a reasonable range of what might actually occur.
Consider the possible main factors that proscribe your forecast of the future planning period. These could be economic (growth, unemployment, interest rates and so on), market related (assumptions regarding competitors’ behaviour, performance and products), internal (relating to performance or efficiency savings) or others. Assess the likely range these factors could reasonably be expected to demonstrate and develop a suitable set of scenarios, the central one of which should be the most likely planned outcome, with a manageable number of alternative scenarios covering the range of values of the more relevant factors. Assess the extent to which the proposed strategy is likely to require modification and/or risk failure within these scenarios; the less the impact, the more robust the strategy.
Working With Your Strategic Plan
The strategy has to be more than just a high level outline with target outcomes. It needs to be turned into a detailed plan. Not everything in that plan needs to require a breakthrough for the organisation to undertake a transformation, but obviously some things will require it. The trick is to see the wood for the trees – to distinguish clearly those vital few objectives and measures for which breakthrough is required from the many others that don’t, and plan for and manage these distinctly differently.
Looking at the components of the strategic plan
The typical key components of a strategic plan include an understanding of an entity’s vision, mission, values and strategies.
Organisations sometimes summarise goals and objectives in a mission statement or a vision statement. Others begin with a vision and mission and use them to formulate goals and objectives.
The overall strategic plan is likely to contain key information such as:
- A baseline statement: Where the organisation is currently.
- Assumptions: Typically including key political, economic and business environmental information and market, regulatory and competitor developments.
- Scenario details: Although a single main set of assumptions will probably exist, alternative scenarios may also be included and their impact explored.
- Subsidiary business plans: These may include:
- Financial plan
- Marketing plan
- Technology plan
- Product plan
- R&D plan
- Operations plan
- Admin plan
- Plans for subsidiary divisions or semi-autonomous units
In the context of this book, the strategic plan may well separately identify the contributions required of any transformation programme from the remaining ‘business as usual’ development.
The strategic plan is likely to be outcome focused, leaving the details regarding how these outcomes will be achieved to the subsidiary operational plans that will be developed through the strategy deployment process. The individual and component strategies should be clearly visible and well-articulated in the strategic plan, together with how they interrelate, and contribute overall to the achievement of the vision and mission.
Reviewing the strategic plan
We discussed earlier in this chapter how to review an individual strategy. Thus in essence reviewing the strategic plan is the validation of the individual strategies taken as a whole.
If your transformation is to be successful, not only do you need to validate the associated strategy but also ensure that the strategy itself is appropriate within the context of the overall strategic plan. To make this clear, consider a specific example.
 Acme Inc. provides a range of facilities management services to its corporate clients across the globe. The company is planning a transformation programme in one of its UK operations because contract renewal with the client involved is likely to require a progressive price reduction of more than 15 per cent over the next three years. The company’s overall business plan calls for growth in both overall business and operating profits.
The UK operations strategy for this particular client calls for:
- A successful outcome from negotiations with the client regarding renewal of and extension to the contract in question.
- A transformation programme to progressively drive efficiency improvements, cost and waste reduction to cut operating costs by at least 15 per cent over the next three years.
- A service delivery enhancement programme to sustain or improve the quality of the services delivered under the new contract.
This is, of course, a perfect opportunity for transformation through Lean Six Sigma – addressing the aspects of both service delivery quality and cost.
Acme Inc.’s overall strategic plan includes corporation-wide strategies for the progressive application of common IT platforms across the group and the development of shared service operations spanning multiple clients. A clear potential interdependency exists between the local UK operations strategy and these two corporation-wide strategies. Common IT platforms may impose constraints on the process architectures that operating companies can adopt. Shared service operations can significantly lower unit costs overall but also impact the freedom of local operations to deliver services in line with local client requirements.
In this example a need exists to review the impact of both the local company’s strategy and associated aspects in the wider corporate-level strategic plan.
Before embarking on your proposed transformation, ensure that the scope of your strategy review includes not only the directly associated local strategy but also any aspects of the wider corporate strategic plan that could impose constraints or otherwise interrelate with that local strategy.
Defining strategic essentials
The strategic essentials are the vital few statements of direction distilled from the strategic plan. They must:
- Be customer focused
- Have a measurable and verifiable end goal
- Summarise the core elements of the strategy
- Cover the medium to long term (three to five years or longer)
An example is: ‘Be number 1 or 2 in our chosen markets.’
Associated with these strategic essentials are critical objectives – stretching goals containing or spanning multiple processes. These goals should be SMART, cover a period of two to five years, and at this stage in your planning you don’t yet know how you’ll achieve them.
SMART = Specific, Measureable, Achievable, Realistic and Time-bound!
An example of a critical objective linked to your strategic essential of ‘being number 1 or 2 in our chosen markets’ is: ‘Capture an additional 30 per cent market share from a current base of 37 per cent within the next 5 years.’
From your multi-year plan to deliver the strategic essentials you need to develop a rolling short-term plan (one year), including focus areas that are able to be cascaded across and down the organisation; their targeted outcomes will be aligned to the critical objectives, focusing on the vital few.
An example focus area linked to the strategic essential and critical objective above is: ‘Develop indirect sales channels from 15 per cent to at least 20 per cent by the end of this coming financial year.’
We cover the strategy deployment process in Chapter 9. For now, suffice it to say that the development and review of strategy are the responsibility of senior management. Senior management identifies and develops the longer-term strategic essentials and critical objectives together with the shorter-term focus areas. It typically does so through a facilitated workshop process. Subsequently the managers in the business as a whole break down the focus areas into aligned short-term processes and related improvements.
Checking Out the Capability Maturity Road Map
You can use a number of different approaches to assessing current capability maturity and mapping out its intended future development. These include using business excellence model frameworks such as those of the European Foundation for Quality Management (EFQM) or the Baldrige Award Framework, which are widely adopted in Europe and North America, respectively; see Figures 5-5 and 5-6.
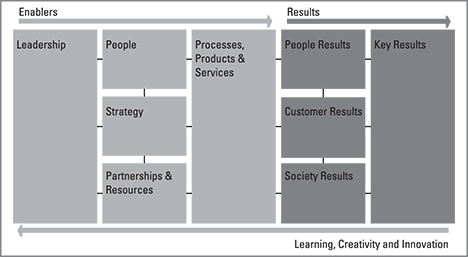
Figure 5-5: EFQM Excellence Model. © European Foundation for Quality Management.
These excellence models were originally developed to support national quality awards to stimulate the widespread development and adoption of world-class best business practices in Europe and the USA in order to increase their global competitiveness. Subsequently, these models become widely adopted as frameworks for organisations to self-assess their own management systems. Neither model is directly prescriptive, but each encourages organisations to carefully consider how they achieve effective leadership, as well as the results obtained from doing so. Developments stemming from such self-assessment approaches include specific capability maturity matrices indicating various levels of performance from the very basic to world class for each of the constituent criteria.
Another internationally recognised framework is the Shingo Prize Model, as illustrated in Figure 5-7.
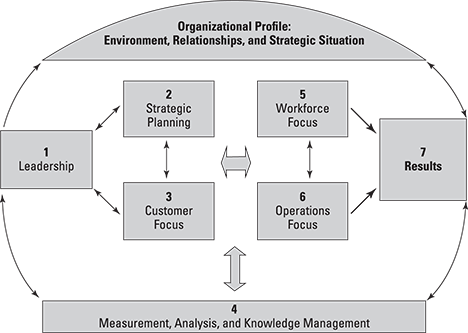
Figure 5-6: Baldrige Excellence Model. © Baldrige Foundation.
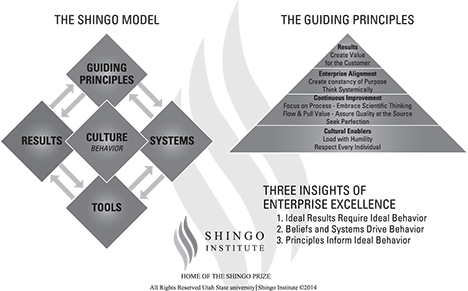
Figure 5-7: Shingo Prize Model. © Shingo Institute.
The Shingo Prize Model™ and Application Guidelines provide a framework for identifying and evaluating the standard for operational excellence. The Shingo Prize Model™ and Application Guidelines generally do not prescribe one single best method, system or route to attaining operational excellence. Principle-driven organisations are clearly viewed as the best paradigm for achieving operational excellence.
The guiding principles of the Shingo Model™ are:
- Respect every individual
- Lead with humility
- Seek perfection
- Assure quality at the source
- Flow and pull value
- Embrace scientific thinking
- Focus on process
- Think systemically
- Create constancy of purpose
- Create value for the customer
In a similar vein to the EFQM and Baldrige models, the Shingo Prize Model™ can be used to develop a capability maturity matrix.
You can also consider custom developing a capability maturity framework building on all of the models above but adapted to the specific requirements of your own organisation’s transformation. We’ve developed such a framework – DRIVE – which aligns with the DRIVE transformation methodology described in Chapter 3. Figure 5-8 illustrates Elements of the DRIVE model and Figure 5-9 the resulting capability maturity model.

Figure 5-8: Elements of the DRIVE model. © Catalyst Consulting Ltd.
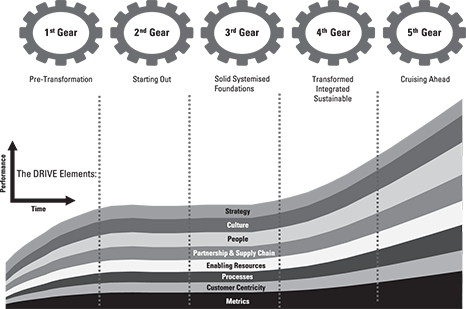
Figure 5-9: The DRIVE capability maturity model. © Catalyst Consulting Ltd.
Recognising that every organisation is different
Every organisation believes itself to be different and many organisations require proof that Lean Six Sigma can work in their own organisation, rather than evidence from other companies. However, in our experience many similarities exist between different organisations; indeed, the similarities may arguably be bigger than the supposed differences in many cases. Such similarities enable the establishment of specific characteristics likely to be present in organisations at different levels of capability maturity that can be entered into a capability maturity matrix.
Based on the DRIVE capability maturity model, Figure 5-10 provides an extract from the capability maturity matrix (showing two of the levels for three of the elements – note that five levels and eight elements exist in total).
You can demonstrate the shape of the organisation in capability maturity terms by highlighting the gear levels that best describe its performance on each pillar, as shown in Figure 5-11.
Acme Inc.’s position overall may be described as driving in third gear; its performance is slightly unbalanced, with three pillars lagging in second gear, while another pillar is ahead, in fourth gear.
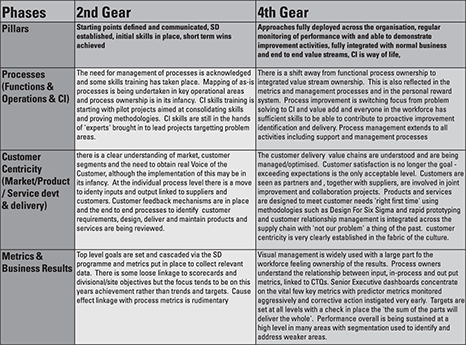
Figure 5-10: Extract from the DRIVE capability maturity matrix. © Catalyst Consulting Ltd.
Each organisation will have its own unique map – in this sense every organisation is indeed different. However, the individual cells of the overall matrix describe individual conditions that may occur in many organisations. Taken together, these two things ‘square the circle’ – even though every organisation may be different, many similarities exist between organisations.
Assess your own organisation’s capability maturity using a suitable model, such as the one described above. Doing so enables you to determine the state from which the organisation is starting out, and whether it’s a balanced state.
Putting together the road map
The capability maturity matrix can now model the journey the organisation needs to make to complete its transformation. You can identify the gear levels desired for each pillar at the different stages of the journey.
To ensure a smooth drive, try to broadly align the gear levels for each pillar as your transformation journey changes gear upwards.
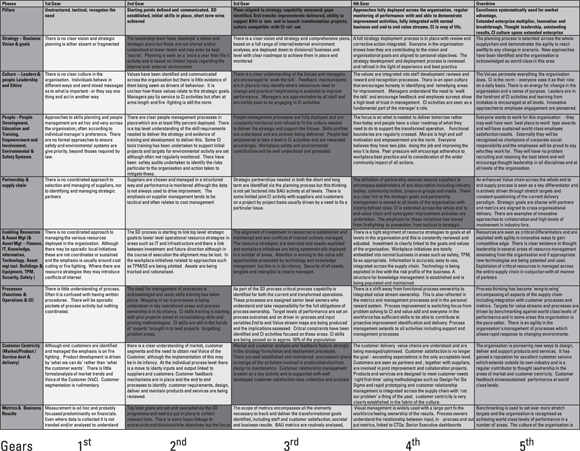
Figure 5-11: Example of a completed capability maturity matrix for Acme Inc. © Catalyst Consulting Ltd.
Plot the desired gear levels for each pillar at the end of each future planning period (or year, if appropriate). The descriptions in the individual highlighted cells of the matrix describe the outcomes you seek to achieve by those times. The succession of (annual) pictures of the matrix then becomes your road map for the transformation journey.
Figure 5-12 illustrates how the matrix develops and changes over time.

Figure 5-12: The matrix evolves over time.