
Chapter 5
Using Someone Else’s Financial Model
IN THIS CHAPTER
![]() Building your own model versus using a template
Building your own model versus using a template
![]() Working with inherited models
Working with inherited models
![]() Using Excel’s audit tools
Using Excel’s audit tools
![]() Checking your model’s accuracy
Checking your model’s accuracy
As a consultant, my favorite scenario is when a client comes to me and asks me to build a new model from scratch. This situation does happen every now and then, but it’s very rare. Normally, clients have a financial model that isn’t working properly, or they need to update their model from last year, or they need to change the layout or design of their model. Being able to create my own models from scratch every time would be nice, but it’s rarely practical. Instead, most of the time, like most modelers, I’m working with inherited models — models I’ve had to take over from someone else.
When you inherit a model, not only do you inherit the inputs, assumptions, and calculations the original modeler has entered, but you also inherit their mistakes. Using someone else’s model involves taking responsibility for someone else’s work, sometimes from people you’ve never even met! If you’re going to be taking responsibility for someone else’s model, you need to take it over and make it your own. You need to take responsibility for the workings of this model, and you have to be confident that the model is working correctly.
In this chapter, you explore some ways of checking, auditing, validating, and, if necessary, correcting other people’s models so that you can be confident in the models’ results.
Considering Templates for Building a Financial Model
Models are often inherited in the form of templates. Dealing with a model built from a template is quite a different prospect than using a model that has been purpose-built for the job. In this section, I start by taking a look at why a modeler would use templates in the first place. Then I steer you in another direction and tell you why.
Why templates can be appealing
If you describe yourself as a “casual” financial modeler, your usual job might be something else entirely, but part of your professional and personal life means that you need to create a budget or financial statements, or maybe just do some pricing calculations. If this is you, you’re probably looking for an easy way to create a quick financial model that gives you the results you need. Starting to build a full financial model entirely from the ground up, especially when you have no idea where to begin, can be rather daunting. Using a template is a very appealing option because it requires a much lower initial investment of time and money than building a model yourself.
 If the business or situation you’re trying to model is extremely simple and/or your business is exactly the same as every other business, you’ll be fine with a template. However, most templates are really just a nicely formatted spreadsheet. There is a bit more to building a robust, responsive, and accurate financial model than plugging a few numbers into a spreadsheet.
If you’re looking for a shortcut to building a financial model, keep in mind what a fully functional, dynamic model does that a basic spreadsheet does not. For more information about differentiating a model from a spreadsheet, see the section in chapter 1 on “Defining Financial Modeling”.
What’s wrong with using templates
When you’re first starting out, a template may be a good way to get going. But think of a template as a car with no engine — it looks great on the surface, but there’s no performance! Here are a few important features you won’t have when you use a template:
-
Financial models need drivers: What makes a really good financial model is its ability to take the business model and represent it financially. Revenues and expenses don’t just happen — something occurs that makes that revenue or expense become a reality. Drivers are absolutely critical in creating a financial model that is flexible and scalable. For example, if you were to achieve 10 percent market penetration, and your product was priced at $5, your revenue would be, say, $100,000 per month. Many templates simply show a hard-coded value of $100,000 for revenue, but in your model, you need to know exactly what had to happen in order for revenue to be calculated at $100,000.
Of course, the beauty of this method not only means that investors or other users can trace back to see how the revenue is calculated, but you can also run scenarios and sensitivity analyses on these inputs. What if penetration were 12 percent? What if you decreased the pricing by 10 percent? This sort of analysis is virtually impossible with a simple input of $100,000 for revenue.
-
Customized inputs: A fill-in-the-blanks template has to suit everyone, so in order to meet the requirements of virtually any business model, the inputs must be kept generic (Revenue Item 1, Revenue Item 2, and so on). Of course, you can change the titles of these line items, but what if you have different lines of businesses that need to be separated?
Here’s another example: “Office Rent” — a line item often found in a template — may not apply to your company. Maybe you bought your building, have a mortgage (a liability, not an expense), and need a way to factor in the mortgage pay down and interest portion of each payment. An experienced financial modeler would have no problem working this into a customized forecast. If you’re using a template, you’ll have a hard time getting the template to meet your needs. Plus, you’ll probably spend more time manipulating the template to meet your needs than you would’ve spent just building it from scratch.
- Scalability: Just like that cheap one-size-fits-all shirt you bought from the market, your model will probably never fit properly. It’s pretty much guaranteed that whatever number of inputs the template designer has chosen won’t be exactly what you need. Inserting or deleting rows may seem simple, but any Excel modeler knows how deadly that can be. Before you know it, you’ve ended up with a model full of dreaded #REF! errors. To avoid this, the template designer likely crated a large number of unnecessary rows and columns just in case you need them. Most templates contain a huge amount of redundant information and unnecessary complexity, which is confusing, takes up memory, and is simply poor modeling practice.
-
Specialized functionality: The standard financial reports have always been the balance sheet, cash flow statement, and profit and loss, but there are many additional reports that might be useful to your business but not necessarily to others. Unfortunately, you won’t find anything beyond standard, minimum functionality in a template.
You’re not very likely to have much more than very basic scenario analysis functionality built into a template. For example, it would be nice to be able to change a few inputs and do a scenario analysis to find out how increasing marketing by 10 percent affects the bottom line. A good scenario analysis tool built into a financial model is really what makes a model useful, because you can easily see what changing not just one variable but multiple variables does to the company.
Templates are great for very surface-level projecting, or “back of the envelope” calculations where a high level of precision is not required. But if you’re serious about your modeling, you’ll want it done correctly and as accurately as possible. Finding a template that will meet your specific needs is nearly impossible. Between the work you’ll do adjusting it and the frustration you’ll experience using it, you’ll wish you’d just built the model from scratch!
Why you should build your own model
Imagine you are working on the due diligence for a potential acquisition by your company of a smaller one. Someone else created a model to project the financials but has since left, and you’re responsible for the financial model now. Your investor asks why your sales projections increase so sharply when the expenses do not. The answer — “because that’s what the financial model says” — is simply not good enough. If you’re responsible for the model, you need to be familiar enough to able to answer a question like that — perhaps not off the top of your head, but you should be able to understand the drivers of the model to provide a timely and insightful answer to these kinds of questions. Blindly accepting the output of a model is foolish and extremely dangerous.
Learning from other people’s models is often helpful, but it’s rarely efficient to build a model using their templates. Trying to change things becomes difficult when a formula doesn’t change in the way you expect it to, and a nuance will come back to haunt you because you didn’t understand the financial model to begin with. You may think that a template will help you save time, but in the long run, it will end up costing you more time and lead to potential error. Although building your own model can be time-consuming, you’ll no doubt be far more comfortable with the results. Not only will you be able to vouch for the accuracy of the calculations, but during the model-building process you’ll improve your modeling and Excel skills.
 Never trust someone else’s work, or take the outputs of his model at face value. When inheriting a model, your choices are to start over and build your own model from the ground up or validate and verify the existing model to the extent that you’re comfortable to take responsibility for the calculations. Starting over to build your own model from scratch is inefficient and a waste of resources. Unless the model is in extremely poor shape, it’s usually far more efficient to use what you already have — but leave no cell untouched during the process of validation and verification.
Inheriting a File: What to Check For
When you’re inheriting someone else’s model, the best-case scenarios is a model handover meeting where you can sit down with the person who built it and he can take you through all the various moving parts. Unfortunately, this kind of meeting is rarely practical. Usually, the original modeler is unavailable and you’re thrown in the deep end, having to figure out how the model works on your own. A good modeler will have built the model in such a way that it can speak for itself, without the need for additional explanation. It will flow logically and have good documentation, labels, and instructions that make it easy to navigate and figure out how to use. Any model you build in the future will contain these features, but the model you inherit may or may not include them.
In the absence of any training or handover documentation, when you first start using someone else’s model, there are a few things to look for when you first open up the file.
Meeting a model for the first time
When you open a financial model someone else has given you for the first time, take some time to get acquainted with it. If you’re planning to make this model your own, and take responsibility for its outputs, you’re going to be spending quite a bit of time together. Familiarize yourself with the layout and how it’s built. In particular, pay attention to the following:
- Formatting: Get used to the formatting, and decide whether you’re happy with the formats they’ve used, particularly the color scheme, and decide if you want to change it. Are all formulas and hard-coded values formatted differently? Does it match your company colors?
- Formulas: Take a look at the formulas. Are they consistent? Do they contain any hard coding? A good way to see all the formulas at once is to select Show Formulas on the Formula Auditing section on the Formulas tab on the Ribbon, or just press Ctrl+`. For more information on formula auditing, see the “Using Audit Tools to Find and Correct Errors” section later in this chapter.
-
Workbook calculations: Most of the time, calculations happen automatically, so that when you change something in the model, the formulas change as well. Sometimes, however, when a file is very large, or a modeler likes to control the changes manually, the calculation has been set to manual instead of automatic. I’ve spent many happy hours auditing a formula, wondering why the numbers aren’t changing, only to discover that there was nothing wrong with the formula at all — the automatic calculation was simply turned off!
To check this setting, choose File ⇒ Options. In the Options dialog box, select the Formulas section and check that the calculation options at the top of the dialog box have been set to automatic instead of manual. Alternatively, a quicker way to access these settings is from the Calculation section of the Formulas tab on the Ribbon. Select the Calculation Options button and you can switch between manual and automatic calculation from the drop-down options that appear. If you see “Calculate” in the status bar in the lower-left corner of the screen, you know that the workbook is set to manual calculation.
- Error checking: An easy way to see at a glance whether there are any Excel errors in a sheet is to press the Error Checking button in the Formula Auditing section of the Formulas tab of the Ribbon. This will look across the entire sheet and alert you to an Excel error values that you should be aware of. See Chapter 13 for more information on what kind of errors you might encounter and how to handle them.
-
Named ranges: Many models contain named ranges, which is not a problem, but they often harbor errors due to redundant names and external links. Review the named ranges in the Name Manager, which is on the Formulas tab of the Ribbon, and delete any named ranges that contain errors or links to external files, or that are not being used. For more information about the use of named ranges in a financial model, see Chapter 6.
Figure 5-1 shows an example of a model showing multiple error values in the Name Manager.

FIGURE 5-1: The Name Manager showing multiple named ranges containing error values.
Inspecting the workbook
Excel has a fantastic tool called Inspect Workbook that’s a great way of getting to know the hidden features of your model and identifying potentially problematic features that would otherwise be very difficult to find.
To use Inspect Workbook, press File. On the Info tab, click the Check for Issues button, as shown in Figure 5-2.
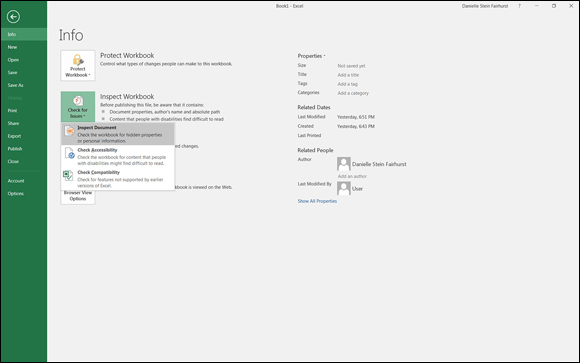
FIGURE 5-2: Accessing the Inspect Workbook tool.
The text under Inspect Workbook will tell you immediately the potential issues you should know about. Then under the Check for Issues button, there are three options to choose from: Inspect Document, Check Accessibility, and Check Compatibility.
Inspect Document
This feature is by far the most useful when it comes to checking inherited files. It checks for the sorts of things that can cause problems for you if you’re planning to use this file in the future. The great thing about it is that it checks all these items in one go — you don’t have to go in and check each item one at a time.
When you select Inspect Document, you’re prompted to save the file. Click yes, and the Document Inspector dialog box (shown in Figure 5-3) appears. This dialog box lists all the things the Document Inspector can check for. Leave all the check boxes selected, and click Inspect.

FIGURE 5-3: The Document Inspector dialog box.
After you’ve clicked Inspect, any potential issues will be flagged, as shown in Figure 5-4. Scroll down the list and take a look at anything that has been flagged. You can decide whether you’d like to remove the features from the workbook here and now, or ignore them and come back to it later.

FIGURE 5-4: Potential issues flagged in the Document Inspector.
The inspect workbook feature is great for identifying problem-causing features in your model. It’s not that helpful for resolving them. It provides a summary of all the items the tool has found, and it gives you the option to remove these immediately from the workbook. This is not a good idea. Instead of simply stripping a whole lot of features (and accompanying data) from your model, take the time to understand what each of the features is, think about why the modeler might have included them in the model, and whether you need them going forward.
For example, the tool may discover that there are hidden sheets in the file. If so, it gives you the option to delete those sheets immediately without looking at them. The sheets probably contain important information, and your formulas may link to cells in those hidden sheets, so accepting the recommendations of the Document Inspector will very likely cause more problems than it solves.
If you do remove features through the Document Inspector, there is no Undo option. Make sure you save a copy of the file first, just in case!
 Another use of the Document Inspector is to remove additional information before passing on a file to someone else — sort of like selling your old cellphone on eBay and making sure all personal information is removed first.
Table 5-1 lists the potentially problematic features the Document Inspector checks for. If the Document Inspector finds any of these features, refer to this table to find out why you need to be concerned about each item and what to do about them.
TABLE 5-1 Inspect Document Features
|
Feature |
Why It Matters |
What to Do about It |
|
Comments and annotations |
Quickly find any comments a previous author has included. This might include any instructions or documentation about model inputs or assumptions on how it has been calculated that you need to know. |
Read any instructions another modeler may have left for you. |
|
Document properties and personal information |
Every file contains “metadata” such as the name of the author, last saved data, and file path and so on, which is all useful information, especially when you don’t know where the model has been. |
See who built the model originally, see when it was last saved, and make sure you’re using the latest version. |
|
Data model |
If you’ve used the data model (which is unlikely unless you’re using Power Pivot), it will check for embedded data not visible on the sheets. |
Take note if these exist. |
|
Content add-ins |
Unless you know specifically what the add-in is doing, you should remove it. |
The easiest way to remove it is to allow the Document Inspector to remove it. |
|
Task pane add-ins |
Unless you know specifically what the add-in is doing, you should remove it. |
The easiest way to remove it is to allow the Document Inspector to remove it. |
|
PivotTables, PivotCharts, cube formulas, slicers, and timelines |
You might not realize that the model contains PivotTables and related features. This is important because PivotTables don’t refresh automatically the way formulas do. |
Be sure to refresh any PivotTables, make sure they’re still accurate, and ensure that any slicers or timelines still work properly. Remove them if no longer needed. |
|
Embedded documents |
Someone may have embedded files within the document. It’s an unusual practice, but if they’re there, you probably want to know about it. |
Open the embedded document to see if it contains information you need. |
|
Macros, forms, and ActiveX controls |
These contain executable code, and if they’re contained in the model, you’ll want to know about it. I don’t advocate the use of these tools unless absolutely necessary. Keeping models as simple as possible is important, and these tools are quite difficult for the casual modeler to use. |
Find out what these tools are doing in the model, and remove them if no longer necessary. The code might be critical for model functionality so you should get an expert who knows VBA (the macro coding language) to take a look before you remove it. Saving the file in XLSX format instead of XLSM will remove any executable code. |
|
Links to other files |
These are dangerous because if the source file changes, the data could change in your model without your realizing it. |
To see if links exist in your model, select Edit Links from the Connections section of the Data tab in the Ribbon. The Edit Links dialog box will display a list of all external links in the file. If links exist, check to see if they’re accurate and still necessary. If not, remove them by selecting the link in the Edit Links dialog box, and pressing Break Link. This will quickly convert all cells containing external links to their hard-coded values throughout the model. |
|
Real Time Data (RTD) functions |
The RTD functions will refresh data automatically from real-time data servers into Excel, such as stock prices. |
Locate them by searching for RTD within the sheets’ formulas. Review the accuracy of the formula and delete if no longer necessary. |
|
Excel surveys |
Someone may have created an online survey that feeds into your model. The questions may be entered in Excel Online, but not visible in the workbook. If a survey is there, you’ll want to know that that’s where your data is coming from. |
Test the form and make sure it’s still working. Remove the survey functionality if it’s no longer needed. The easiest way to remove this is to allow the Document Inspector to remove it. |
|
Defined scenarios |
Scenario Manager may have been used on this model, and all the scenario information may be stored in the scenario and may not be visible on the sheet. |
Select Scenario Manager from the What-if Analysis button on the Forecast section of the Data tab. You can view the scenarios separately, or click Summary to see a summary of all the inputs and outputs that have been saved in the Scenario Manager. If scenarios are needed, consider using an alternative method of scenario analysis (see Chapter 8 for more information on scenarios). |
|
Active filters |
If filters have been activated, some data is not visible on the sheet. This can cause problems when using formulas or copying and pasting. For example, you might add up a list of items, not realizing that a filter has been applied and that you aren’t looking at the entire list. |
The filters won’t cause you any problems unless they’re applied, so there is no need to remove them entirely. Clear the filters by selecting Clear from the Sort & Filter section on the Data tab. This way you can apply the filters in future if needed. |
|
Custom worksheet properties |
Someone may have customized the worksheet properties. Unless you know specifically why he’s done it, you should remove it. |
The easiest way to remove custom worksheet properties is to allow the Document Inspector to remove it. |
|
Hidden names |
If hidden names exist in your model, they’re unlikely to be of much use to you. Unless you know specifically why someone has used them, you should remove them. |
You can’t manually remove hidden names without using VBA, so the easiest way to remove them is to allow the Document Inspector to remove them. |
|
Custom XML data |
Unless you know specifically why this is in your model, you should remove it. |
The easiest way to remove this is to allow the Document Inspector to remove it. |
|
Headers and footers |
Headers and footers are easily missed because they don’t show up in the soft copy unless you print or print preview. |
Choose File ⇒ Print to see a print preview. Look for headers and footers and check whether they contain any important information. Click Page Setup toward the bottom of the page to change them. |
|
Hidden rows and columns |
Hidden rows and columns are very common and are the cause of one of the most common errors in financial modeling. Not realizing that hidden rows are in the model and might be inadvertently included or not included in sum totals is extremely dangerous. You definitely want to know if hidden rows or columns are contained in the model. |
Highlight the row or column before and after the hidden one, right-click, and choose Unhide to unhide them. It’s okay to hide rows and columns to tidy up the model and not show everything you don’t need to see, but it’s better practice to use grouping instead. To apply grouping, select the entire row or column you want to hide, and select Group from the Outline section of the Data tab. |
|
Hidden worksheets |
Hidden worksheets are less dangerous than hidden rows or columns, but if you’re taking over a model, you’ll want to know exactly what’s on the hidden sheets. |
Right-click one of the sheet tabs at the bottom and choose Unhide. You’ll need to unhide each hidden sheet separately. |
|
Invisible content |
A common cause of invisible content is when people copy and paste data from a website and invisible objects come with it. Removing invisible content is highly unlikely to cause a problem. |
To find objects, you can use Go To Special (Ctrl+G) and select objects, but the easiest way to remove it is to allow the Document Inspector to do so. |
Check Accessibility
This option checks to see whether people with disabilities might have trouble accessing any of the features of the file. For example, all visuals and tables should have alternative text to help people who can’t see the screen understand the image.
Check Compatibility
This option checks whether the file uses new tools available in this version of Excel that aren’t available in previous versions of Excel (see Chapter 2).
 If you’re not planning to share the file with anyone using previous versions of Excel, you can leave any new features in, but if you aren’t sure what version of Excel your users may have, you may want to consider replacing them. For example, if you’ve created a waterfall chart using the template that first became available in Excel 2016, you might want to replace it with a chart using the dummy stack or up/down bars method so that users of previous versions of Excel will not simply see a blank square where the chart should be. For instructions on how to do this, see the article at
 www.plumsolutions.com.au/waterfalls.
Using Audit Tools to Find and Correct Errors
When inheriting a model, there are several factors to come to grips with: the layout, design, formatting, assumptions, and formulas. Of all these, following the formula calculations is the most difficult, and verifying and validating formulas can be very time-consuming. The fastest way to understand a formula when you see it for the first time is to go into Edit mode. Double-click a cell, or select it and press F2. If the formula’s source inputs are on the same page, they’ll show visually where the source data is coming from that feeds the cell calculation, as shown in Figure 5-5. The color codes are helpful; each range in the formula will be the same color as the highlight source data that feeds it. If you’d like to try this out for yourself, download File 0501.xlsx from www.dummies.com/go/financialmodelinginexcelfd. Open it and select the tab labeled 5-5.

FIGURE 5-5: Using Edit mode to see formula inputs.
When you’re in Edit mode and you decide that you need to change the range the formula is referring to, you can use the mouse to click and drag the colored lines to reference a different cell. For example, in Figure 5-5 if you wanted the range B3:B12 to be A3:A12 instead, click the colored line showing between the A and B column and drag it so that the cell reference is column A instead of column B.
On the Formulas tab in the Ribbon, there is a formula auditing section that contains a number of tools that you’ll find useful when trying to understand someone else’s financial model. Just remember that using these audit tools in Excel is not the same as performing a formal financial model audit.
A formal financial model audit is a very detailed process in which a model auditing team takes the model apart and checks it meticulously for errors. If the bank is lending you money based on the results of the financial model, one of the conditions of the loan might be that the model be audited to make sure that the results can be relied upon. Getting a model professionally audited can be an extremely expensive undertaking, but it’s really the only way to ensure that there are no errors. Note that a financial model audit is sometimes called a model review to differentiate it from a financial audit.
Of course, creating your own financial model is a lot more interesting than checking someone else’s. But Excel’s audit tools make checking someone else’s model somewhat easier. Formula errors are the most common type of error in financial models, and the audit tools exist almost solely for the purpose of finding these formula errors.
Checking a model for accuracy
The formula auditing tools can help get to the root of what’s causing the error in a cell through tracing relationships among cells within your worksheet. These tools will help you find the source of an error, but they’ll also, more important, help you find an error you didn’t know was there. By tracing the relationships, formula auditing lets you test formulas to see the precedents (cells that directly supply the formulas) and the dependents (the cells that depend on the results of the formulas). Excel also offers a way to visually reverse any potential sources of an error in the formula of any particular cell.
The formula auditing tools can be found in the command buttons located in the Formula Auditing group on the Formulas tab of the Ribbon. These command buttons include the following:
-
Trade Precedents/Trace Dependents: In trying to understand a model, you’ll spend the majority of your time working through the formulas and making sure you understand exactly how each output has been calculated. Trace Precedents and Trace Dependents are good places to start when you’re trying to see where the cell links are coming from and going to. These tools are helpful to identify the linkages that exist between the cells and display the relationships visually with blue tracer line arrows.
To use Trace Precedents, start with an output cell that contains a formula you want to understand, such as the formula =SUM(B3:B7) in cell B8 in Figure 5-6. Select the cell and click the Trace Precedents button in the Formula Auditing section of the Formulas tab. This displays blue tracer line arrows, which show which cells B8 depends on.
Using the same cell, you can see which cells, in turn, depend upon B8 by using Trace Dependents, as shown in Figure 5-7.
Click the Trace Precedents or Trace Dependents button again, and it goes further and shows the precedent of the precedent, or the dependent of the dependent.If the source data is located on another sheet, instead of the blue tracer line arrow, a black dotted line appears with the worksheet icon, as shown in Figure 5-8.
Cells that are the cause of errors will show as red tracer arrows instead of blue. When the cell links to external files, the source file must be open so that the Formula Auditing tool can trace these dependencies.
The tracer lines disappear when the file is saved. You can manually remove them by clicking Remove Arrows under the Trace Dependents button on the Ribbon. Make sure you remove the arrows before printing the sheet; otherwise, they’ll show up in the printed document. You can also jump to precedent cells by using these shortcuts: - Ctrl+[ to jump to and highlight precedent cells
- Ctrl+] to jump to and highlight dependent cells
- Ctrl+G or F5 and then Enter to return to the previous cell

FIGURE 5-6: Trace Precedents.

FIGURE 5-7: Trace Dependents.

FIGURE 5-8: The black dotted line indicates a link to an off-sheet source.
Making sense of the formulas
Of the tools that are contained within the Formula Auditing section of the Formulas section on the Ribbon, Trace Precedents and Trace Dependents are most likely to be the most useful. There are a few other tools, however, which also warrant a mention.
-
Evaluate Formula: Another way of checking formulas is to actually take them apart using the Evaluate Formula tool. This tool is most useful with long and complex nested formulas because it evaluates each part of the formula separately in the current cell that you’re in, as shown in Figure 5-9.
You can also evaluate a partial formula manually by selecting a part of the formula and pressing F9. You have to select an entire section of the formula that makes sense in its own right; for example, in a nested formula such as =IFERROR(IF(E3<$F$1,-E3/D3,0),0), shown in Figure 5-10, you can select this portion of the formula: E3<$F$1. If you then press F9, the result of that portion of the formula alone will be displayed as a value, which in this case is FALSE. You can see that the statement being evaluated is false, so the “value if true” part of the formula will be the result of the statement, rather than the “value if false.” (For more information on using IF statements, see Chapter 7.) -
Error checking tools: If you make a mistake — or what Excel thinks is a mistake — a green triangle will appear in the upper-left corner of the cell. This happens if you omit adjacent cells, such as the error that is shown in Figure 5-11, or if you enter an input as text that looks like it should be a number.
In this instance, Excel provides a very helpful notification that the formula in cell B8 does not include the entire range above it, which is highly likely to be an error. This menu gives you various options to help correct the error.
This error checking feature adheres to a number of rules that Excel uses to correct errors, or what it defines as errors, such as inconsistent formulas, cells omitted from a formula, or numbers entered as text. Cells that contravene these rules will trigger the error checking feature and be marked with a green indicator.
Although this error checking feature is often helpful, many modelers find it irritating, so you can turn it off or edit its rules by selecting the Error Checking Options at the bottom of the menu shown in Figure 5-11. The Excel Options box, shown in Figure 5-12, appears. There, you can turn off the error checking entirely by unchecking the Enable Background Error Checking option, or change the errors it alerts you to by changing the options in the Error Checking Rules section at the bottom of the dialog box.
Another part of Excel’s error checking feature can be accessed via the Error Checking or Trace Error options, also in the Formula Auditing section on the Formulas tab in the Ribbon. As shown in Figure 5-13, the error checking option will find any Excel errors on the sheet, and then the Trace Error tool will apply Trace Precedents to find the source of the error.
-
Watch window: Another tool in the Formula Auditing section of the Formulas tab in the Ribbon is the Watch window. If you have output cells you’d like to keep an eye on, this tool displays the result of specified cells in a separate window. The Watch window is useful for testing formulas to see the impact of a change in assumptions on a separate cell or cells.
For example, in the integrated financial model you create in Chapter 12, you can add a watch to the ending cash flow. As shown in Figure 5-14, select the cell you want to monitor — in this case, cell N42 on the IS Cash Flow sheet. Click the Formulas tab in the Ribbon and then select the Watch Window button in the Formula Auditing section. When the Watch Window dialog box appears, click Add Watch, as shown in Figure 5-14, and then click the Add button.
The current value of $19,624 appears in the Watch window. This window remains onscreen no matter where you go in the model, and always shows you the current value. This tool is particularly useful in sensitivity analysis. For example, by going to the Assumptions page and changing the consumables cost from 45 cents to 50 cents, the value in the Watch window changes from $19,624 to $18,567, as shown in Figure 5-15. You can see this in the Watch window easily without having to jump backward and forward in the model to see how input changes impact the model’s outputs.
-
Show Formulas: If you want to look at all the formulas and not the resulting values, you can use the Show Formulas option in Excel. This is also a very quick and easy way to see if any hard-coded values exist. For example, in Figure 5-16, you can see that there are hardcoded “/12” values in rows 20 and 21.
Note that Show Formulas can also be applied using the Ctrl+` shortcut. (Note that ` is usually located on the ~ key at the upper-left of the keyboard.)

FIGURE 5-9: The Evaluate Formula tool.

FIGURE 5-10: Auditing part of the formula manually.

FIGURE 5-11: Error checking.

FIGURE 5-12: The Excel Options dialog box.

FIGURE 5-13: The Error Checking tool.

FIGURE 5-14: The Watch window.

FIGURE 5-15: Using the Watch window to monitor the impact of changes in inputs to ending cash flow.

FIGURE 5-16: Using Show Formulas to uncover hard-coded values.