Chapter 2
Getting Acquainted with Excel
IN THIS CHAPTER
![]() Comparing different versions of Excel
Comparing different versions of Excel
![]() Introducing Modern Excel
Introducing Modern Excel
![]() Recognizing the pitfalls of using Excel
Recognizing the pitfalls of using Excel
![]() Exploring alternatives to Excel
Exploring alternatives to Excel
For most people, Microsoft Excel and financial modeling go hand in hand. Given the title of this book, it should come as no surprise to you that I assume you’ll be using Excel. In order to build a financial model, you need at least a working knowledge of Excel. So, before jumping into the details of financial modeling, I’m going to introduce you to the tool you’ll be using, Microsoft Excel.
Almost every financial model you’ll come across will make use of Excel to some extent, but alternatives to Excel do exist, as do add-ins to improve Excel, both of which I cover in this chapter. Finally, I look at some of the issues and risks related to the use of Excel, just so you know what to expect.
Making Sense of the Different Versions of Excel
Every few years, Microsoft brings out a new version of Excel. For users who are comfortable with the way their version of Excel works, these changes are often met with apprehension or dismay. But for avid Excel fans like me, each new release is a cause for excitement! I’m always eager to find out what new tools and features have been introduced to improve the process of building financial models in Excel.
Although major changes have been applied to Excel over the past few versions, the changes are less relevant for financial modelers than they are for some other folks. Why? Because many of the new features are visual, and financial modeling relies less on visual features and more on links and formulas, which haven’t changed.
 Some new functions have been introduced in recent versions of Excel. If you build a model that contains these new functions and a user opens it in a previous version of Excel, he’ll get a #N/A error. I recommend avoiding new functions when you’re building a financial model, unless you’re sure that anyone who needs to use your model will be using the same version of Excel as you.
 If you’re not sure whether you’ve used any functions or features not available in previous versions of Excel, use the Inspect Workbook tool (see Chapter 5) to find out.
And if you’re not sure which version of Excel you’re using, open Excel and choose File ⇒ Account ⇒ About Excel. At the top of the dialog box that appears, you’ll see the version number. If that doesn’t work, then you’re probably using a very old version; choose Help ⇒ Resources ⇒ About.
A rundown of recent Excel versions
In this section, I walk you through some of the features introduced in recent versions of Excel. Although these lists are not exhaustive, they are the features you’re most likely to use for the purposes of financial modeling and analysis.
If you have Excel on an Office 365 subscription plan, you get new features as soon as they roll out with each update, instead of having to wait for the next version of Excel.
Microsoft Excel 2016
In Excel 2016, the following features were added:
- The Tell Me What You Want to Do box was added to the Ribbon. This box is a very user-friendly way of finding your way around Excel.
- The following new charts were added: Waterfall, Treemap, Sunburst, Histogram, Box & Whisker, and Funnel. These new charts are a welcome addition to Excel and make it very easy to display the results of your financial model. But remember that if you insert any of these new charts into your model and a user opens it in a previous version of Excel, the charts won’t be available — they’ll only be able to see a blank white box.
- Power Query was changed to Get & Transform. It’s on the Data tab on the Ribbon. In prior versions of Excel, Power Query had to be installed as a free downloadable add-in, but Get & Transform comes standard.
- Forecast Sheet was added. It’s a very powerful way of forecasting using historical data.
-
The following new functions were introduced. Note these functions are only available in Excel 2016 to Office 365 subscribers:
- TEXTJOIN: Use this function to link the text in ranges of cells together. This is one of my favorite new functions because you can now string entire ranges of cells together, instead of linking them individually as you had to do with the ampersand (&) or the CONCATENATE function.
- CONCAT: Use this function to link the text in individual cells together. This was called CONCATENATE in previous versions. You can also use the ampersand (&) instead of CONCAT or CONCATENATE.
- IFS: Use this function if you have multiple conditions to include in a single cell. This function makes using a nested IF function much easier.
- SWITCH: Use this function to look up a list of values and return a matching result in a single cell.
- MAXIFS: Use this function to calculate the maximum value that meets specific criteria.
- MINIFS: Use this function to calculate the minimum value that meets specific criteria.
 Even though these new functions might come in handy, they won’t work properly if the person opening your model is not using Excel 2016 or later.
Microsoft Excel 2013
In Excel 2013, the following features were added:
-
Flash Fill was introduced. Flash Fill is a handy tool that picks up on the pattern of what you’ve entered.
To use Flash Fill, start typing an abbreviated version of your data in the column directly next to it, as shown in Figure 2-1. Based on the pattern of what you’ve typed, a grayed-out version of suggested text is displayed. Press Enter to accept this data. If you’d like to try this out for yourself, you can download File 0201.xlsx from
www.dummies.com/go/financialmodelinginexcelfd. Open it and select the tab labeled 2-1. - The Combo Chart was introduced as a standard chart. Combo Charts display a line chart and a bar chart on two different axes. For example, you might choose to show customer numbers on one axis and profitability on the other, as shown in Figure 2-2.
- Multiple monitors were made easier to work with because the interface changed so that you can have two separate files open and view them side by side. In the past, you would have had to open a completely new session of Excel to do this, so you couldn’t link between files. Whether you link between files or not, having large and/or multiple monitors is definitely recommended for large and complex models!
-
Fifty new functions were introduced, enhancing the already abundant function set. Most of the new functions are used for statistics, trigonometry, and engineering, but here are a few that you might find useful for financial modeling:
- PDURATION: Use this function to return the number of investment periods required for the invested amount to get to the specific value.
- IFNA: Use this function to suppress an #N/A error only.
- ISFORMULA: Use this function to return the value TRUE if the cell contains a formula. This function is similar to the ISERROR, ISNUM, and ISTEXT functions.
Even though these functions might come in handy, they’ll return an error if the person opening your model is not using Excel 2013 or later.

FIGURE 2-1: Flash Fill.

FIGURE 2-2: Combo Chart.
Microsoft Excel 2010
At first glance, there were no obvious changes introduced in Excel 2010, but this upgrade was actually deceivingly radical because it was the first version to introduce the Power Suite of tools, now called Modern Excel. Additionally, two other features made an appearance for the first time:
- Slicers: Slicers are a great way of filtering PivotTables.
- Sparklines: Sparklines are tiny charts in a single cell. They’re a great way of displaying trends in a small space.
Figure 2-3 shows an example of a PivotTable with a slicer on the left in column A and a series of sparklines in column D. When you select one of the regions shown in the slicer, the data for the PivotTable filters to show only that selection. Additionally, sparklines in column D show the trend over a 12-month period of that line item.
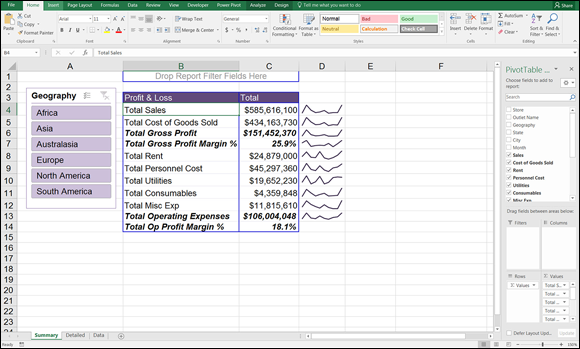
FIGURE 2-3: Slicer and sparklines.
These two features, although not related, work together so that when Africa is selected, for example, the total profit and loss numbers for Africa show only in column C, and the 12-month trend for Africa in the sparklines show only in column D. Both slicers and sparklines were particularly useful additions for building dashboards.
The space in which slicers and sparklines are built will simply show as blank areas if the file is opened in Excel 2007 or earlier.
Microsoft Excel Online
You can use Excel online through a web browser with Microsoft Excel Online. Microsoft Excel Online is completely free, works on any browser, and is useful for shared files and collaborating with others. It’s basically a stripped-down version of Excel.
Microsoft Excel Online is only sufficient for a casual user of Excel, not for a financial modeler. You need a desktop version of Excel in order to work through the steps in this book.
Focusing on file formats
Another thing that you may need to consider when working with different versions of Excel is the file type. Way back in Excel 2007, the file formats were changed from XLS to XLSX. The XLSX file format is more secure, faster, and more compact than XLS files. Also, XLS files are also limited to 65,000 rows, which sounds like a lot, but XLSX files can handle up to a million rows.
Although the XLSX file type has been around for many years, Excel files that have been downloaded from another system are sometimes automatically saved as XLS files. If you have Excel 2007 or later, you can save the file as XLSX by choosing File ⇒ Save As, and changing the file type from Excel 97–2003 to Excel Workbook.
You might also run into the XLSM file format. Those files contain macros, which contain executable code. If you’re using macros, Excel will prompt you to save the file as XLSM. And if you accidently save a file with macros in it as XLSX, all the macros will completely disappear!
The XLSB file format is a binary file format and is even more compressed than XLSX, making the file size even smaller (which means the files open and save much faster than other file types). It has the added advantage of supporting macros. The only disadvantage is that XLSB files can’t be read by other databases and software, including other cloud-based spreadsheet programs (although that’s not usually an issue for financial models).
You should always save your models as XLSX file types, or XLSB if file size becomes an issue.
Defining Modern Excel
Any version of Excel released from Excel 2010 onward is referred to as Modern Excel because it introduced the groundbreaking Power Suite, which consists of Power Pivot, Power Query (now called Get & Transform), and Power View (as well as Power Map and Power BI, which were added later). The introduction of these tools was the most exciting thing to happen in the Excel world since the PivotTable.
Table 2-1 offers a summary of the features of Modern Excel.
TABLE 2-1 Modern Excel Tools
|
Tool |
What It Does |
Programming Language |
Relevant Version |
|
Power Pivot |
Pulls much larger quantities of data than could be handled in standard Excel from different sources and stores it in a highly compressed format. Users can create relationships, perform complex calculations, and display output from different tables into a single-view PivotTable. |
DAX |
First introduced as an add-in to Excel 2010; native to Excel 2016* |
|
Power Query (Get & Transform) |
Extracts data from various sources. The user can cleanse and format the data and save this procedure; the procedure can then be repeatedly performed each time the data is refreshed. |
M |
First introduced as an add-in to Excel 2010; native to 2016* (when the name changed to Get & Transform) |
|
Power View |
Enables animation of charts (for example, showing movement of bubble charts over time). |
None |
Excel 2013 and 2016 (disabled by default) |
|
Power Map |
Allows you to dump some data into a table, containing location names, postcodes, or map coordinates, and Power Map shows your data visually on a map. Very cool! |
None |
Excel 2013 and 2016* |
|
Power BI |
A cloud-based, self-service analytics tool with which you can create dashboards, reports, and visualizations. |
None |
Desktop version first made available in 2015. Note that Power BI is the only tool mentioned that does not sit within Excel. |
* To access these tools, you need Office Professional Plus 2013 or Office Professional 2016. They are not available in the Home & Student Edition.
The self-service BI space, in particular, is growing rapidly, and there are many other pieces of software that can perform similar tasks. In my opinion, these Modern Excel tools are the way to go for handling and visualizing data for the following reasons:
- Low cost: Power BI Pro (with larger data capacity and enhanced sharing capabilities over standard Power BI) comes with a small monthly cost, but the other tools are included with your Excel license.
- Familiarity: Because they’re part of Excel, and mostly use the familiar Excel interface, existing Excel users can get the hang of it more quickly than completely new software — although Power Pivot can take some time to figure out.
- Integration: It’s pretty easy to convince the boss to implement these tools because they’re already part of Excel.
Many financial modelers I know don’t see these new tools as being relevant to them. Sure, they are data analysis tools as opposed to modeling tools, but modelers spend a lot of time extracting, updating, and manipulating data. Power Query, in particular, is a useful tool for performing these tasks more quickly and efficiently.
The Modern Excel tool that is the most likely to be used for modeling is Power Pivot. As a self-service BI product, Power Pivot is intended to allow users with no specialized BI or analytics training to develop data models and calculations, sharing them either directly in Excel or through SharePoint document libraries. You should consider using Power Pivot for the data in your model if any of the following is true:
- The data your model is using contains many thousands of rows and your model is starting to slow down, especially when you add formulas.
- You use PivotTables or tables extensively.
- Your data needs to be sourced from multiple locations.
The disadvantage of using Power Pivot is that, although you don’t need to be a BI specialist to view and edit reports, learning how to build models with Power Pivot is not particularly straightforward, even for advanced Excel users. You can get started on these tools with some free YouTube videos.
As a modeler, you’ll be using Excel all day every day, and you need to keep up to date with all the changes, including the new tools of Modern Excel, because Microsoft releases new updates regularly. Throughout this book, I recommend the use of these tools to access, retrieve, or update the data for your model, or to display the outputs, but in terms of building your financial model, I’ll stick with plain vanilla Excel.
For more information on some of the tools in Modern Excel, check out Microsoft Excel Power Pivot & Power Query For Dummies by Michael Alexander (Wiley).
Recognizing the Dangers of Using Excel
Financial modelers, like anyone working extensively with Excel, are very aware of the inherent risks involved. According to a study by Ray Panko, who is a leading authority on spreadsheet practices, close to 90 percent of spreadsheets contain errors.
Some managers treat models as though they are able to produce the answer to all their business decisions and solve all their business problems. It’s frightening to see the blind faith that many managers have in their financial models.
After reading this book, you should have a good idea of the importance of financial modeling in businesses today. The reliance on Excel-based financial models is so entrenched within the culture of many organizations, and the practice of handing “legacy models” over to junior staff who don’t understand how the models work is a widespread practice. Models that have been used over and over for many years are passed on and reused. As a consultant, I’ve seen this time and again — the user doesn’t understand how the model works, but he’s “fairly confident” it’s giving him the correct results.
According to both PwC and KPMG (http://www.theregister.co.uk/2005/04/22/managing_spreadsheet_fraud), more than 90 percent of corporate spreadsheets contain material errors. Considering the importance of spreadsheets in business, this risk is not one to be taken lightly. The European Spreadsheet Risk Group (EuSpRIG) was set up in 1999 purely for the purpose of addressing issues of spreadsheet integrity. They research and report on spreadsheet horror stories, which contain the latest spreadsheet-related errors reported in the media and how they could have been avoided. The disastrous consequences of uncontrolled use of spreadsheets are always disturbing, and make for somewhat gruesome reading.
I’m always terrified when people say that they’re going to go ahead with a multimillion-dollar project “because of the results of the financial model.” It’s very easy to get a formula wrong, or for the input assumptions to be just a few basis points out, all of which may well have a material impact on the output. Tweaking the input assumptions by just a few dollars either way can have a huge impact on cash flow, profitability, and the downright viability of a project!
We know that both formula and logic errors are very easy to make and prevalent in corporate financial models. As a financial modeler, you should be vigilantly looking for errors as you build the model. For strategies for reducing error in your models, turn to Chapter 13.
Although the major dangers of using Excel relate to its susceptibility to errors, the related issues of capacity and lack of discipline also warrant a mention. In this section, I take a closer look at each of these issues.
Capacity
Prior to Excel 2007, the maximum number of rows that Excel could handle was 65,000. That may seem like a lot, especially if you’re just getting started with Excel, but it’s nowhere near enough. The average Excel user would regularly run out of rows and have to resort to using Microsoft Access or keeping data in multiple workbooks to store the data. My, how things have changed!
From Excel 2007 onward, the number of rows was increased to over a million, which seemed like a big improvement at the time. In this age of big data, though, it’s still pretty easy to run out of rows, especially when you start running a few formulas down the column. Realistically, anything more than half a million rows becomes very slow using ordinary Excel.
 I still classify the lack of capacity of Excel as a danger because, despite all the new capabilities of Modern Excel, many of them are still being developed and few people are using them to their full capacity yet. To deal with the size limitations of Excel when working with large amounts of data, people are still cutting the data into various chunks, importing and exporting from Access or other databases to avoid having to store data, and deleting archived data, all of which are dangerous practices because they’re prone to error and are unbelievably time-consuming.
Lack of discipline
Excel is a highly flexible tool. You can pretty much do anything in Excel, but it doesn’t mean that you should! One of the reasons I love it so much is the lack of boundaries or restrictions. Most software forces you to use it in a certain way, but Excel allows you to type anything into any cell.
Now, as wonderful as it is to be without boundaries, it’s also incredibly dangerous and somewhat alarming. You know just how much damage can be done with an incorrect financial model, and the fact that there are no checks and balances — except what you as the modeler put into it — is a terrifying prospect.
Many of the best practices of financial modeling, such as those laid out in Chapter 4, have been created for the purpose of contending with this lack of discipline in financial models. Error checks, formatting, and rules about model layout, design, and structure are all designed to put some boundaries around a model, which, without them, becomes a dangerous tool in the wrong hands.
Errors
The possibility of error in a model is the number-one thing that keeps a financial modeler awake at night. As a modeler, you must have a healthy respect for spreadsheets and their susceptibility to error.
Imagine you’re working on an exciting new project. You’ve provided a financial model that’s being used for a project or key function of your business. It looks fantastic. People are fired up; money is being spent. But weeks or months into the project, the numbers suddenly aren’t adding up. Why is the project so far over budget? On review, you suddenly realize there has been an error in your original calculations. Yikes! Your credibility and confidence in your work are being questioned, leading to some uncomfortable moments during meetings (not to mention, concern over your future at the company).
The European Spreadsheets Risks Interest Group (EuSpRiG) runs a well-established annual conference to present the latest research and findings on the subject. There are many well-documented cases of high-profile Excel model blunders. Some of these are documented by EuSpRiG at www.eusprig.org/stories.htm. Given the reluctance of most businesses to talk about their mistakes, the number and frequency of the stories documented by EuSpRiG lead me to believe that errors in spreadsheets are a regular occurrence in most organizations.
What form can these errors take? Generally, modeling errors can be grouped into three broad categories: formula errors, assumptions or input errors, and logic errors.
Formula errors
Formula errors are the easiest errors to make and relatively easy to spot, but they’re horribly embarrassing when they’re discovered. These kinds of “mechanical” errors are also the easiest to avoid by self-checking and correction. Chapter 13 covers some techniques you should employ while building your model to reduce the possibility of formula errors.
A common formula error is simply picking up the wrong cell in the formula — for example, linking to cell B98, which contains 6, instead of cell B97, which contains 0.6. This error initially might seem quite minor, but let’s say your initial investment was $100,000. Through your modeling, you work out that there is 60 percent profit margin, but due to this error, you predict $600,000 profit instead of $60,000. Oops!
Assumptions or input errors
Your model’s formulas may be calculating perfectly, but assumptions in financial models are a textbook case of “garbage in, garbage out.” If the assumptions you’ve used as inputs are incorrect, the model will also be incorrect.
When it comes to input errors there are two main types to consider:
- Data input: Data input errors can easily occur if you’re updating operating costs, for example, on a week-to-week basis. If these costs aren’t linked correctly or refreshed regularly, you can get an incomplete or inaccurate picture of the process. Sometimes linking this information to a separate, automatically generated file and using some of the new Modern Excel tools such as Get & Transform (formerly called Power Query) can automate and expedite this process. Also, be sure to confirm who is responsible for updating the spreadsheet and make sure any changes to the process or update schedule don’t affect your model.
- User input: User input errors occur more frequently when you’re less familiar with the product or project you’re modeling. For example, when it comes to the salary costs of a program, you may factor in the benefits that an employee will receive and assume it will be 5 percent of her salary, which is a fairly standard across-the-board assumption. However, because you’re new to the organization, you may fail to take into account other factors that affect the employee’s benefits, such as an increase in the cost of delivering the dental and medical program that the company prides itself on. Suddenly, this drives the cost to 12.5 percent of salary, completely blowing out all the staff costs you’ve so carefully calculated.
If you’re making assumptions, you need to record them, consider them, and lay them out carefully in your model. (See Chapter 4 for more information about assumptions documentation.) It’s also a good idea to confirm these inputs with the key stakeholders.
The old saying “Too many cooks spoil the broth” most certainly applies to building a financial model. Unless you have a strict, collaborative set of standards that will ensure that the model is laid out and assumptions are entered consistently, you’ll achieve the best result by having only one modeler working to build the model. When it comes to using the model, however, anyone should be able to use a well-built model. If you’re worried about people messing up your calculations or entering inputs incorrectly, make sure your instructions and documentation explain how to use the model. Also, apply data validations or cell protection to the model to restrict changes the user can make.
Logic errors
Errors in the model’s logic are probably the most difficult to spot, because you can have the assumptions, inputs, and formulas all working perfectly, but the logic and methodology — the way the model is built — can still be incorrect. You must capture the logic and ensure that the builder’s approach is clear. Otherwise, if you lose the key person who built the model, confusion can ensue.
For example, in Figure 2-4, the model shows the percentage of the investor’s funds that have been loaned. The percentage has been calculated by dividing the investment balance (the current investment plus the new investment) by the portfolio balance (the current loans plus the new loans minus the loans expired).

FIGURE 2-4: Calculating investment portfolio ratios.
Hold on a second. Do you calculate it based on the number of loans written or the cumulative balance? You can see how the way the ratio has been calculated can cause confusion for those not familiar with this model. It’s important to document how you’re calculating it. You might also easily confuse monthly amounts with cumulative balance; you can see that this is clearly documented in column B.
Looking at Alternatives and Supplements to Excel
Excel is often called the “Swiss Army knife of software” or the “second-best solution” because you can do practically anything in Excel, but it’s not always the best tool for the job. You can write a letter in Excel for example, but Word is a much better tool for that purpose. You can keep your company accounts in Excel, but a purpose-built general ledger system will deliver a much better result.
Desktop spreadsheets are so popular because they’re easy to use to communicate ideas and strategies in an understandable business model. Working in an analytic role, the spreadsheet actually becomes part of the way people think about business issues and relationships — the tool shapes the very way you consider your approach. The spreadsheet tool actually becomes a part of the process of the analysis, so you’ll sometimes hear people say, “Let’s get this into Excel and see what it looks like!”
So, what are the other options available? Instead of assuming that Excel is the best tool for financial modeling, you should be aware of the alternatives, as well as some of the add-ins that supplement Excel specifically for the purpose of financial modeling. Here’s a list of some of the alternatives and supplements to Excel. Keep in mind that this isn’t a comprehensive list, and I’m not endorsing any of these products. These are just options worth your consideration:
- Data extraction and analysis: SAS, KNIME, Tableau, and Oracle-based tools are no doubt far more robust and secure than Excel solutions that pull data from other systems into Excel manually such as macros or Power Query in Excel. These kinds of enterprise-grade solutions are purpose-built for the extraction and analysis of data and are a good long-term solution, but they’re often difficult to use and they take a long time to implement due to lack of familiarity.
- Planning and performance management: Anaplan and Tagetik are alternate cloud-based options that are designed to replace spreadsheets altogether. These tools offer powerful capabilities that support analysts in forward planning and making confident decisions based on data rather than spending their time correcting errors.
- Excel add-ins for model building: Modano is a modular content management and sharing platform for Excel, enabling pieces of spreadsheets to be reused, shared, and linked to save time and reduce risk. Its main application is financial modeling, but it can be used to modularize any spreadsheet. Instead of replacing Excel, Modano improves Excel and combats some of its inefficiencies and shortcomings. Modano replaces BPM, an older Excel add-in that systemized the implementation and review of spreadsheet best practices.
- Excel add-ins for auditing: Spreadsheet Advantage, Spreadsheet Detective, Spreadsheet Professional, and OAK are Excel add-ins that can help develop and review financial models. They interrogate a spreadsheet in extreme detail to help identify where you might have an error. The software produces key statistics on any spreadsheet, such as the number of unique formulas, where the formulas can be found across each sheet, and the relationships between sheets. It also produces a map of each cell to indicate whether that cell is a text, number, new, or consistent formula.
- Dashboards and data visualization: Once you’ve finished building your financial model, you may like to display the results in a chart or a dashboard. This can be done on the front sheet of an Excel workbook, in Microsoft Power BI, or using one of hundreds of other purpose-built data visualization and dashboarding tools. One such tool is Modeler, which can transform your model into an app with no coding, using just Excel and PowerPoint. The most popular non-Microsoft tools at the moment are Tableau and QlickView, but this area is growing rapidly. See Chapter 9 for more information about how to present your model output using standard Excel tools.
- Budgeting and forecasting: Many of the models you’ll build are for the purpose of budgeting and forecasting — and then reporting on those budgets and forecasts. Most major general ledger systems have additional modules available that are built specifically for the purpose of budgeting, forecasting, and reporting. These tools provide a much easier, quicker method of creating budgets and forecasts that is far more robust and less error-prone than using Excel templates. Hundreds of budgeting and forecasting tools are available; some of the most popular are Board, Oracle (JD Edwards), TM1 (Cognos), and Adaptive Insights.