Chapter 3
Planning and Designing Your Financial Model
IN THIS CHAPTER
![]() Determining and designing the problem that the financial model needs to solve
Determining and designing the problem that the financial model needs to solve
![]() Looking at the difference between two courses of action using scenario analysis
Looking at the difference between two courses of action using scenario analysis
![]() Working with and extrapolating time series data
Working with and extrapolating time series data
![]() Structuring your models
Structuring your models
Planning and design can sometimes be the most difficult part of building a financial model — especially for those of us whose skills are more technical and numerical than visual. When building your model, you need to pay close attention to the design layout and ensure that it’s clear, coherent, and logically structured. Even a very simple model can become complex if poorly designed, and a well-designed model will be so logical that it will simply speak for itself.
 Before jumping in and starting to build the model, take a moment to think about what your model needs to achieve — this will help with the design build.
Identifying the Problem That Your Financial Model Needs to Solve
A financial model is usually built in order to answer a question or to solve a problem. For example, the question “Should I purchase this new asset?” could result in a model containing cash flow analysis, which compares the cash flow if the asset is purchased versus if it is not purchased. “How much should I pay for this new asset?” is an entirely different question, and the answer will be a single number or a range of possible numbers.
 You need to identify the problem before beginning the model-building process.
For example, if the model you’re building is for the purpose of making a decision, you need to build at least two scenarios — one with the existing business and one including the new venture — as well as a comparison between them. Modelers sometimes call this a “do nothing” versus as “do something” scenario. So the model will consist of three components:
- “Do nothing” scenario
- “Do something” scenario
- Scenario comparison
In the example shown in Figure 3-1, a small bus company has serviced two bus routes for many years. The financial model shows 12 months of historical data and has forecast the next 12 months. Due to a change in demographics and a new train line servicing the area, ticket sales for the northern route have been declining consistently, and the company expects this trend to continue. If the company does nothing, as shown, the profits will more than halve over a two-year period.
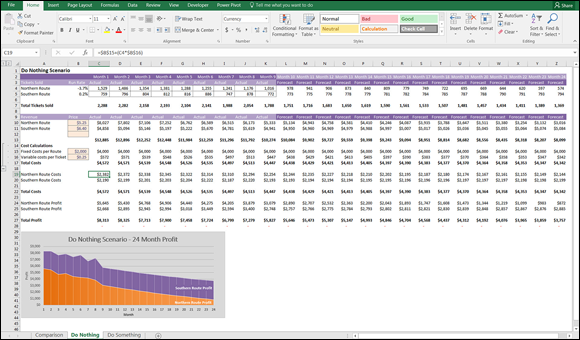
FIGURE 3-1: “Do nothing” scenario
You can download a sample copy of this model in File 0302.xlsx at www.dummies.com/go/financialmodelinginexcelfd.
You start building this model by creating the three tabs and determining that the comparison sheet should contain a comparison between the two scenarios. Then you design the “do nothing” scenario and then look at how different the numbers are if the company adds a new bus line.
Keeping models consistent is important. For this reason, the “do nothing” scenario contains an extra blank row in each block of data, which is where the new western route can be inserted. The Total Profit line is shown in row 27 of both scenario pages, which makes the model easier to follow, and less prone to error when linking the charts and summary page to the outputs.
Because this model is quite small, you don’t need separate input and assumptions sheets, as you do with larger models. The inputs and assumptions are listed within the scenario sheets themselves.
If the company decides to put on a new route to service the western regions, you can replace some of the lost sales from the northern routes with the new service. In the “do something” scenario shown in Figure 3-2, you can see that although not all the lost profitability has been recouped, the bus company is still viable.

FIGURE 3-2: “Do something” scenario.
When using a financial model to make a decision, you need to look at the difference between the two scenarios. If you only look at the “do something” scenario in isolation, it doesn’t look particularly appealing.
Figure 3-3 compares the two scenarios to help decide on a course of action. You can see from the comparison sheet that the best course of action would be to “do something” — assuming, of course, that these are the only options available to us.

FIGURE 3-3: Comparison between scenarios.
Designing How the Problem’s Answer Will Look
When you’ve identified the problem that needs to be solved, it’s very tempting to dive straight in and begin the model-building process, but it’s a good idea to stop for a moment to plan the model and determine how the output will look. When it comes to building a financial model, you want to start with the end in mind.
Start by creating a mockup design of the output page. You can do this in Excel, or by simply sketching it on a whiteboard or paper. It can be difficult to visualize what the output will look like until you have the data in it. Modelers aren’t often the most artistic types, but you should have at least some idea of the elements that need to be on the output page.
For example, for a business case, let’s say you want to show the net present value (NPV), internal rate of return (IRR), and payback period. To do this, you need cash flow, so the key elements will be revenue and expenses, from which you can derive profitability, and then the NPV, IRR, and payback. You could flesh out the outputs page something like the design shown in Figure 3-4.

FIGURE 3-4: Initial design of business case output page.
Then, having completed the financial model, you decide to include some scenario analysis, as well as the customer numbers. The final output page ends up as shown in Figure 3-5. For more information about displaying data visually, see Chapter 9.

FIGURE 3-5: Completed business case output page.
When you have the numbers in the model, you should try to include at least one chart. If you’re not sure how the data will look visually, you can highlight a range of numbers, go to the Insert tab of the Ribbon, and in the Charts section, press the Recommended Charts button. This gives you a preview of what the data will look like displayed in the chart.
Often, the output of a financial model will be in the form of a dashboard, which is a great way of displaying a lot of information clearly and concisely. Building dashboards in Excel has become so popular in recent years that I run dedicated training courses on dashboard reporting, which are particularly popular with financial modelers who need to display the output of their financial models. Figure 3-6 shows a sample output of a financial model such as the financial statements model built in Chapter 10. You can download a sample copy of this model in File 0303.xlsx at www.dummies.com/go/financialmodelinginexcelfd.

FIGURE 3-6: Dashboard output of a financial model.
Here are some tips for designing a dashboard to display the output of your financial model:
- Don’t overwhelm your users with numbers on a dashboard. Wherever possible, show visuals and charts instead of numbers. Use data labels or a data table (as shown in the lower-left corner of Figure 3-6) if you want to show numbers on a chart.
- Use contrasting techniques, such as color, bold, and shading to highlight key points. But don’t rely on color alone to show your message, because models are often printed in black and white.
- Align objects so they line up tidily.
- Make sure the model fits neatly onto one page. That way, people can easily print it and refer to it (without needing a magnifying glass).
- Apply the “golden triangle.” Your key message or the most important information should be placed in the upper-left corner — this is where readers will look first.
- Put some effort into the color scheme. Excel randomly allocates standard colors (usually red and blue) to charts, but you should change the colors to match your model theme or company colors to add professional “polish” to your model.
- Avoid the traffic light combination of red, yellow, and green. The difference between red and green isn’t obvious to those who are color blind. (That’s around 8 percent of the male population!)
- Use icon sets. To apply them, highlight some numerical data and choose one of the sets of icons, such as ticks, crosses, or flags which appear when you click on Icon Sets under Conditional Formatting from the Styles section of the Ribbon. This will automatically add extra meaning to your dashboard without relying on color.
- Make sure the color you use has meaning. The colors should not be reused inconsistently. For example, if revenue is blue in one chart, the same blue should not then be used for expenses on another chart.
-
Use color sparingly. Many legacy models I come across in my consultancy work have very bright rainbow colors, which (aside from blinding the user) make it difficult to focus on the key components of the model. Using some color to make your model appealing is a good idea, but stick to a single color that matches your company logo (or your mood) and use different shades of the same color unless you want something to stand out significantly.
Some companies have standard color coding, but if your company doesn’t, you might consider developing a standard. Consider including a color code key on the cover page. The use of predefined styles found on the Home tab can make color coding very quick and easy. Many companies have their predefined color coding loaded as style templates, which ensures consistency in color coding in financial models. Here are some commonly used color codes that are supported by the built-in styles in Excel that you may consider adopting in your company: - Blue font and beige background for input cells
- Pink or gray for error checks
- Green or orange for external links
To match the logo of your company, find out the RGB color code and use this code to apply the exact same colors to your model’s headings, totals, or charts. Considering that millions of different colors are available in Excel, it’s almost impossible to pick the correct one by eye.
Gathering Data to Put in Your Model
A financial model is only as good as its inputs or source data, and a large part of the modeler’s job is often collecting, interpreting, analyzing, and even manipulating or extrapolating the data to go into the model. In many cases, as much time can be spent collecting data as is spent actually building the model, so if you can collect the data in the correct format in the first place, this could save you a lot of time.
You often have to obtain data you need to build the model from other people or external sources, which can be a frustrating and time-consuming process. Here are some guidelines that can make the data-gathering process easier:
- Let other parties know well in advance what information you need and its purpose.
- Give them a due date that is realistic for them and fits your time frame.
- Design the input sheets in your model so that the data can be pasted directly in.
- Use dummy data in the meantime if you need to so that you can continue building the model while waiting for the information to come in.
- Allow enough time to check the quality and reliability of the information that has been submitted.
- Make sure people know what you expect in terms of data quality. Does it need to be 100 percent accurate or is an estimate okay? Normally, model input data is simply taken at face value, and the source is documented in the assumptions. If an estimate is used, be sure to document it as such.
-
Be specific about what format you need the data in. Giving them a template to complete can prevent misunderstandings. For example, instead of a request like “Please provide information on key customer accounts,” which might yield a list of 500 customers and their addresses, a template like the one shown in Figure 3-7 would give better results.
Consider using protection to prevent incorrect entry, such as restricting inputs to either a “yes” or a “no,” as shown in column F of Figure 3-7. For instructions on how to use data validations, see the section on “Restricting user data entry” in Chapter 6. If you’d like to try this out for yourself, you can download File 0301.xlsx from www.dummies.com/go/financialmodelinginexcelfd. Open it and select the tab labeled 3-7.

FIGURE 3-7: Information request template.
Documenting the Limitations of Your Model
If other people are going to be using your model, be sure to explain the assumptions you made in building the model, especially if the person who is going to be using your model is not an experienced modeler. Users tend to put blind faith in the outcome of the model, which can be dangerous. Instead of taking the model results as gospel, the user should simply use them as a guide.
Models are only a construct that reflects reality; they are not reality. You can make this clear to users of the model by using language such as “Based on our forecasts …” or “Assuming trends continue… .”
In the example of the decision analysis model for the bus company case study (see the section “Identifying the Problem That Your Financial Model Needs to Solve,” earlier in this chapter), the builder of this model might say, “We’re going to lose half of our profit over the next 12 months,” which is not incorrect, but it would be more accurate to say, “Based on current forecasts, we’re going to lose half of our profit over the next 12 months unless we take action” and then show the inputs and assumptions used. For example, the modeler is assuming the following:
- Five hundred tickets will be sold in the first month of operation.
- Ticket sales will increase by 1.5 percent per month after the first month.
- There is no cannibalization between the routes. Often, when launching a new product, some existing customers switch to the new product. Seeing as the new route is servicing a new area, the modeler doesn’t expect any cannibalization and hasn’t included it in this model.
Considering the Layout and Design of Your Model
The problem that needs to be solved and the output required often influence the layout and design of the model. So, it’s not a bad idea to spend some time thinking about the layout before you get started. Not only do the layout and structure of the model relate to the logic and functionality, but they can also influence the look and feel of the model’s interface and how users navigate through the model.
When you’re building a model for the first time, you may have trouble knowing where to begin. The key elements of a financial model are
- Inputs or source data
- Assumptions documentation
- Calculations
- Outputs
When starting to build your model, start by laying out each of these elements in four separate tabs and think about what will go in each section. Separate each of these elements clearly. Although every model should contain these elements, not every financial model is structured in the same way. Unless a model is very small — like the bus company case study earlier in this chapter — there should be a dedicated tab for each major component of the model.
Structuring your model: What goes where
When designing the layout of a model, most experienced modelers follow these rules:
- Separate inputs, calculations, and results, where possible. Clearly label which sections of the model contain inputs, calculations, and results. You can put them on separate worksheets or separate places on one worksheet, but make sure that the user knows exactly what each section is for. Color coding can help with ensuring that each section is clearly defined.
- Use each column for the same purpose. This is particularly important when doing models involving time series. For example, in a time-series model, knowing that labels are in column B, unit data in column C, constant values in column D, and calculations in column E, makes it much easier when editing a formula manually.
- Use one formula per row or column. This forms the basis of the best-practice principle whereby formulas are kept consistent using absolute, relative, and mixed referencing, as described in greater detail in Chapter 4. Keep formulas consistent when in a block of data, and never change a formula halfway through.
- Refer to the left and above. The model should read logically, like a book, meaning that it should be read from left to right and top to bottom. Calculations, inputs, and outputs should flow logically to avoid circular referencing. Be aware that there are times when left-to-right or top-to-bottom data flow can conflict somewhat with ease of use and presentation, so use common sense when designing the layout. By following this practice, you can avoid having calculations link all over the sheet, which makes it harder to check and update. Excel will also calculate more quickly if you build formulas in this way because it calculates left to right, and top to bottom, so not only does it make your model easier to follow, it will calculate more efficiently.
- Use multiple worksheets. Avoid the temptation to put everything on one sheet. Especially when blocks of calculations are the same, use separate sheets for those that must be repeated to avoid the need to scroll across the screen.
- Include documentation sheets. A documentation sheet where assumptions and source data are clearly laid out is a critical part of any financial model. A cover sheet should not be confused with an assumptions sheet. A model can never have too much documentation!
Defining inputs, calculations, and output blocks
Typically, modelers work from back to front when building their models. The output, or the part they want the viewer or user to see, is at the front, calculations are in the middle, and source data and assumptions are at the back. Like the executive summary, a board paper, or another report, the first few pages should contain what casual viewers need to see at a glance. If they need further information, they can dig deeper into the model.
Here are some guidelines of what might be included on each tab in your model:
-
Cover sheet: Although not always included, the cover sheet contains many details about the model. Of course, the cover sheet is not much use unless you keep it up to date. If you decide to include a cover sheet, you may add details such as the following:
- A log of changes and updates to the model with date, author, change details, and their impact on the output of the model, which can help with version control
- The purpose of the model and how it is intended to be used going forward
- Who originally wrote the model and who to contact with questions
- Table of contents
- Instructions on how to use the model
- Disclaimers as to the limitations of the model, legal liability, and caveats
- Global or key assumptions integral to the use of the model
In my experience, cover sheets and instruction pages are rarely used. If you decide not to include a cover sheet, make sure that the model contains explicit instructions regarding operation, purpose, assumptions, source data, and disclaimers. - Input sheet: This is the only place where hard-coded data should be entered. There may be one or more input sheets if there are large amounts of data, but the input data should be laid out in logical blocks.
- Output, summary, and scenario sheets: These present the final outcomes. They may also contain scenario drop-down boxes or user entry fields that allow the users of the model to generate their own outputs. This section might also contain a dashboard.
- Calculation or workings sheets: Split the calculation sheets logically and then, within each sheet, set them up consistently. If the calculations become long and confusing, it makes sense to split them into logical sections. For example, they can be split by type of service, customers, financial tables, geographical location, or business segments. If calculation sheets are split, ensure that the layout and formatting are as consistent as possible across all sheets.
- Error check sheet: This sheet contains links to all error checks in the model. Error checks should be performed in the calculation section, but a summary of all error checks in one location means that once the model is in use, the modelers can quickly check to see if any of the error checks have been triggered.
Determining your audience
Who will be viewing or using your model in the future? If it’s for only your own use, you should still follow good model design but there’s no need to spend a lot of time on the formatting to make it look cool. You should still add assumptions and source documentation for your own reference even if you know that no one will ever look at it.
No matter who you think is going to use your model, you should always adhere to the rules outlined in Chapter 4.
There are a few types of people who could comprise your model audience:
- Professional modelers: If your model is for a large-scale investment or if money is being lent based on the outcome of your model, you can expect that professional modelers are going to want to “look under the hood” of your model to take it apart and audit it. You can greatly reduce the cost of an audit by using consistent formulas to reduce the number of unique formulas in the model (see Chapter 4). Do not hide sheets or attempt to protect parts of the model — it will only frustrate the professional modeler who will want to see how your numbers were calculated.
- Occasional modelers: Some models will be used by people for whom looking at models is only part of their job — you yourself perhaps fall into this category. They know their way around Excel but aren’t really interested in understanding the intricacies of the entire model. They just want to make sure it’s working properly because they need to rely on the numbers and perhaps they need to use it by changing some of its numbers from time to time. When building a model for the occasional modeler, you want to make the model as easy to follow as possible. Keep it streamlined, and don’t clutter the output pages with unnecessary detail. Move any detailed and less important assumptions to the back so that they can be referred to only if necessary.
- Nonmodelers: Sometimes your model will be viewed or used by members of the board, salespeople, or marketing folks for whom modeling or using Excel is not part of their everyday lives. For example, you might be producing a sales dashboard report that is produced every week and the user simply needs to change the drop-down box to look at a different product or region. You want to make the output pages as simple to use and as appealing as possible for a nonuser of Excel. For some ideas on dashboard design and using color, see “Designing How the Problem’s Answer Will Look” earlier in this chapter. The user is unlikely to want to take the model apart and look into the formulas, so to simplify the way the model looks, you might consider hiding the calculation sheets and perhaps even the data sheets — with or without a password.
Password protection should only be used as a deterrent to prevent nosy colleagues. It’s not a security system and should not be relied upon as such. Search the web for Excel password remover, and you’ll find plenty of software available that can remove the password.
In conclusion, planning and designing a financial model is a critical part of the model build. It takes a unique mixture of logic, clarity of thought, and graphic layout skills by the financial modeler to build a well-designed model, and this often proves to be difficult to implement in practice. Model design can sometimes be the most difficult part of building a financial model and it is, in my experience, one of the most difficult aspects to teach and learn. Learning how to build a well-designed model comes with experience. But a faster way to develop design skills is to critically assess other models you come across, taking note of what works and what doesn’t, and then applying it to your own models.