Monitoring
To ensure the availably and reliability of your SharePoint 2010 farm, daily monitoring of the physical servers, operating system, and important SharePoint 2010 services should be performed. Performing preventative maintenance and checking nightly backups will prevent larger issues from happening later down the road. This will also allow for maximum uptime and ensure that Service Level Agreements (SLAs) are being met. A daily checklist should be established so that key components within the SharePoint farm are not overlooked. This process will also establish an initial baseline of the farm so that it will be more apparent when and if problems arise. The checklist should utilize the following items and review the information:
- SharePoint 2010 Health Analyzer
- SharePoint 2010 Unified Logging Service
- SharePoint 2010 Timer Jobs
- Windows Server Event Logs
- SharePoint 2010 Usage Data and Health Data Collection
- SharePoint 2010 Web Analytics
This section will describe the monitoring tasks performed in each of the items found in the preceding list. For those more serious SharePoint installations, Microsoft System Centers Operations Manager may be used to monitor these same items.
Database maintenance is an important piece of the overall health of the SharePoint farm. This function is typically performed by a database administrator (DBA) and therefore falls outside the scope of a typical SharePoint farm administrator. For more information about database maintenance for SharePoint 2010, the following white paper available in TechNet is a great resource: http://technet.microsoft.com/en-us/library/cc262731.aspx.
SharePoint Health Analyzer
SharePoint has many features that log and monitor the health of the farm, the details of which are summarized and analyzed for potential issues within the farm. If issues are identified, the Health Analyzer will proactively look for a solution or recommend a potential fix for the issue. The Health Analyzer can be found in Central Administration, within the Monitoring section, and then in the Health Analyzer section. However, if the Health Analyzer finds an issue, a notification will be present at the top of the Central Administration home page. In many of the solutions you will find a “Repair Now” option, which, when selected, will resolve the problem. Those issues that do not have this option will have a hyperlink that leads to more information about the issue and recommends a solution.
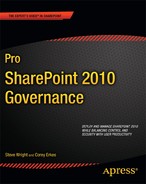
The Health Analyzer is preconfigured to look at a set of predefined rules to monitor SharePoint. The predefined rules are broken down into four categories: security, performance, configuration, and availability, as shown in Figure 8-5. However, these rules can be extended and custom rules can be created to better support your environment. More information about the configuration of the Health Analyzer can be found at http://technet.microsoft.com/en-us/library/ee663484.aspx.
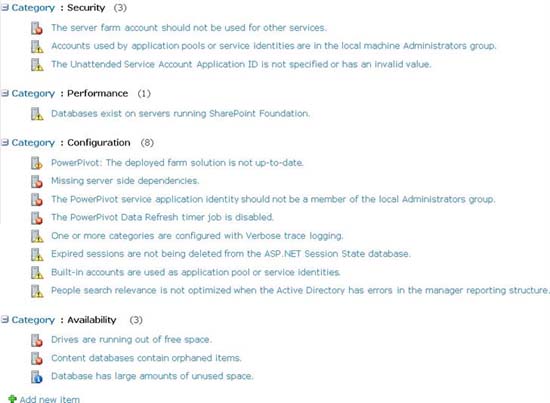
Figure 8-5. SharePoint Health Analyzer
SharePoint 2010 Unified Logging Service
The SharePoint Unified Logging Service (ULS) provides a centralized location for all error and information logging messages related to SharePoint and its services. Even though these logs can sometimes be difficult to review, they provide the best overall insight into issues within the farm. The default location for the logs is C:Program FilesCommon FilesMicrosoft SharedWeb Server Extensions14LOGS, even though it is best practice to put these on another drive so it doesn't fill up the drive and crash the server. Because these logs are so difficult to read, a number of tools have been created to better interrogate these logs. One of the more popular ULS log viewer tools is available on CodePlex at http://ulsviewer.codeplex.com/. If you find this tool doesn't fit your needs, a quick Bing search will show results of many more similar tools that are available to make viewing the ULS logs much easier.
Trace logs can quickly consume a large amount of disk space, especially when configured with settings other than the default. To manage this growth, administrators can change the default settings to better serve their environment. For example, by default, log files are kept for 14 days. However, an administrator has the option (disabled by default) of placing a maximum on the overall disk space that the log files can consume.
SharePoint 2010 also introduced a logging database, WSS_Logging by default, which can provide further information and is accessible via the SharePoint object model. A good overview of this feature can be found at http://sharepoint.microsoft.com/blogs/fromthefield/Lists/Posts/Post.aspx?ID=124.
Usage Data and Health Data Collection
In addition to Diagnostic Logging, SharePoint Server 2010 also logs information related to the overall health of the farm, using web analytics and health data collection. This new SharePoint 2010 feature can be found within Central Administration, under Monitoring, and under the Reporting section. As an administrator you have the ability to monitor individual events, such as feature use or page requests. As with Diagnostic Logging, these operations add additional overhead and need to be managed appropriately. However, the collection of the data can be scheduled to minimize the performance impact. Figure 8-6 shows the Configuration usage and health data collection options, which can be found within Central Administration ![]() Monitoring
Monitoring ![]() Configure web analytics and health data collection link.
Configure web analytics and health data collection link.
Figure 8-6. SharePoint web analytics and health data collection
Timer Jobs
Timer jobs are an important piece of SharePoint monitoring as these tools rely on timer jobs to perform monitoring tasks and collect monitoring data. Timer jobs run on a set schedule that can be configured out of the box. You may want to change the schedules that the timer jobs run on to collect data more frequently or less frequently. You may also want to disable jobs that collect data if you are not interested in the data they return. More information about configuring the SharePoint Health Analyzer timer jobs can be found here http://technet.microsoft.com/en-us/library/ee748593.aspx.
Event Throttling
Event throttling enables administrators to filter out events based on event type or severity. If the farm is experiencing an issue with a certain service or component, an easy way to gather more information about the issue is to change the event level and trace level within the issue category. The default settings for all categories are as follows:
- Event Level: Informational
- Trace Level: Medium Level
After completing troubleshooting in which event throttling was turned up, all categories within the Diagnostic Logging should be returned to their default state. This can be done by selecting the “Reset to default” option within the throttling dropdowns. The settings not currently set to default will appear in bold font. More information on event throttling can be found at http://technet.microsoft.com/en-us/library/ee748656.aspx.
Correlation IDs
Correlation IDs are GUIDs that are assigned to each user conversation within SharePoint. The GUID is provided within error messages, normally found displayed on a SharePoint page after an error has occurred. This GUID can then be used to quickly find any corresponding entries in the ULS logs. Correlation IDs also cross multiple servers, so if an issue arises that crosses multiple machines, the single Correlation ID can provide a complete overview of all requests.
Windows Server Event Logs
The Windows OS also provides an event log similar to the SharePoint logs. Even though this log will contain information that is not specific to SharePoint, it is a good practice to review these logs daily because issues within the OS can potentially lead to farm downtime as well. The logs to review should include the Application logs, Security logs, and the System logs. These logs can be accessed from the OS Start Menu within Programs ![]() Administrative Tools
Administrative Tools ![]() Event Viewer.
Event Viewer.
Web Analytics
SharePoint 2010 Web Analytics provide detailed reports on how your SharePoint environment is being used, and how well it is performing. Administrators should use the reports to become familiar with how the environment is being used and to plan for future capacity or farm growth. Web Analytics is broken down into three areas: traffic, search, and inventory. Then each of these three areas is broken down again by web application, site collection, site, and search service. For more information about SharePoint Web Analytics, visit http://technet.microsoft.com/en-us/library/ee663487.aspx.
Traffic
The traffic reports show statistics such as the following:
- Total number of page views
- Top browsers
- Top visitors
Search
The search reports help the administrators understand how search is being utilized. They provide statistics such as the following:
- Total number of queries (number of searches performed)
- Average number of searches per day
In addition, search reports also provide statistics on “Best Bets.” These search terms can then be discussed as an enhancement to the “Best Bets” already being provided by the search feature.
Inventory
The inventory reports help the administrators with storage, providing statistics such as the following:
- Disk usage
- Total number of site collections
- What languages are in use
In addition to the items described above, SharePoint backups should be monitored to ensure that they are occurring and should be tested to guarantee that a valid restore can be performed from the backup. This includes farm- and site-level backups, as well as content database backups. Disk space must also be monitored on each server in the farm, including the SQL server. The SharePoint logs consume a large amount of disk space if not configured properly, and issues can occur if additional logs cannot be added.
Backup and Recovery
In smaller SharePoint environments, it's common to perform a full farm backup weekly with a backup of each site collection nightly. This is often scripted through the use of Windows PowerShell and scheduled via the Windows Task Scheduler. Because all business needs vary, and the SharePoint farms themselves vary, it's important to work with the business and understand any Service Level Agreements that are in place in regards to system uptime and the recovery level needed. Determining what to protect, how to recover, and what tools to use to satisfy both is a good start in planning your backup and recovery process. This is a large topic, much of which is defined in great detail in the Plan for Backup and Recovery article on TechNet at http://technet.microsoft.com/en-us/library/cc261687.aspx.