
2 Drivers for Telecommunication Network Evolution
2.1 Market of Telecom Carriers
The telecommunication market has been, for a long time, characterized by a set of very specific features that distinguished it from all other markets.
Up to the early 1990s, there was almost no competition due to the legal monopoly existing in the main western European countries and the practical monopoly existing in the United States.
As a matter of fact, in all the western European countries, telecommunication services were managed by a single carrier, either directly owned by the administration itself or operating under an exclusive contract with the administration [1].
The situation was quite different in the United States, where after the split of old AT&T in 1984, the long-haul network was managed by a group of competing carriers (the new AT&T, MCI, …) while monopoly remained in the local networks. In particular, any local area was served by different regional bell operating companies (RBOCs), all coming from the original local structure of the old AT&T [2].
The U.S. situation was richer in terms of players, and competition was created in the long-distance segment of the network. However, these competing long-haul carriers were not in control of the services provided to the final users, but simply delivered transport capability to the local carriers. Services managing carriers, RBOCs, were on the contrary, in a practical monopoly situation due to the geographical separation of their areas of business.
Both in the Far East and in eastern Europe, the development of telecommunication services was a step behind the United States and western Europe and, at least in communist countries, was often more influenced by political reasons than by a real need coming from the users.
Also, under the product offering point of view, the telecommunication market was quite a particular one.
The customer base of telecommunication carriers was divided into two big categories— business and consumer customers—where revenues coming from consumers were much higher in the typical case than revenues coming from business customers.
The product offered to the consumer market was essentially built around telephone service. Adding a new feature to the plain telephone (e.g., added value services, a network-located memory to trace lost calls and so on) implied a complex engineering development since it had to be implemented in the software of the telephone digital switches, very complex machines constituting the core of the network.
Due to the lack of real competition and the amount of effort needed to design and upgrade the switches, all telephone carriers offered the customers essentially the same service profile, with a noticeable difference existing only in the United States and western Europe.
As far as business customers are concerned, the product offering dedicated to them was quite richer. Besides plain telephone and dedicated lines to support the multiplexed data coming from corporate switches (Private Automatic Branch eXchange [PABX]), data traffic were also required.
In order to convey data generated from business customers, the technology put at the designer’s disposal different techniques from the integrated services digital network (ISDN) and frame relay protocols [3] that were able to embed data in a time division multiplexing (TDM) frame, to the complex and performing asynchronous transmission mode (ATM) [4,5], using both statistical multiplexing and statistical switching.
Generally, frame relay and ATM networks were superimposed on the telephone network, constituting a second, independent telecommunication infrastructure dedicated to business customers.
At the beginning of the 1990s, a big evolution happened both in the market and in the available technologies. The Internet revolution brought about a sudden evolution in transmission and switching techniques and a complete redesign of the telecommunication network. The end result of this huge effort is the network that we have today.
The process to produce this result was not smooth, but involved a rapid and huge growth of the value of the telecommunication market, the so-called telecommunication bubble, and the subsequent market crisis, that in a certain measure still affects the telecommunication market today, more than 10 years from the bubble end.
The main driver of the evolution, started in the early 1990s, was the diffusion of the Internet among small businesses and in the consumer market via the dial-up connection. The impact of this phenomenon is shown in Figure 2.1.
In this figure, the average traffic per day and per active user line in the United States is represented in terms of bit/s/line. Reported on a day (24 h), the traffic of 11 bit/s/line represents an average time of about 2.5 min/day at a transmission speed of 64 kbit/s.
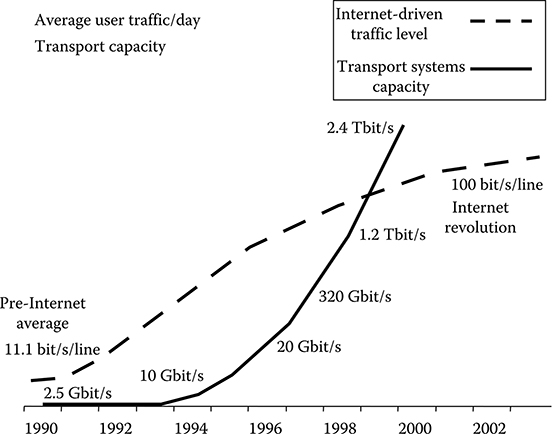
FIGURE 2.1 Average traffic per day and per active user line in the United States is in bit/s. As an example, reported on a day (24 h), the traffic of 11 bit/s represents an average time of about 2.5 min at a transmission speed of 64 kbit/s.
(After Iannone, E., Personal Elaboration of Ovum.”Capex Conundrum” report, Ovum, s.l., 2003.)
From now on, for simplicity, we will refer to 64 kbit/s as the telephone standard bit rate. All the discussions are easily adapted to the cases in which the standard bit rate was different, for example, 56 kbit/s.
In conclusion, the average traffic in the pre-Internet era was constituted by 2.5 min of phone calls per day per active line.
At the end of the analyzed period (2001–2002), the traffic increased at about 25 min of phone calls per day per active line. Of course, this increase was not due to the fact that the average person increased the duration of the phone calls by a factor 10, but the fact that the phone line was used via the dial-up connection also to browse the Internet.
From Figure 2.1, it is also clear that the traffic curve almost saturates, due to the fact that the average person tends to limit his or her use of the Internet if only the dial-up connection is available. Thus, in order to completely unfold the potentiality of the Internet, it was needed to provide the user with a greater capacity access line.
Figure 2.1 also reports the evolution of the capacity of the most advanced commercial long-haul transport systems in the years of the first Internet revolution. The capacity increased from 2.5 Gbit/s (typical capacity of a high-performance SONET/SDH transport system in 1990) to 2.4 Tbit/s (the capacity of a 10 Gbit/s, 128 channels wavelength division multiplexing [WDM].long-haul system, the most advanced commercial long-haul system in 2002) Perhaps, there is no other example in the history of the engineering of a key technical performance of a widely used product that increased three orders of magnitude in 10 years.
This evolution was possible due to a huge research and development effort that brought to the market, in a very short time, an impressive number of new technologies, from single-mode semiconductor lasers to optical amplifiers and from optical modulators to low-loss WDM passive elements.
All this effort required a great injection of money into the telecommunication market, as shown in Figure 2.2, where the evolution of the capital expenditure of the U.S. carriers is reported in the considered period [6].
Two important points of discontinuity can be observed in the figure, corresponding to specific events in the market.
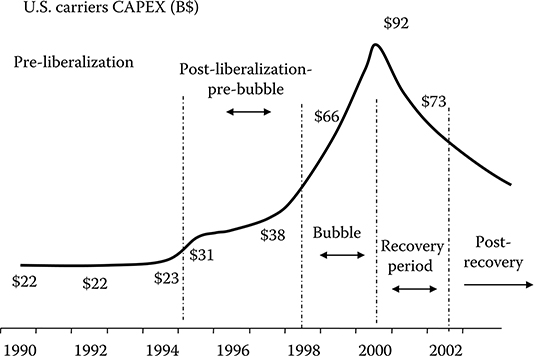
FIGURE 2.2 Evolution of the capital expenditure of U S. carriers in billion dollars.
(After Iannone, E., Personal Elaboration of Ovum.”Capex Conundrum” report, Ovum, s.l., 2003.)
The first is related to the U S. market, in particular to the telecommunication act of 1996, which opened the access market to competition, introducing the concept of access unbundling and abolishing the monopoly of the RBOCs [7,8].
The second discontinuity, located around 1997, is related to the effort to develop the network under the pressure of the first Internet revolution.
Looking at Figures 2.1 and 2.2, a comment immediately emerges. The traffic increased from 1991 to 2002 by a factor of about 10, while the carrier revenues increase was much less, due to the decrease in prices. In the technical field, from 1990 to 2002, the long-haul capacity increased by a factor of 1000, while the access capacity remained almost constant (at least for the great majority of the users still having a 64 kbit/s standard phone line)
This huge increase in the long-haul capacity was paid by an increase of about a factor 4 in the carrier capital expenditure (CAPEX), and by an even higher increase in the network operational expenditures (OPEX) All this capital was not injected in the market by end users, whose individual expenditure for telecommunication services was not increased (and in many cases was even decreased due to the price behavior), but by financial players that were hoping to exploit the financial gain driven by a fast-growing market.
In the absence of a relevant capital injection into the market from end customers, this situation was destined to be only temporary. In a few years, the debt of the telecommunication carriers was so big to prevent them from continuing their investment policy. The carrier CAPEX had a sudden collapse (see Figure 2.2), and a great crisis struck the market.
This was a structural crisis, deeply anchored to the way the market developed. The only possible solution was to induce the end customers to inject more money into the market to sustain its growth.
The key of this strategy was individuated in the introduction of new telecommunication services so as to drive an average revenue per customer (ARPU) increase. In order to do that, it was needed to increase the capacity of the customer access line.
For this reason, after the end of the telecommunication bubble, all the major European and U S. carriers started a wide renewal of the access network in order to provide more bandwidth to the end user as a support to a new generation of telecommunication services.
Renewing the access network is perhaps the most CAPEX-intensive operation a carrier can undertake, due to the extreme geographical spread of this part of the network, which arrives with an access termination at every user location.
This extremely CAPEX-intensive operation was undertaken by carriers with a difficult financial situation due to the debts generated in the bubble period.
The carrier strategy was also influenced by another element that brought about a deep market change—market liberalization and globalization.
In the United States, the telecommunication act of 1996 [7] extended the competition to the access market allowing the growth of a great number of competitive local exchange carriers (CLEXs) that started operations almost all over the United States. Of course, these new companies were not able to deploy a completely new access network, and competition was allowed by enforcing the incumbent RBOCs to operate network unbundling.
Network unbundling is the procedure allowing a CLEX to deploy its own access equipment in the incumbent access central office and to rent the access line from the incumbent at a price determined by a public authority.
A similar evolution took place in western Europe, where in these years almost all the public incumbent carriers were transformed in private companies and the unbundling was introduced to allow competition.
Many of the new carriers born during the bubble expansion were not able to survive the following crisis, but a few of them were sufficiently stable to survive. The telecommunication market coming out from the bubble in 2002 was definitely a competitive market in all its segments, both in Europe and the United States.
Besides liberalization, after the collapse of the communist governments in eastern Europe and with the evolution of China and other Far East countries, the telecommunication market started to become a globalized one.
China and India, in particular, beginning from the period of the bubble end started to become very important players, both as a potential market for telecommunication equipment and, in the case of China, as the home country of a few key telecommunication equipment vendors.
The growth of the telecommunication market in the Far East was characterized by great speed during the period in which the crisis was hitting harder in Europe and the United States. As a matter of fact, the development of Far East society had to be sustained with the fast development of a modern telecommunication infrastructure, and local administrations were in many cases more than willing to at least partially finance this operation.
To give an example, in 2006, South Korea was the first country in the world to install a widely diffused optical fiber, WDM-based access network [9], using a very new technology, even if standards were not yet consolidated and the selected technology was supplied by a single, small U S. company. Though at that time probably the business case of this operation was not positive for the Korean carrier, the deployment of the new access network was seen as a strategic step in the modernization of the country.
The combination of the bad financial position of the main carriers, of the presence of competitive carriers based on unbundling, and of the growth of new markets in eastern Europe and the Far East drove the evolution of the access network toward solutions that did not require a change of the copper cable infrastructure already deployed for the telephone service.
This was done by exploiting a technology development that was made available around the same time—with the development of cheap asymmetric digital subscriber line (ADSL) chips, it was possible to convey on the copper access line much more capacity than the 64 kbit/s of the standard telephone line.
To use ADSL on the copper access lines, access equipment had to be changed, passing from access telephone switches to broadband digital subscriber line access multiplexers (DSLAMs), but no new access cable had to be deployed, completely exploiting the available infrastructure. These solutions were thus ideal both to limit carrier CAPEX and to allow unbundling to be implemented.
The period from the telecommunication bubble end in 2001 to the present time can be called the second Internet revolution, dominated by the penetration of ADSL broadband access, by the launch of a certain number of new broadband services, and by the global nature of the telecommunication market.
The progressive penetration of ADSL broadband access has increased the number of users that are able to use advanced Internet services as broadcast and on-demand video services. This situation is depicted in Figure 2.3 [10], where the broadband access penetration in various countries in 2005 is shown via a ball graph, referred to as the case of maximum penetration (the United States with about 49 million broadband lines) Since this is a 2005 data collection, the considered broadband lines are almost all ADSL lines.
From the graph it can be derived, as an example of globalization, that the broadband lines in China were almost 80% with respect to the United States (i.e., about 40 million), while in Italy, there were about 6.5 million broadband lines (13% with respect to the United States) out of a total of about 20 million access lines.
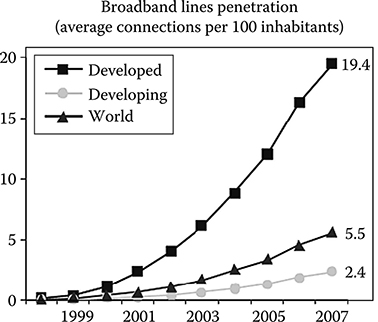
FIGURE 2.3 Increase of the average broadband lines penetration versus time for developed countries (e.g. USA, Germany, Japan) and for countries under development (e.g. India)
(After Public ITU-T report. Measuring the Information Society The ICT Development Index 2009,.ITU-T publishing, 2009.)
In spite of this very good penetration of broadband lines, there is not yet the desired increase in ARPU. As a matter of fact, prices of telecommunication services have experienced a great decrease in the last 10 years, and the introduction of new broadband services was not always sufficient to counterbalance it. As a result, the revenues of telecommunication carriers did not experience the desired increase [11].
Much more effective in pushing the carrier revenues was the introduction of mobile services. After the introduction of GSM in 1991, the success of digital mobile telephony in Europe was so big to justify the huge CAPEX needed to deploy a continental network covering almost all the populated areas and with easy roaming among all the relevant carriers [12].
However, up to the present time, mobile and fixed-line services are considered by end customers as separate products, and the success of mobile services does not have a positive influence on fixed-line revenue. Moreover, after a long period of growth, the mobile market started to slow down after 2005.
This effect is shown in Figure 2.4, where the global revenues and CAPEX for telecom carriers are shown versus time from 2006 to 2010 (where the 2008–2010 figures are forecasts) [11].
The average yearly growth rate is about 2%, quite low taking into account that it is positively affected both by the weakness of the U S. dollar with respect to the euro and the yen and by the mobile revenues that, in the considered period, are still growing faster than those related to fixed services.
As far as CAPEX is concerned, it is almost constant, a further proof of the state of stagnation of the fixed-line telecom market.
Due to these trends, the market of fixed-line services started to experience a structural state of crisis, mainly due to the imbalance between the investment and running costs needed to set up and maintain an up-to-date telecommunication network, and the amount of revenues related to service delivery. This condition is worsened by the fact that many carriers have a high debt that makes it difficult to carry out CAPEX-intensive operations.
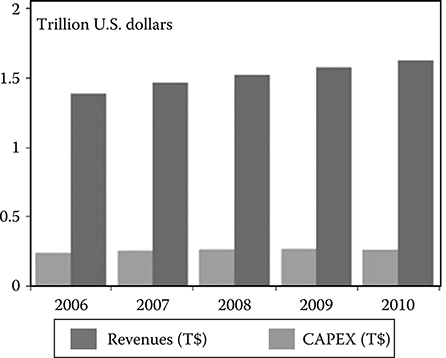
FIGURE 2.4 Global revenues and CAPEX for telecom carriers in trillion dollars versus time.
(After Saadat, A., Service Providers Capex, Opex, ARPU and Subscribers Worldwide, Infonetics, s.l., 2007.)
Exceptions are carriers in emerging nations like China, where the market is more dynamic due to the needs of completely new infrastructures and the contribution of local administrations.
In order to move the market out of this state of stagnation, a further evolution is needed in the service bundle offered to customers. Several analysts individuate in a bundle mainly based on centralized and pair-to-pair video services the key to overcome the crisis calling for a further increase in access network capacity.
It is a consolidated opinion that this further evolution of carrier service offering pushes, at least in the most populated areas, a recabling of the access network by some type of fiber optics architecture.
Besides bandwidth increase, the penetration of ultra-broadband connections stresses the capacity of existing copper cables to support a high number of very fast ADSLs. In many cases, copper cables deployed before the diffusion of broadband access presents a nonnegligible pair-to-pair interference when ADSL is used. This phenomenon often sets a limit to the number of connections possible in a given area, depending on the quality and length of the cables [13].
Last, but not least, the need of the main carriers to reduce operational costs also drives toward a fiber-optic-based access network. As a matter of fact, optical transmission allows a completely passive access infrastructure to be implemented. Moreover, much longer spans can be realized via passive optical networks (PON), opening the possibility of a delayering of the peripheral part of the network. In delayered architectures, local exchanges are almost completely eliminated in populated areas (e.g., cities), initiating the passive access network directly into the core nodes [14]. Eliminating a certain number of local exchanges further reduces OPEX, at the cost of a higher initial capital investment (CAPEX)
The first important market to move in the direction of a new, fiber-based access network was Japan, where NTT (the local incumbent operator) started to deploy fiber-based access in 2003.
Immediately after Japan, the U S. market experienced an evolution pushing toward fiber access. In the United States, cable television providers are diffused almost in all the populated areas. When the need of an ultra-broadband access emerged in 2004 and 2005, cable television operators proposed themselves as competitors to traditional telecommunication carriers using cable modems to convey traditional telephony and web browsing on CATV cable infrastructures.
Moreover, in 2005, the U S. administration introduced an important exception to the liberalization act stating that unbundling cannot be forced on completely new infrastructures, like fiber access networks [15].
This decision was based on the observation that unbundling relied on the fact that copper access was built with the help of the administration when incumbents were monopolists. Thus, they have a key business advantage that has to be compensated to preserve competition.
If a carrier completely rebuilds his network with no administrative help and in a competition regime, it has no advantage and there is no need to force unbundling on the new infrastructure.
The combination of these two facts moved the main RBOX (in particular Verizon, SBC, and Bellsouth) to start large projects for a new fiber-based access. These projects are still open today, even if revised in timing and dimension in pace with market evolution and with the change in the U S. carriers scenario due to the merger between AT&T, Bellsouth, and SBC on one side and MCI and Verizon on the other side.
Different from the United States, no derogation from the unbundling obligation has been approved in Europe, thereby causing a further delay in the evolution of the access network toward fiber-optic transmission.
In Europe, however, traditional carriers have to face a new competitor—utility companies. These companies are owners of some different, but pervasive infrastructure (e.g., power distribution or water ducts) and in many cases have a rich fiber network deployed using their own network. A certain number of such utilities, attracted by the potential ultrabroadband market, either entered the access market directly or rented to competitive local carrier their infrastructure.
Thus, while in the United States local carriers are disappearing by merging with long-haul companies, in Europe the inverse process is ongoing, with a set of competitive carriers emerging in the access area.
A paradigmatic case is that of Fastweb in Italy, the first carrier in Europe that was born in 1999, deploying a fiber-based access network, that today is present in several areas of north and central Italy [16].
To face this competition, European incumbents are also moving toward fiber-based access, even if no clear decision has been taken, with carriers involved in field tests and preliminary planning.
In this situation, it is clear that the telecommunication market today is menaced by stagnation and by financial weakness of the main carriers. Nevertheless, the push toward new technologies, in particular in the access, is strong both to gain advantage in a complex competitive scenario and to decrease the network operation cost.
2.1.1 Customer Base Impact on the Economics of Carriers
The first step to analyze today’s telecommunication market is to look at the final customer.
A tier one carrier has a customer base divided into three categories:
Private customers (the so-called retail market)
Business customers
Wholesale customers (i.e., other carriers renting network resources, including CLEXs using unbundling)
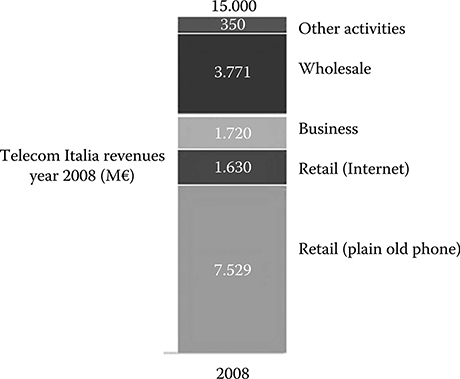
FIGURE 2.5 Revenue of Telecom Italia in 2008.
(From the public balance sheet.)
Private customers and business customers buy a service bundle from the carrier, which can vary from customer to customer and from carrier to carrier.
Considering an incumbent carrier, the revenues are mainly from the retail market and are still more from telephone rather than from Internet services.
As an example, in Figure 2.5 [17], the detailed analysis of the 2008 fixed-lines revenue stream of Telecom Italia is reported. From the figure, it is clear that as much as 43% of the global revenue in the retail market is due to telephone services. Revenue in the retail market from Internet services is almost as big as the revenue from business customers, and about half the revenue is due to wholesale.
This clearly states that the old-style products (telephone and wholesale, that quite often is simply capacity leasing) produce by far the bigger revenue.
Moreover, comparing fixed-line revenues with mobile ones (again considering the Telecom Italia case), the impact on the overall carrier revenue stream is 60% and 38%, respectively (with a 2% revenue from other sources) [17].
Since this situation is quite typical, an incumbent European carrier fights its main battle in the retail arena, the wholesale prices being mainly stated by the administrative authority.
Unfortunately, the retail market is also the most difficult; the cost of different telephone services is steadily decreasing, striking carriers hard, and the trend does not seem to stop.
The fast decrease of the cost of telephone services is largely due to the intense price competition that has emerged after the end of the bubble. However, the penetration of broadband lines has a role in this scenario, allowing broadband users to adopt alternative telephonic systems like IP-phone or Skype [18]. These services are free of charge or almost free of charge, and this cooperates to push down the cost of standard phone calls.
However, it is clear that Internet revenues are far from compensating for the loss of telephone incomes. Thus, in this situation, the more the imbalance in the carrier service offering toward Internet, the more the revenue decrease.
The situation is of course completely different for competitive carriers. In this case, the value proposition at the base of their proposal to leave the incumbent is generally a faster and cheaper access to Internet and the possibility to exploit it to sensibly reduce the cost of telecommunications. Thus, the success of the competitive carrier is linked to its Internet offering.
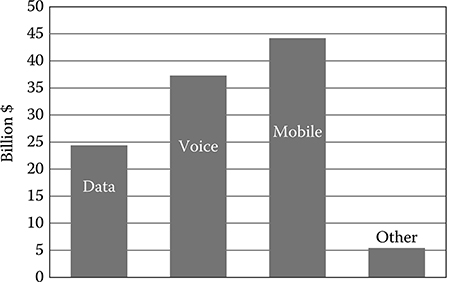
FIGURE 2.6 AT&T revenue in 2008.
(From the public balance sheet.)
In the United States, the situation is similar, with greater revenues generated from Internet services. As an example, the domestic revenue of AT&T is analyzed in Figure 2.6, which shows that wireline telephone gives 34% of the revenue while data services give 24% [19].
In the Far East, the situation is quite different. The development of a telephone network is often completely parallel to the development of the Internet.
The case of China Telecom is characteristic: The income of the company due to flat telephone lines is still almost four times the income from broadband lines [20]; however, the use of broadband is growing much faster, and in a few years, it will probably give more revenue when compared to plain telephone.
2.1.2 Broadband Services
After a long period in which the center of telecommunication services was the telephone, with the Internet and with the diffusion of broadband access, a plethora of new telecommunication services have been introduced.
Although every tier one carrier is able to offer the same services, what makes the difference is the bundle that is offered to the end user. As a matter of fact, a good bundle gives the user the impression that he is paying for only what he wants and allows the carrier to deploy efficiently the service-related equipment.
Starting from single services, services offered to the retail market can be divided into three categories:
Traditional telephone-based services
Data services
Multimedia services
Traditional telephone-based services are all the pre-Internet features of the telecommunication network: telephone calls first, then a set of other related features as network-based answering service, calling number identification, running telephone cost control, and so on. These services, which in telephone switched network were performed by digital telephone switches, are carried out by simulation using packet telephone machines in packet-based networks, so that the end user experiences no difference in service level.
All traditional telephone services are designed to be delivered to the user via the 64 kbit/s analog telephone line; however, they are generally also available for broadband users. In this case, either the broadband access line has a traditional telephone line in parallel (as in the ADSL case) or a packet-based simulation is devised when pure packet access is available (as in the case of all-fiber access)
Data services are services based on low-activity data transfer. The main example is web browsing. During web browsing, the activity of the browser is concentrated in short periods of time, when the user downloads web pages. During these periods, the data transfer has to be very fast, since web pages can contain any kind of multimedia elements.
During the largest portion of time, however, the user reads the web pages and the transmission line is not used. The resulting average activity is in general very low, critically depending on the browsing style of the user. However, activities as low as 1% are normal. In this condition, statistical multiplexing on the access network works at best and access resources can be shared among many users.
Other services of this category are instant messaging, e-mail, pair-to-pair file sharing, access to network databases (like online file repository), and a plethora of other services that do not require real-time data transmission.
Multimedia services are, on the contrary, based on real-time data exchange and are dominated by video streaming (either broadcast or on demand) and IP phone (e.g., either audio or video as the service provided by Skype)
It is clear that even if IP-based audio telephone imposes on the network severe requirements in terms of quality of service (QoS), the required bandwidth is not very high, being in general lower than 64 kbit/s, which is needed for traditional telephones. Thus, the class of services requiring a higher bandwidth is constituted by video services.
The bandwidth occupied on the access line by video streaming depends both on the video resolution and on the line code used for video coding.
Under the video resolution point of view, there are a great number of possibilities related to the different possible resolutions of the screen of a PC, but two cases are particularly important. These are the resolutions compatible with the television standards: standard television (SDTV) [21] and high-definition television (HDTV) [21]. As a matter of fact, a television is present in almost all houses in rich countries, and it spreads rapidly in all emerging countries. Moreover, many video services (e.g., streaming film or television online) are conceived to be used by more than one person at the same time, and this is difficult using a PC, while the television is naturally designed to be watched by more than one person.
For these reasons, many carriers also offer PC-less video services to the retail market, directed to people who do not want to use a PC but are of course skilled in using television.
In this case, the service is delivered by connecting to the access line and to the television an equipment called. “set-top box” that adapts the format of the signal arriving from the network to the television format and allows the user to select via a simple menu system the video he wants to watch.
Many set-top boxes also incorporate other features, like a hard disk for video storage and web browsing. However, it is a key point to maintain the set-top box simple to use, due to the fact that it has to be suitable for those who, for different reasons, find the PC too complex.
For all these reasons, we will concentrate on the television standards.
TABLE 2.1 Bandwidth Occupied by Digital Video with Different Compression Codes
Bit Rates per Channel (Mbit/s) |
Range |
Typical |
SDTV |
2–5 |
3 |
SDTV |
1.5–2 |
1.5 |
HDTV |
15–20 |
16 |
HDTV |
5–10 |
8 |
On the coding side, there are several codes available, and the continuous improvement in code compression of video signals is one the keys to the success of broadband video services [22].
The bandwidth occupied on the access line by different video codes is reported in Table 2.1.
Let us now consider the most important bundle of services that is offered by almost all carriers to the retail user—the so-called triple play.
The triple play is built by putting together one or more phone lines, a package of data services mainly centered on web browsing (even if instant messaging and pair-to-pair are very popular), and one or more contemporary television channels. The need for more than one television channel is related to the fact that frequently more than one television is present in a house and different persons can wish to watch different programs at the same time.
The first important observation is that triple play is intrinsically asymmetric. As a matter of fact, video services are delivered from the network to the user at high speed, while the data stream from the user to the network is constituted only by the commands needed to set the options of the service and is low speed.
This is the main reason for the success of asymmetric access systems like ADSL and GPON in the retail market that efficiently shapes the bandwidth usage on the characteristic of the most bandwidth-consuming services.
The downstream bit rate needed for different triple play configurations is reported in Table 2.2. From the table, it is quite evident that the most bandwidth-demanding configuration is also accommodated with an access bandwidth of 50 Mbit/s, thereby fixing the order of magnitude of the target bandwidth for the next generation access network. In line with this evaluation, many carriers target a future access delivering 100 Mbit/s to every user to maintain scalability in front of the introduction of new services.
Up to now, we have considered real services, that is, products that carriers offer to the retail customer. It is not possible to close the discussion about services for the retail market without also considering pair-to-pair applications.
In a pair-to-pair application, the content of the service is not delivered by the carrier or by another service provider via the carrier network, but it is generated by a customer. For example, in a typical peer-to-peer service, a community of customers store in a network repository the digital version of the films they have bought on DVD. Every customer, under the only condition of a forum subscription, can access the repository and download the content he needs.
It is not possible here to enter into the details of the complex legal issues implied by this content management. As a matter of fact, films, music, books, and so on are protected by copyright and the boundary of a legal exchange of content between friends can be easily overcome by configuring a copyright violation.
TABLE 2.2 Downstream Bit Rates for All-Digital Triple-Play
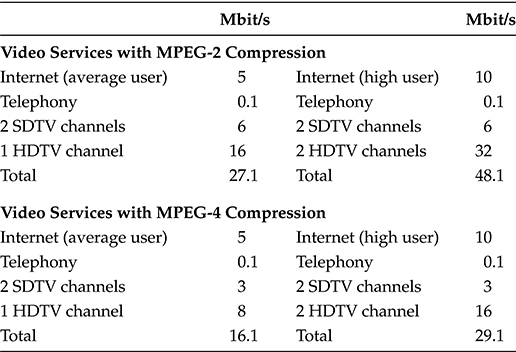
However, the pair-to-pair phenomenon is so huge that it seems difficult to cancel it by simply calling it.”informatics piracy.” Perhaps, the phenomenon will be regulated both by controlling the exchange sites and by adapting the copyright rules, and it will be established as a telecommunication service in its own right.
Business-oriented services are clearly divided among services for small businesses and services for big firms. In the first case, the service bundle does not differ essentially from that offered to the retail market. Typical differences are more than one telephone number associated with different internal phones, network support for phone conferences with several external numbers, and the substitution of TV channels with a network-based video conferencing service.
The main difference between retail and small business is, however, the granted service level agreement (SLA) and the security from intrusion and detection of private data.
In the case of small business, an SLA is generally contained in the service fruition contract, both in terms of service availability and service quality.
On the contrary, no specific SLA is granted in retail contracts, considering data services operated on a best-effort ground. In a few European countries, there is an SLA on the plain telephone, surviving from the monopoly period, fixing the maximum out-of-service time.
This SLA was imposed by the administration on the grounds of the necessity to assure telephone service in case of extraordinary need. However, there is almost everywhere a push from the carriers for the cancellation of this regulation. As a matter of fact, with the diffusion of cellular phones, its rationale almost disappears.
In the case of big companies, the service offering is quite different.
Before the Internet revolution, the typical service for big companies was the rent of a dedicated TDM capacity. This capacity was used to connect the firm PABX in a secure manner and to create a private company telephone network.
This kind of offering still exists for companies having its own switches and desiring a complete isolation of its internal network. However, the leasing of a whole physical line is a costly solution and many companies prefer to lease a given capacity, multiplexed on the physical lines via statistical multiplexing with other signals. In this way, the exploitation efficiency of the physical line is much bigger and rent prices are smaller.
Renting a virtual capacity opens two problems: assuring both an agreed SLA via a QoS monitoring and data privacy even if they are statistically multiplexed with other data.
Both these problems are solved using the concept of virtual private network (VPN) [23]. A VPN is implemented enveloping the packets belonging to this virtual network in a public envelop before being injected into the public network. This public envelop masks completely all the characteristics of the packet (such as the specific destination, the nature of the service, and so on), and simply reports the address of the destination within the public network (i.e., the last public node of the packet path) and a set of other data related to the SLA and the QoS.
The concept of VPN has been a really fruitful idea, since it has been used for several applications also different from its original rationale, for example, to manage QoS in carrier class Ethernet networks.
Last, but not least, a carrier managing its own network delivers wholesale services to other carriers.
Wholesale services consist in renting transmission capacity to other carriers in terms either of physical trunk (like copper pairs in the access network) or logical capacity within a multiplexed signal.
Wholesale services can be classified into regulated and unregulated services Regulated services are provided in Europe and in the United States by the incumbent carriers to the competitive carriers in order to allow them to carry out their business. The main regulated wholesale service is local loop unbundling. In this case, the incumbent carrier rents to a competitive one both central office space and services to operate the access machines (generally DSLAMs) and a certain number of copper pairs in order to reach end customers.
A similar situation can also happen in transport trunks, where the competitive carrier has to complete his transport network renting capacity from the incumbent.
These services are called regulated since the SLA between the incumbent and the competitive customer (comprising the cost of the service) is regulated by the national communication authority in order to prevent the incumbent from exploiting its dominant position to put the competitor out of the market.
On the contrary, in the case of unregulated services, the capacity rent is negotiated on the ground of a market price by the provider and the customer.
For example, when a carrier rents a set of fibers from a utility company (e.g., the railways company or the energy distribution company), there is no dominant position, and the SLA is simply negotiated by the two players.
2.1.3 Seamless Fixed and Mobile Service Convergence
Up to now, we have talked about services delivered on a fixed access network. The telecommunication customer generally considers fixed and mobile services as two separate entities even if they are done by the same carrier.
This approach implies the difference between the fixed-line phone that is associated with a place (the house of the Boosh family, the office of Mr. Smith, …) and the mobile phone that is associated with a person. With the diffusion of cellular phones, fixed-line phones are less and less useful since a phone call is directed to a specific person, and usually the possibility that another person could answer only because she is near the phone is considered a loss of time in the best case, if not a real problem.
This is the main reason why fixed-line carriers have seen year after year a slow decrease in the number of fixed-line phone subscriptions in favor of mobile subscriptions.
Big carriers like AT&T and all the European incumbents have both the fixed and the mobile access network, and it is natural to conceive a new telephone solution where the difference disappears.
Several such proposals have been done, where the customer has only one, personal phone that is similar to a cellular terminal.
When the terminal is in the range of the customer house network, that can be either a dedicated radio link with the telephone base or a broadband Wi-Fi network, the telephone behaves like a fixed-line phone; when the telephone is far from the house, it behaves like a cellular phone [24,25].
This simple service profile can be implemented in several different ways, either leveraging on network intelligence or leaving all the management to the terminal software.
In any case, the seamless transition from one working mode to another is a key performance, since during a phone call the working mode change has to have a minimal impact on the call quality.
Beyond the simple telephone call, there are other services that are similar on fixed and mobile terminals, for example, a video call or the delivery in real time of images of a sport event.
Starting from these similitudes, several studies have foreseen that in the future network not only telephones but all video services will pass seamlessly from fixed to mobile terminals [26].
For example, in such a network, it would be possible to start a video call using the call-enabled set-top box and the TV screen. After a certain time, it should be possible to pass the call on a mobile terminal without interrupting it. As far as the mobile terminal remains within the reach of the home Wi-Fi, it works like a fixed terminal (with the corresponding lower cost), and when the caller goes out of the Wi-Fi’s reach, the terminal connects to the mobile network and changes tariff accordingly. All these changes must happen without a significant drop of the call quality (but for the passage from the TV screen to a handheld terminal, where the quality is impacted from the screen dimension)
Similar transitions can be done for the online transmission of a football match or of a news program, all of which can be watched on television or by using a handheld mobile terminal.
2.1.4 Prices Fall and Overall Market Scenario
At the conclusion of this very rapid analysis of the services delivered by a telecommunication carrier, it is evident that the Internet revolution followed by the penetration of broadband access has generated a big service differentiation and multiplication.
At first, it could seem that telecom carriers must have had a steady increase in revenue, in pace with the increase of the average bandwidth used by the end customer.
The reality is completely different.
As a matter fact, when the Internet revolution started, the “network,” as almost all Internet users call it, was seen as a real social revolution. In contrast with the traditional news and entertainment media, the Internet was not broadcasting contents controlled by a small number of entities, but allowed every single user to become a content generator, to publish its photos and films to entertain friends, to comment on political events, or to exchange recipes.
Many people around the world consider the Internet the most powerful instrument to affirm intellectual freedom, to diffuse news that is not in line with the thinking of the local government, and, in general, to react against authority control of information.
However, in order to unleash all this power, two conditions are needed: The Internet would have to reach almost all users in the world with a sufficiently wide bandwidth, and the cost of the Internet would have to be almost zero.
At the end, if the cost is related to the fruition of some content, when the content is simply exchanged among users, it seems reasonable that it is done almost for free, exactly like the exchange of DVDs among friends during a Sunday meeting.
However, this wonderful idea crashed with a telecommunication system regulated by market rules and with the fact that developing Internet involves huge costs both for equipment and infrastructure.
As we have seen, the great effort that was made during the so-called bubble period by telecommunication carriers to upgrade the network in pace with Internet penetration left the carriers in a difficult financial position.
Starting from that period, there was a continuous push from users to develop broadband access, to deliver a wider access bandwidth, and to decrease the cost of connection.
This push was operated in a market where there were too many players, and also the bigger carrier was hungry to increase its share to face its big debt. Thus, a sort of commercial war started, that has lasted up to present times, where in front of a continuous increase of broadband penetration and offered bandwidth, the bandwidth price decreased at a fast pace.
The increase of the access bandwidth is so uniform and continuous that Jacob Nielsen in a paper published in 1998 [27] introduced the Nielsen law of Internet bandwidth that essentially states that access bandwidth increases about 50% a year. This is similar in its formulation to the Moore law of computer power, and it is surprising how much it fits the reality up to now.
An example of the Nielsen law is given in Figure 2.7, where the peak bandwidth offered by different carriers to a residential customer in California is plotted versus time [27].
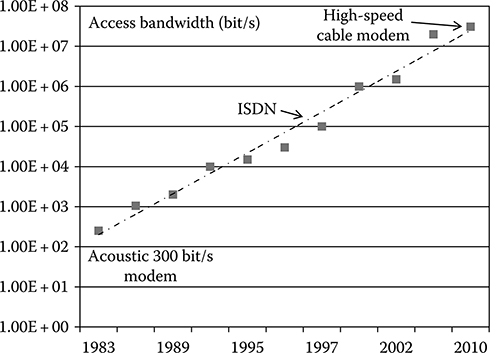
FIGURE 2.7 Plot of peak bandwidth offered to the residential users for Internet surfing in California versus time.
(After Nielsen, J., Nielsen’s Law of Internet Bandwidth [Online], Alertbox, 1998, last update 2010, http://www.useit.com/alertbox/980405.html (accessed: March 5, 2010), ISSN 1548-5552.)
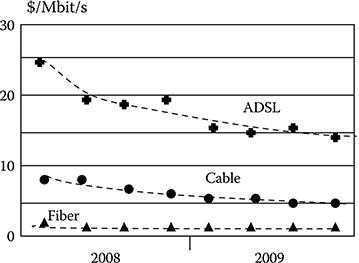
FIGURE 2.8 The U S. average retail price of 1 Mbit/s versus time.
(After Field, D., Fire the Phone Company: A Handy Guide to Voice Over IP, Peachpit Press, Berbeley, CA, s.l., 2005, ISBN-13: 978-0321384867.)
In front of this technical effort, the average price for unit bandwidth decreases continuously, so that the increase in offered bandwidth generates almost no revenue increase.
The price reduction is shown in Figure 2.8, where the U S. average price of 1 Mbit/s in the access line is shown versus the time in a 2 year period. Even in so short a time, the decrease in the price is evident, and the trend has lasted since the early 1990s.
The fast price decrease generated by the Internet revolution also hit the standard telephone.
Even in the Internet era, telephone is by far the telecommunication service that attracts more customers. Thus, the commercial war among carriers also brought about a relevant decrease in telephone prices.
This decrease was also caused by the emergence of IP and mobile phone services. On one side, free IP phone, although not so diffused, constitutes a dangerous competitor for standard telephone, especially for international calls, where the tariff of the main carriers is higher [28,29].
As far as the mobile phone is concerned, as underlined in the previous section, it has the advantage of being a personal communication device. Since the start of the massive diffusion of GSM phones, several people have replaced their fixed-line phones with mobile phones [30].
Under the combined pressure of internal competition among carriers and external competition from service providers using other technologies, telephone prices have been consistently going down since the early 1990s.
As an example, in Figure 2.9, the average price of a phone call in different European countries is shown versus time in the period 1996–2004. All the prices are averaged on real traffic and reported as percentage of the average price in 1996. The price fall is quite evident, and even if its importance is higher in the bubble years and becomes less pronounced after 2002, it lasts even after the period shown in the plot up to the present time.
The behavior of prices is the last element needed to depict a global scenario of the telecommunications market, as it is experienced by European and American carriers.
The main elements influencing such a market are summarized as follows:
There is a strong market requirement from the end users to increase the access bandwidth and the broadband access penetration since this is perceived as a necessary infrastructure for social growth.
There is a strong requirement to lower the prices of both telephone and Internet, corresponding both to the need of a larger diffusion of Internet and to a general negative trend in the customers’ willingness to spend money on telecommunication services.
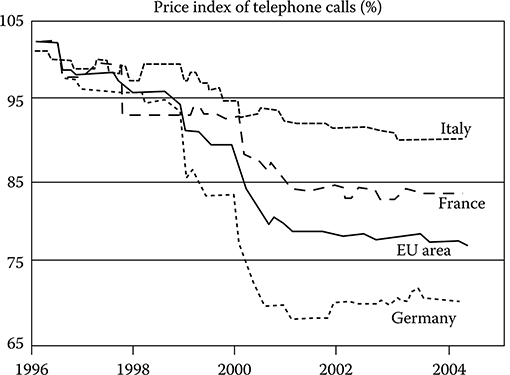
FIGURE 2.9 Average price of a phone call in different European countries versus time in the period 1996–2004. All prices are relative to the average price in the Euro area at the beginning of 1996 (assumed to be 100%)
(After Church, S. and Pizzi, S., Audio Over IP: Building Pro AoIP Systems with Livewire, Focal Press, Burlington, MA, s.l., 2009, ISBN-13: 978-0240812441.)
Carriers are almost all in a difficult financial position due to debts, but their net income at present is positive.
The carrier position is worsened by the price-decreasing trend that does not seem to stop and forces them to continuously introduce new and larger bandwidth services to compensate price fall.
Carrier income comes mostly from voice services; their expenses are mainly due to the need to sustain and expand broadband services.
ADSL technologies, allowing broadband services to be implemented without the need of deploying new cables, seem to be at their maximum; in order to attempt the next jump in capacity, new cabling with optical fibers seems necessary, with the need of a huge CAPEX.
Competition in the carrier market is regulated by the administration of countries via telecommunication authorities.
Unbundling of copper access networks is present both in Europe and in the United States, but while in Europe it seems that it will remain unchanged for new networks, in the United States, carriers deploying completely new networks will not be obliged to unbundle them.
2.1.5 Telecommunication Market Value Chain
Up to now, we have considered carriers as the players of the telecommunication market since they are in contact with the final customer and manage the telecommunication network. Nevertheless, the market relies on an articulated value chain to provide to carriers the complex technology equipment needed to build the network.
The value chain of the telecommunication market is depicted in Figure 2.11.
The first element of the chain is constituted by component suppliers, the companies’ buildings, for example, optical fibers, lasers, integrated electronic circuits (IC), optical amplifiers, and all the components that are needed in telecommunication systems.
Three types of companies are present in this segment:
Components divisions of companies that are vertically integrated and build in-house the key components for their systems (e.g., Infinera and partially also AlcatelLucent in the measure in which Bell labs are used for design and production)
Companies devoted only to a niche class of components for use in telecommunications (e.g., Santur that was in 2010 the market leader for tunable lasers designed for telecommunication system)
Big companies producing components for a plethora of applications (e.g., NEC, which produces a huge number of other product ICs for telecommunications)
The situation of this market segment is not easy. In front of the huge CAPEX investments needed to develop the technology, all the price pressure generated at the end customer level goes down along the chain and at the end arrives here.
To present an example, tunable lasers for optical fiber transmission had an average cost of about.$2000 in 2004. This cost went down to $800 in 2008 and was around $600 in 2010.
Components are often assembled in subsystems called modules before being inserted in telecommunication systems.
This step is due to the fact that system vendors generally do not want to develop the analog electronics needed to drive individual components, either to avoid the need of a dedicated development group or to avoid risks related to this very specific development.
Thus, modules collect all the components needed for a specified functionality (e.g., in/out interface of an equipment) and close them in a module comprising all the hardware and firmware drivers. Such a module can be driven by the control board of the equipment via a digital interface and is much easier to substitute if needed than bare components integrated in a card.
Modules are often manufactured by component companies, but there are also niche companies acquiring components and building modules with them.
Modules are sold to system companies: The companies manufacturing, for example, WDM transport systems, Ethernet carrier class switches, and IP core routers. The companies in this market segment are generally big companies due to the fact that a telecommunication system involves very complex equipment, comprising hardware and software, and requires the capability of carrying out a complex design and production process. Some of the most well-known companies in the world belong to this market segment: Alcatel–Lucent, Eriksson, Nokia–Siemens, Huawei, NEC, and Fujitsu.
In general, telecommunication carriers do not buy bare equipment, but buy a service consisting in the setup of a network segment. In order to provide this service, the required equipment must be installed in the carrier central offices, connected to the network, set up under a software point of view and finally tested. When all is complete, the new elements can be virtually switched on by the management systems and are ready for real traffic.
These operations are the business of solution providers. A few system vendors like Ericsson are also solution providers, but there are many companies that do only this business. These companies work, in general, in a specific geographical area and with a few specific customers, due to the great impact both of logistic issues and of specific customer needs on their operations.
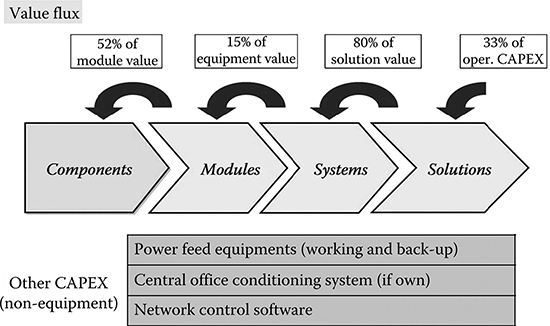
FIGURE 2.10 Value chain of the telecommunication market from physical components (e.g., integrated circuits) to deployed networks. The CAPEX flux is indicated from higher to lower segments and examples are done of carriers’ CAPEX spent out of this value chain.
We have seen in Figure 2.4 that telecom carriers have a huge CAPEX investment every year, of the order of several trillion U S. dollars. It is quite interesting to analyze how this great cash flow distributes along the value chain.
In Figure 2.11, the average destination of the U.S. and European carrier CAPEX is shown, using 2008 data, while the distribution of CAPEX along the value chain is represented in Figure 2.10.
The first interesting feature is that only 33% of the carrier CAPEX is injected along the equipment value chain. The other CAPEX is invested in other elements of the network, as reported in the table included in Figure 2.10.
Moreover, while the main part of this value transits up to system manufacturers, only a small part goes down along the hardware value chain toward module manufacturers. This is due to the great design and testing effort needed to design and manufacture telecommunication equipment that imposes on system vendors great investments in terms of development structures and testing grounds.
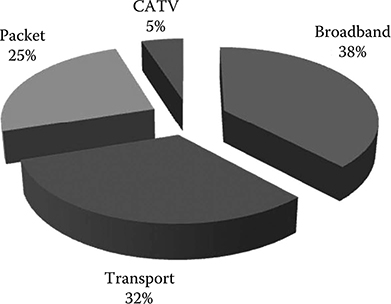
FIGURE 2.11 Average destination of those carriers’ CAPEX invested in network infrastructures in Europe and the United States.
The analysis we have carried out in the last two sections is mainly centered on American and European carriers. As far as Far East carriers are concerned, three main differences can be identified.
The network has to be developed from green field in a few areas due to the fact that no previous network exists.
There is no great attention to boost competition; on the contrary, in a few important cases, the administration supports the “de facto” monopolist with the target of accelerating the creation of an infrastructure that is strategic for the country’s growth.
Mainly in Japan and in China, local players are practically favored due to both the difficulty entering the market and the very specific requirements.
However, excluding Japan where the market is already consolidated and has strong entry barriers, over a period of time, almost all developing countries will grow from a social and economic point of view, and the market will become more and more global. This will probably cause the market dynamics to be more and more similar to that depicted for the United States and Europe.
2.2 Requirements for Next Generation Networks
2.2.1 Network Operational Costs
In the previous section, we analyzed from different points of view, the CAPEX of telecommunication carriers. However, besides being CAPEX intensive, operating a telecommunication network also requires big OPEX.
A very effective classification of the different sources of OPEX is reported in [31]. In particular, the following OPEX sources are identified:
Operational costs to maintain the network in a failure-free situation. The cost category comprises rent of space in central offices, power consumption of the equipment, cost of personnel that in normal conditions operate in the central office, and so on.
Operational costs to keep track of alarms and prevent failures. Control of the network performances via the control plane is a typical cost belonging to this class.
Costs deriving from failures: on one side, repairing costs like spare management and field interventions and, on the other side, penalties due to SLA violation when this event happens.
Costs for authentication, authorization, and accounting (AAA)
Costs for planning, optimization, and all the running activities for the continuous network upgrade both from a hardware and a software point of view.
Costs related to commercial activities, including new commercial offerings and the launch of new services.
From the list given earlier, it becomes evident that it is difficult to carry out an abstract evaluation of OPEX unless a completely defined specific situation is referred to.
OPEX depends heavily on factors like the kind of equipment the carrier deploys in its network, what equipment is of the most recent generation, what is legacy equipment, and if the control is integrated over all the network or if different parts of the network (e.g., areas where different technologies are deployed) have different control software.
The organizational structure of the carrier also impacts the OPEX, and even the local laws regulating work contracts have their own influence.
Nevertheless, analyzing the carrier balance sheets and working out carrier OPEX evaluation models [32], it becomes clear that OPEX is the main expenditure of a carrier that has an established network.
For example, a good approximation of the OPEX expenditure related to network operations for U.S. carriers is about 70% of the overall company expenditure and a similar situation also exists in Europe. As far as Far East carriers are concerned, two elements contribute to creating a different situation: on one side, the CAPEX is higher (relative to the overall carrier business) due to the need of developing the network in areas in which either it uses old technologies or it is practically not present; on the other side, the impact of the labor cost is smaller. However, analyzing the results of China Telecom, for example, OPEX reduction remains a key for success [20].
2.2.2 Requirements for Next Generation Equipment
The profound transformation in the telecommunication business caused by the Internet revolution, market liberalization, and the post-bubble crisis has a huge impact on technical aspects.
In the following sections, we will summarize the main impacts in terms of changes in telecommunication network requirements.
In the telephone-centric period, the telecommunication network was constituted by superimposed and separated networks.
The most important of these superimposed networks, generating the main part of carrier revenues, was the telephone network. The telephone network was built on a few key elements:
Deterministic TDM transmission
Call-based circuit switching
Very fast protection in the core area (less than 50 ms of protection time end-to-end)
Very high availability (99.999% that means less than 5 min out of work in a year)
The control plane of such a network, in its most advanced version, was provided by a centralized software control that was able to monitor both equipment and network (e.g., TDM streams exploitation efficiency) and incorporated algorithms for network reconfiguration and upgrade.
Besides the telephone network, there were also other logically distinct networks that exploit the same set of transmission systems intended to provide data services mainly to business customers.
Generally, such networks used ATM or frame-relay protocols and were characterized by a very high availability (required by business customers) and high security.
The control plane of such networks were completely separated by those of the telephone network, being the monitoring and configuration of the common transmission systems operated by a dedicated control plane.
A similar structure is suitable if data traffic is quite a small portion of the overall traffic and data users are well separated by standard telephone users, but it becomes very inefficient if the main part of the traffic is constituted by data and both high-speed data and telephone have to be delivered almost to every user.
Evolving the network in pace with traffic evolution without changing the architecture would be a so CAPEX-intensive operation that carriers have been driven toward a complete network redesign.
At the base, there is the most natural consequence of data traffic domination: a telephone network carrying also data has to be transformed into a data network carrying also telephone.
From an equipment point of view, this means eliminating the separation between data and telephone networks and deploying a unique network whose nodes are based on packet switching. From a transmission point of view, TDM systems are substituted by powerful WDM systems.
This is a technically complex and very CAPEX-intensive operation, lasting several years and still undergoing for many carriers. As far as the equipment is concerned, the final target is to deploy a network architecture that fulfills two main requirements:
Scaling with the increase of traffic with minimum CAPEX
Relevant OPEX reduction mainly due to the following expectations
The power consumption of the packet machines is smaller for a given network traffic load with respect to the equivalent TDM machines.
Packet machines are more compact, due to the concentration in a single machine of all the logical functionalities that where performed by a plethora of machines in the old network.
However, the traditional telephone has to be delivered maintaining all the related services in such a way that the end user does not perceive the difference due to the network paradigm change.
This causes the introduction of a new class of equipment whose role is to manage the telephone service exactly like other services (e.g., IP TV, network storage, etc.), through dedicated network equipment.
This equipment relies essentially on a specific software to emulate the hardware performances of a traditional telephone switch and is called soft-switch [33].
Up to now, the requirements of new network equipment have been analyzed. In practical network planning, however, there is another key issue to take into account. The network evolution from one technology to another is a process lasting several years, during which the network is in an hybrid situation where new and old equipment have to coexist without a disruption of services.
Moreover, even when the transition to the new technology is completely carried out, old technology machines that are still working properly are not eliminated from the network but are still used up to the end of their lifetime, in the worst case, moving them away from the most critical part of the network to be deployed where the situation is less critical.
This fact has a consequence: the survival of isles where the TDM technology is still used for a time much longer than the time strictly needed to deploy the packet technology, with the need of implementing in the new machines (either the packet switches/routers or the WDM transmission systems) interfaces that are suitable to integrate them with the TDM equipment.
2.2.3 Requirements for Next generation Network Control Plane
In the old network, imagining that a new path was needed to connect new ATM interfaces installed in the data network, a long procedure was needed:
The data network had to be preconfigured locking the resources needed for the new capacity.
The control plane of the transport network had to be manually programmed in order to provision new paths providing the required new transport capacity.
When the new paths were provisioned and tested, the transport resources were assigned to the newly created paths that can start working.
The presence of the required paths is communicated to the control plane of the packet network that is manually induced to set up the wanted capacity.
Generally, since the departments managing the transport network and the packet one were different, the control SWs were located in different buildings and communications between them were carried out by phone by the persons working in the network control centers.
On the other hand, this inefficient provisioning procedure was acceptable due to the rarity of provision events and the possibility that it would take days to carry out a provision.
With the wide diffusion of broadband and the need of delivering wide band services to private customers, packet services began to be the main part of the traffic.
At this point, the structure of a set of superimposed networks is no longer effective due to all the inefficiency related to it.
In particular, in the Internet era, the traffic pattern is much more dynamic and difficult to foresee, both because commercial offerings of the carriers often vary and because customers frequently change both their way of using telecommunication services and the carrier delivering them services (as typical in a competitive market)
With the substitution of ATM and frame relay with IP, the core packet machines (IP routers) [34] have gained greater capacity, so to be able to absorb telephone traffic and to provide a unified switching system to the whole network.
Naturally, this operation has to be performed without affecting the service delivered to customers, thus using specific equipment and software to simulate all the features of the telephone service via a packet network [35].
However, a problem remains. In order to assure very fast recovery from failures, local redundancy has to be provided so that almost half the transport capacity of the network is devoted to protection from failures. This is true not only for the transmission lines (that are the lower availability elements of the network due to the probability of cable cut for civil works or other accidents) but also for the equipment elements like optical interfaces, switching matrixes, and so on.
This strategy, while technically quite effective, is contrary to the main requirement of the new network—it has to be cheap in terms of CAPEX, but, more importantly, it has to sensibly reduce the OPEX.
Unifying the switching technology with the use of the IP protocol stack is an important step in the direction of OPEX reduction.
As a matter of fact, replacing the set of two or more insulated control planes with a single control plan allows operations like provisioning of new packet capacity to be carried out automatically, thereby gaining both a greater provisioning speed and a lower cost in terms of qualified personnel working in the control centers.
This effect is also enhanced by the fact that the IP control plane, whatever technical solution is used, is a distributed intelligence system, working on the set of router control units. This system in standard conditions works without the need of human manual programming and the central control room is reduced to a simple reporting center where the status of the network is depicted to individuate possible critical issues or points of potential traffic congestion.
All these advantages, however, risks to be counterbalanced by the huge waste of capacity due to the need for local redundancy increasing greatly the CAPEX needed to evolve the network.
It is not difficult to imagine that using the distributed IP control plane, it is possible to devise complex algorithms that are able to exploit a small redundant capacity (much less than 50%) in order to reconfigure the paths affected by a failure and recover the correct network connectivity [36,37].
These algorithms, whatever be the used rerouting criterion, are slower than a simple switch between a working and a stand-by redundant capacity and in general do not satisfy the 50 ms requirement for protection fulfilled by the TDM network.
The problem related to the failure recovery time is only one of the issues to be solved to transmit on a packet switched network a service requiring real-time data transmission, and it is to consider that the telephone is not the only service of this type. Video streaming services are an important part of every broadband service offering, and a key point for its success is the perceived quality of the video, especially in the high-definition case.
In order to assure real-time transmission, not only does the recovery time have to be controlled, but the network traversing time also has to be controlled in ordinary condition so as to avoid a too long latency and a disordered arrival of the packets at their destination.
Two steps are needed in order to satisfy technical requirements imposed by the different services while fulfilling the fundamental condition to maintain CAPEX at a minimum and achieve a relevant OPEX reduction.
First of all, traditional requirements of the TDM telephone network have to be analyzed, again taking into account the new situation and the different potentialities of the packet network.
Once a set of minimum network requirements that have to be satisfied are identified, a new network control plan has to be defined that is able to perform the traditional operations of the network management software (called FCAPS from the initials of their description) that will have to be defined along the following lines:
Fault management
Configuration management
Accounting management
Performance management
Security management
All these operations have to be performed in pace with the target OPEX reduction, with the characteristics of packet switching and with individual service requirements.
There is a wide agreement in the engineering community that the aforementioned high-level requirements can be specified as follows.
The new packet switched network has to be managed by a control plane having the following characteristics:
It should be able to collect the different services delivered through the network in QoS classes, that is, collecting in the same class the service that has the same requirements as far as the transmission through the network is concerned.
It should perform distributed routing of packet in the network via a distributed algorithm running in the control cards of the network equipment; this algorithm has to distinguish different classes of QoS, assuring that each service is delivered fulfilling its specific requirements in terms of delay and packet-ordered arrival at destination.
It should perform fault-driven rerouting via the exploitation of the free network capacity; also this algorithm has to distinguish different classes of QoS assuring that each service is protected against failures fulfilling its specific requirements in terms of packet loss and recovery time.
It should allow centralized alarm report and failure diagnostic so as to drive failure repair interventions; this means, among other things, the capability of filtering the alarm chain derived from a single failure so as to identify the source of failure.
It should allow centralized traffic optimization via traffic engineering algorithms in order to optimize the network from the central control room, when needed.
It should allow AAA to be performed.
Up to now we have listed the requirements of the new control plane. But naturally, since the equipment must be interoperable with legacy TDM technology, the new control plane has to allow this equipment feature.
2.2.4 Summary of Requirements for Next Generation Networks
From the previous sections, it is clear that the network evolution is driven by the difficult moment that the telecommunication market is traversing, with a stagnation risk even if the main world carriers have a positive EBIT and the users ask for more and more bandwidth.
Since the main structure cost of a telecom carrier is constituted by network OPEX, the main target of the network evolution is to provide enough bandwidth to the end user so as to enable new services that will boost carrier revenues in pace with a substantial reduction of the network OPEX.
Moreover, even if this operation is unavoidably CAPEX intensive, carriers push equipment vendors strongly for a price reduction, compatible with their limited CAPEX spending.
The requirements discussed in the previous sections have been the guidelines for the network evolution of almost all the carriers.
In particular, almost all the carriers have injected, following different technology visions, a huge amount of packet functionalities in the transport network.
At present, it can be asserted that major carriers have completed the evolution of the long distance network and have almost completed that of the metropolitan and regional network. Unified IP processing and WDM transmission are diffused in long distance while different approaches have been adopted to inject packet-switching capabilities in the metro and regional networks, always relying on WDM optical systems for data transmission.
As far as the access network is concerned, while in Asia and the United States there is a mixed situation, where relevant fiber-based access networks coexist with more traditional ADSL-based areas, in Europe fiber-based access is almost absent.
At this point, it should be clear if the great technology evolution that has transformed the old telephone-based network into today’s data-based network has achieved or not its goal.
The answer is that the target to diffuse broadband and to lower sensibly the prices of wideband services while taking under control carriers OPEX and CAPEX has been reached, but the market has not started to grow again.
On the contrary, the risk of stagnation is always present, a strong push to consolidation and selection in all the market segments is still at work, and the customers go on asking for much more bandwidth at a much lower cost.
Since no new service is going to be introduced that is able to relevantly increase the ARPU, the only possible solution is to envision a further deep change in the network that will drive lower OPEX with a reasonable amount of CAPEX. This new technology should bring about the so-called next generation network (NGN)
Considering the technologies involved in the vision of NGN, there are a lot of different ideas and there is no consensus around a single solution or even around the fact that one of the proposed solutions could achieve the cost reduction targets while providing the needed bandwidth and service quality.
In the following chapters, we will analyze in detail the present network and the main proposals or its evolution from a technical point of view, keeping always in mind the market situation and the consequent requirements.
REFERENCES
1.. Noam, E., Telecommunications in Europe (Communication and Society), Oxford University Press Inc., s.l., New York, 1992, ISBN-13: 978-0195070521.
2.. Sterling, C H., Shaping American Telecommunications: A History of Technology, Policy, and Economics, Lawrence Erlbaum Associates, Mahwah, NJ, s.l., 2005, ISBN-13: 978-0805822373.
3.. Stallings, W., ISDN and Broadband ISDN with Frame Relay and ATM, 4th edn., Prentice Hall, Upper Saddle River, NJ, s.l., 1998, ISBN-13: 978-0139737442.
4.. Kasera, S., ATM Networks: Concepts and Protocols, McGraw-Hill, New Delhi, India, s.l., 2006, ISBN-13: 978-0071477321.
5.. Pattavina, A., Switching Theory, Architectures and Performance in Broadband ATM Networks, Wiley, s.l., Chichester, U K., 1998, ISBN-13: 978-0471963387.
6.. Iannone, E., Personal Elaboration of Ovum.”Capex Conundrum” report, Ovum, s.l., 2003.
7.. U.S. G.P.O., Public Law No: 104-104, Telecommunications Act, 1996.
8.. Library of Congress, S 652—All Congressional Actions w/Amendments, March 23, 1995 through February 8, 1996.
9.. Library of Congress, Korea Telecom deploys Novera Optics DWDM transport solutions, Fiber Optics Weekly Update, July 28, 2006.
10.. Public ITU-T report.Measuring the Information Society–The ICT Development Index 2009, ITU-T publishing, 2009.
11.. Saadat, A., Service Providers Capex, Opex, ARPU and Subscribers Worldwide, Infonetics, s.l., 2007.
12.. Hillebrand, F. (Ed.), GSM & UMTS: The Creation of Global Mobile Communications, Wiley, New York, s.l., 2001, ISBN-13: 978-0470843222.
Leshem, A., The capacity of next limited multichannel DSL, In.Proceedings of Sensor Array and Multichannel Signal Processing Workshop, Sitges (Spain) Barcelona, Spain, July 18–21, 2004, Vols. 1–2, pp. 696–700, 2004.
14.. Iannone, E., Next generation wired access: Architectures and technologies. In K. Iniewski (Ed.), Internet Networks: Wired, Wireless, and Optical Technologies (Devices, Circuits, and Systems), Taylor & Francis, Boca Raton, FL, s.l., 2009.
15.. Library of Congress, Senate report 109-355.29 document, description of the Communications Act of 2006, 2006.
16.. Fastweb web site [Online], www.fastweb.it (accessed: March 1, 2010)
17.. Telecom Italia Annual report 2008 [Online], www.telecomitalia.it, http://telecom-italia-annual-report-2008.production.investis.com/it-IT/report-on-operations/business-units-ofthe-group/domestic/operating-and-financial-data/revenues.aspx (accessed: March 4, 2010)
18.. Miller, F P., Vandome, A F., McBrewster, J. (Eds.), IP Phone: IP Phone, Voice over Internet Protocol, Public Switched Telephone Network, Session Initiation Protocol, Skinny Call Control Protocol, Proprietary… Skype, Telephone, Cordless Telephone, Alphascript Publishing, Mauritius s.l., 2009, ISBN-13: 978-6130274504.
19.. AT&T balance sheet 2008, AT&T Home Site [Online], 2008, www.att.com (accessed: March 3, 2010)
20.. Oliver, C., China Telecom profit falls 34% in first three quarters (China Telecom press release), Market Watch—The Wall Street Journal Digital Network, October 2009.
21.. Whitaker, J., Benson, B., Standard Handbook of Video and Television Engineering, McGraw-Hill Professional, New York, s.l., 2003, ISBN-13: 978-0071411806.
22.. Koc, U.-V., Chen, J., Design of Digital Video Coding Systems. (Signal Processing and Communications), CRC Press, Boca Raton, FL, s.l., 2001, ISBN-13: 978-0824706562.
23.. Mairs, J., VPNs: A Beginners Guide, McGraw-Hill/Osborne Media, New York, s.l., 2001, ISBN-13: 978-0072191813.
24.. Watson, R., Fixed/Mobile Convergence and Beyond: Unbounded Mobile Communications, Newnes, Bostan, MA, s.l., 2008, ISBN-13: 978-0750687591.
25.. Ahson, S.A., Ilyas, M. (Eds.), Fixed Mobile Convergence Handbook, CRC Press, Boca Raton, FL, s.l., 2010, ISBN-13: 978-1420091700.
26.. Sutherland, E., Fixed mobile convergence, ITU-T Global Symposium for Regulators (GSR), February 5–7, Dubai, United Arab Emirates, s n., 2007.
27.. Nielsen, J., Nielsen’s Law of Internet Bandwidth [Online], Alertbox, 1998, last update 2010, http://www.useit.com/alertbox/980405.html (accessed: March 5, 2010), ISSN: 1548-5552.
28.. Field, D., Fire the Phone Company: A Handy Guide to Voice Over IP, Peachpit Press, Berbeley, CA, s.l., 2005, ISBN-13: 978-0321384867.
29.. Church, S., Pizzi, S., Audio Over IP: Building Pro AoIP Systems with Livewire, Focal Press, Burlington, MA, s.l., 2009, ISBN-13: 978-0240812441.
30.. Ward, M R., Woroch, G A., Usage Substitution between Mobile Telephone and Fixed Line in the U S., Texas University Report, Department of Economics, Arlington, TX, 2004, http://elsa.berkeley.edu/∼woroch/usage%20substitution.pdf (accessed: March 10, 2010)
31.. Di Giglio, A., Ferreiro, A., Schiano, M., The emerging core and metropolitan network. In Stavdas (Ed.), Core and Metro Networks, Wiley, Chichester, U K., s.l., 2010, ISBN: 9780470512746.
32.. Verbrugge, S., Pasqualini, S., Fritz-Joachim, W., Jager, M., Iselt, A., Kirstadter, A., Chahine, R., Colle, D., Pickavet, M. Demeester, P. Modeling operational expenditures for telecom operators, In Proceedings of the Conference on Optical network Design and Modelling, Milano, Italy, s n., February 7–9, 2005, ISBN: 0-7803-8957-3.
33.. Ohrtman, F., Softswitch: Architecture for VoIP, McGraw-Hill, New York, s.l., 2002, ISBN-13: 978-0071409773.
34.. Doyle, J., Carroll, J., Routing TCP/IP, Vol. 1, 2nd edn., Cisco Press, Indianapolis, IN, s.l., 2005, ISBN-13: 978-1587052026.
Ahson, S A., Ilyas, M., VoIP Handbook: Applications, Technologies, Reliability, and Security, CRC Press, Boca Raton, FL, s.l., 2008, ISBN-13: 978-1420070200.
36.. Somani, A K., Survivability and Grooming in WDM Optical Networks, Cambridge University Press, Cambridge, U K., s.l., 2004, ISBN-13: 978-0521853880.
37.. Goralski, W., The Illustrated Network: How TCP/IP Works in a Modern Network, Morgan Kaufmann Series in Networking, Burlington, MA, s.l., 2008, ISBN-13: 978-0123745415.