
Differential Evolution-Based Algorithm for Breaking the Visual Steganalytic System |
|
CONTENTS
13.2 De-Based Methodology for Breaking the VSS
13.3 De Algorithm and its Based Image Steganography
13.3.3 Procedure of Applying DE
As digital information and data are transmitted over the Internet more often than ever before, new technology for protecting and securing sensitive messages needs to be discovered and developed. Digital steganography is the art and science of hiding information into covert channels, so as to conceal the information and prevent the detection of the hidden message. Information security research on covert channels is generally not a major player, but has been an extremely active topic in academia, industry, and government domains for the last 30 years.
The word steganography (Provos and Honeyman, 2003) is of Greek origin and means “covered/hidden writing.” Steganography is the art and science of writing hidden messages in such a way that no one apart from the intended recipient knows the existence of the message. It is different from cryptography which does not hide the messages but encodes them in a secret manner, so that nobody can read it without the specific key. Another technique, watermarking (Cox et al., 2001; Shih, 2007) is used to guarantee authenticity and can be applied as proof that the content has not been altered since last insertion. Modern steganographic techniques include covert channel, invisible ink, microdot, null cipher, and spread-spectrum communication (Shih, 2007). Although steganography is an ancient subject, computer technology provides a new aspect of applications by hiding messages in the multimedia content, such as audio, video, and images.
Steganography has been widely used in historic times. Examples include hidden messages in wax tablets. In ancient Greece, people wrote messages on wood and then covered it with wax, so it would look like an ordinary, unused tablet. Steganography was also used during World War II to send the messages secretly to the destination. In the field of radio and communication technology, the payload is the data to be transported secretly. The carrier is the signal, stream, or a data file into which the payload is hidden. The resulting signal, stream, or data file in which the payload is embedded is referred to as package, stego file, or covert message, respectively.
Steganography can be divided into three types: technical, linguistic, and digital. Technical steganography applies scientific methods to conceal the secret messages while linguistic steganography uses written natural language. Digital steganography, developed with the advent of computers, employs computer files or digital multimedia data. The fundamental requirement of the steganographic systems is that the stego-object must be perceptually similar to the cover (original) object. This means that the hidden message should introduce only a slight modification to the cover object. There are two ways of inspecting a stego-object: One is passive and the other is active. In the passive scheme, the stego-object is examined to determine whether it contains a hidden message or not. On the other hand, the active scheme alters the content of the stego-object even though it does not detect the hidden message.
Steganalytic systems can be categorized into two classes: spatial-domain stegana-lytic system (SDSS) (Westfeld and Pfitzmann, 1999a; Avcibas et al., 2003) and frequency-domain steganalytic system (FDSS) (Fridrich et al., 2003). The SDSS is used for checking the lossless compressed images by analyzing the spatial-domain statis-tic features. For lossy compression images such as Joint Photographic Experts Group (JPEG), the FDSS is used to analyze the frequency-domain statistic features. Variant steganalytic systems have been build based on least-significant bit (LSB) technique, image quality measure (IQM) (Avcibas et al., 2003), and discrete cosine transform (DCT). Wu and Shih (2006) proposed a genetic algorithm (GA)-based stegano-graphic system to break the steganalytic system.
GA was used to generate the stego-image by artificially counterfeiting statistic features in order to break the corresponding steganalytic system. However, GA converges slowly to the optimal solution. There are other evolutionary approaches, such as differential evolution (DE) (Karboga and Okdem, 2004; Price et al., 2005) and evolution strategy (ES) (Beyer and Schwefel, 2004). One drawback of ES is that it is easier to get stuck on a local optimum. In this chapter, we use DE to increase the performance of the steganographic system because it is a simple and efficient adaptive scheme for global optimization over continuous space (Shih and Edupuganti, 2009). It can find the global optimum of a multidimensional, multimodal function with good probability.
The rest of the chapter is organized as follows. The DE-based methodology for breaking the visual steganalytic system (VSS) is presented in Section 13.2. The DE algorithm and its based image steganography are presented in Section 13.3. Experimental results are shown in Section 13.4. Finally, we draw conclusions in Section 13.5.
13.2 DE-BASED METHODOLOGY FOR BREAKING THE VSS
Kessler has presented an overview of steganography for the computer forensics examiner (Kessler, 2004). The steganalysis strategy usually follows the method that the steganography algorithm uses. A simple way is to visually inspect the carrier and steganography media. Many simple steganographic techniques embed secret messages in the spatial domain and select message bits in the carrier that are independent of its content (Wayner, 2002).
Most steganographic systems embed message bits in a sequential or pseudorandom manner. If the image contains certain connected areas of uniform color or saturated color (i.e., 0 or 255), we can use visual inspection to find suspicious artifacts. When the artifacts are not found, an inspection of the LSB plane is conducted.
Westfeld and Pfitzmann have presented a VSS that uses an assignment function of color replacement called the visual filter (Westfeld and Pfitzmann, 1999a, b). The idea is to remove all parts of the image that contain a potential message. The filtering process relies on the presumed steganographic tool and can produce the attacked carrier medium steganogram, the extraction of potential message bits, and the visual illustration.
As has been mentioned, in order to generate a stego-image to pass though the inspection of the SDSS, the messages should be embedded into the specific positions for maintaining the statistical features of a cover image. In the spatial-domain embedding approach, it is difficult to select such positions since the messages are distributed regularly. On the other hand, if the messages are embedded into specific positions of coefficients of a transformed image, the changes in the spatial domain are difficult to predict. We intend to find the desired positions on the frequency domain that produce minimum statistic features disturbance on the spatial domain.
Based on the DE, we generate the stego-image by adjusting the pixel values on the spatial domain using the following two criteria:
1. Evaluate the extracted messages obtained from the specific coefficients of a stego-image to ascertain that they are as close as possible to the embedded messages.
2. Evaluate the statistical features of the stego-image and compare them with those of the cover image such that the differences should be as few as possible.
Therefore, in order to break the VSS, the two results, VFCand VFS, of applying the visual filter on the cover- and the stego-images respectively, should be as identical as possible. The VSS was designed to detect the GIF format images by reassigning the color in the color palette of an image. Let the chromosome, ξ, be composed of 8 × 8 genes. Let C and S, respectively, denote a cover-image and a stego-image of size 8 ’ 8. The Analysis (ξ, C) to VSS indicating the sum of difference between VFC and VFSis defined as
(13.1) |
where “⊕” denotes the exclusive-OR (XOR) operator. The algorithm is described below.
1. Divide a cover-image into a set of cover-images of size 8 × 8.
2. For each 8 × 8 cover-image, generate a stego-image based on the GA to perform the embedding procedure as well as to ensure that VFC and VFS are as identical as possible.
3. Combine all the 8 × 8 stego-images together to form a complete stego-image.
Let α1 and α2 denote weights, which can be adjusted according to the user’s demand on the degree of distortion to the stego-image or the extracted message. The objective function is defined as:
(13.2) |
where Analysis(ξ, C) is the analysis function that maintains the statistic features between the stego-image and cover image by minimizing the difference defined in Equation 13.1, and BER(ξ, C) is the bit error rate which sums up the bit differences between the embedded and extracted message as defined in Equation 13.3.
(13.3) |
where MessageH and MessageE, respectively, denote the embedded and the extracted binary secret messages, and |MessageH| denotes the length of the message. For example, if MessageH = 11111 and MessageE = 11101, then BER(ξ, C) = 0.2.
13.3 DE ALGORITHM AND ITS BASED IMAGE STEGANOGRAPHY
DE is a kind of evolutionary algorithm (EA), which derives the name from natural biological evolutionary processes. EA is mimicked to obtain a solution to an optimization problem. One can use EA for problems that are difficult to solve by traditional optimization techniques, including the problems that are not well defined or are difficult to model mathematically. A popular optimization method, which belongs to the EA class of methods, is the GA (Holland, 1975). In recent years, GA has replaced traditional methods to be the preferred optimization tool, as several studies have conclusively proved. DE (Price et al., 2005) is a relative latecomer, but its popularity has been catching up. It is fast in numerical optimization and is more likely to find the true optimum.
The method of DE mainly consists of four steps: initialization, mutation, recombination, and selection. In the first step, a random population of potential solutions is created within the multidimensional search space. To start with, we define the objective function f(y) to be optimized, where y = (y1, y2, …, yn) is a vector of n decision variables. The aim is to find a vector y in the given search space, for which the value of the objective function is an optimum. The search space is first determined by providing the lower and upper bounds for each of the n decision variables of y.
In the initialization step, a population of NP vectors, each of n dimensions, is randomly created. The parameters are encoded as floating point numbers. Mutation is basically a search mechanism, which directs the search toward potential areas of optimal solution together with recombination and selection. In this step, three distinct target vectors ya, yb, and ycare randomly chosen from the NP parent population on the basis of three random numbers a, b, and c. One of the vectors yc is the base of the mutated vector. This is added to the weighted difference of the remaining two vectors, that is, ya–yb, to generate a noisy random vector n;. The weighting is done using a scaling factor F, which is user-supplied and usually in the range from 0 to 1.2. This mutation process is repeated to create a mate for each member of the parent population.
In the recombination (crossover) operation, each target vector of the parent population is allowed to undergo the recombination by mating with a mutated vector. Thus, vector yi is recombined with the noisy random vector, ni to generate a trial vector, ti. Each element of the trial vector is determined by a binomial experiment whose success or failure is determined by the user- supplied crossover factor, CR. The parameter CR is used to control the rate at which the crossover takes place. The trial vector, ti, is thus the child of two parent vectors: noisy random vector ni and the target vector yi. DE performs a non-uniform crossover, which determines the trial vector parameters to be inherited from which parent.
It is sometimes possible that some particular combinations of three target vectors from the parent population and the scaling factor F would result in noisy vector values, which are outside the bounds set for the decision variables. It is necessary, therefore, to bring such values within the bounds. For this reason, the value of each element of the trial vector is checked at the end of the recombination step. If it violates the bounds, it is heuristically brought back to lie within the bounded region. It is in the last stage of the selection, the trial vector is pitted against the target vector. The fitness is tested, and the fitter of the two vectors survives and proceeds to the next generation.
After NP competitions of this kind in each generation, one will have a new population, which is fitter than the population in the previous generation. This evolution procedure consisting of the above four steps is repeated over several generations until the termination condition is reached (i.e., when the objective function attains a prescribed optimum) or a specified number of generations are completed, whichever happens earlier. The flowchart is described in Figure 13.1.
1. The first step is the random initialization of the parent population. Each element of NP vectors in n dimensions is randomly generated as:
(13.4) |
where i = 1, 2, …, NP and m= 1, 2, …, n.
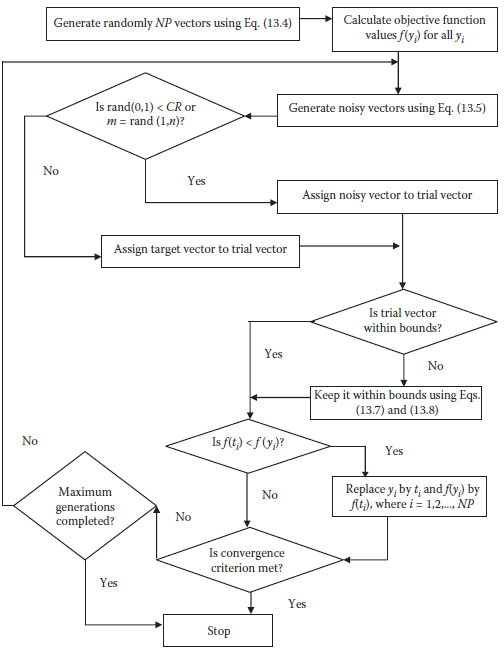
FIGURE 13.1 The DE flowchart.
2. Calculate the objective function values f(yi)for all yi.
3. Select three random numbers (a, b, and c) within the range from 1 to NP.
The weighted difference (ya–yb) is used to perturb yc to generate a noisy vector ni:
(13.5) |
where i = 1, 2, …, NP.
4. Recombine each target vector yi with the noisy random vector ni to generate a trial vector ti:
(13.6) |
where i = 1, 2,… NP and m = 1, 2,…, n.
5. Check whether each decision variable of the trail vector is within the bounds. If it is outside the bonds, force it to lie within the bounds using:
(13.7) |
where
(13.8) |
6. Calculate the value of the objective function for the two vectors ti and yi. The fitter of the two (i.e., the one with the lower objective function value) survives and proceeds to the next generation.
7. Check if the convergence criterion meets. If yes, stop; otherwise, go to step 8.
8. Check if the maximum number of generations is reached. If yes, stop; otherwise, go to step 3.
13.3.3 PROCEDURE OF APPLYING DE
Because the DE algorithm deals with floating point numbers, the procedure of generating the stego-image is slightly different from the GA algorithm. The evaluation function is the same as that of GA procedure. It uses the following rule to generate a stego-image: If dij ≥ 0.5, sij = Cij + 1; otherwise, Sij = Cij, where 1 ≤ i, j ≥ 8, and Sijand Cij, respectively, denote the pixels in the stego-image and cover-image. This procedure is illustrated in Figure 13.2, where (a) is the generated 8 × 8 DE vector by the DE algorithm, (b) is the 8 × 8 cover-image, and (c) is the corresponding stego-image
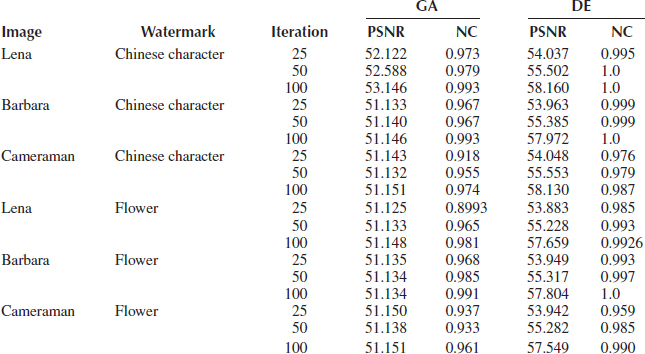
The GA- and the DE-based methodology for breaking the VSS was implemented in Java. JDEAL (Java Distributed Evolutionary Algorithms Library) was used to implement GA. Experiments were conducted on 50 cover images of size 256 × 256 and 10 secret messages of size 64 × 64. Some results are tabulated in Table 13.1 for iterations of 25, 50, and 100.
We apply the error measures, such as peak signal-to-noise Ratio (PSNR) and normalized correlation (NC), to compute the image distortion after embedding secret messages. The PSNR is often used in engineering to measure the signal ratio between the maximum power and the power of corrupting noise. Because signals possess a largely wide dynamic range, we apply the logarithmic decibel scale to limit its variation. This measures the quality of reconstruction in image compression; however, it just provides a rough quality measure. In comparing two video files, the mean PSNR is often calculated. The PSNR is thus defined: where hWa is the stego-image, h is the cover image, and N × N is the size of the image. The correlation between two images is often used in feature detection. Normalized correlation can be used to locate a pattern on a target image that best matches the specified reference pattern from the registered image base. The NC is defined as:
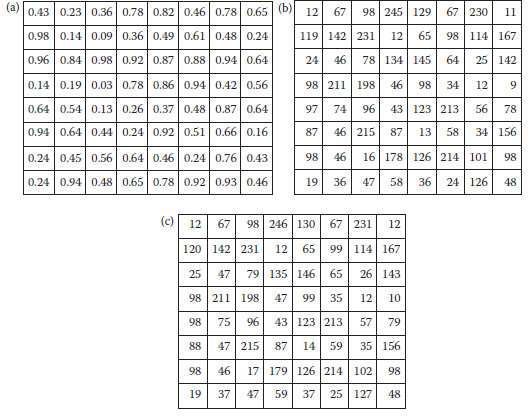
FIGURE 13.2 (a) DE vector, (b) cover image, and (c) stego-image.
TABLE 13.1
Comparison of Image Steganography Using GA and DE Algorithms
(13.9) |
where hWa is the stego-image, h is the cover image, and N × N is the size of the image. The correlation between two images is often used in feature detection. Normalized correlation can be used to locate a pattern on a target image that best matches the specified reference pattern from the registered image base. The NC is defined as:
(13.10) |
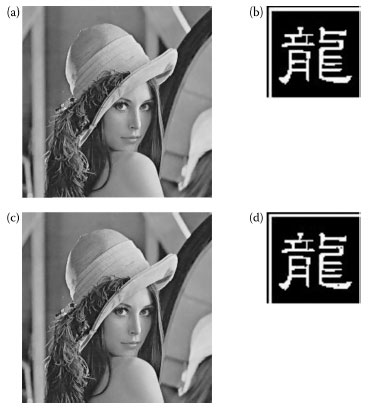
FIGURE 13.3 Images before and after the application of DE methodology to break VSS. (a) The Lena cover-image, (b) secret message to be embedded, (c) stego-image after 25 iterations of each block using DE, and (d) retrieved secret message from (c).
where WF is the extracted secret message, W is the embedded secret message, and N × N is the size of the message.
From Table 13.1, it is clearly observed that for the same number of iterations, DE algorithm not only improves the PSNR values of the stego-image, but also promotes the NC values of the secret messages. The percentage increase in PSNR values ranges from 5 to 13%, and that of NC values ranges from 0.8 to 3%.
Figure 13.3 shows the results obtained by embedding a 64 × 64 Chinese character into a 256 × 256 Lena image for 25 iterations of each 8 × 8 block using DE. Figure 13.4 shows the results obtained by embedding a 64 × 64 flower image into a 256 × 256 Barbara image for 100 iterations of each 8 × 8 block using GA and DE. Figure 13.5 shows the results obtained by embedding a 64 × 64 Chinese character into a 256 × 256 Cameraman image for 50 iterations of each 8 × 8 block using GA and DE. Comparing Figures Figure 13.4d and comparing Figures Figure 13.5d, we can observe that the extracted secret messages from the DE-generated stego-images have higher quality than those from the GA-generated stego-images.
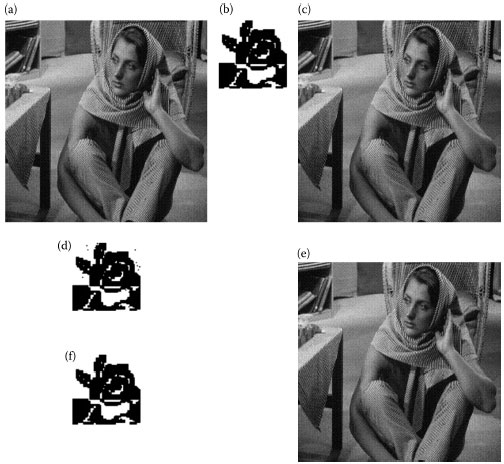
FIGURE 13.4 The images before and after the applications of GA and DE algorithms. (a) Barbara 256 × 256 cover-image, (b) flower 64 × 64 watermark, (c) Barbara stego-image after 100 iterations using GA, (d) extracted watermark from (c), (e) Barbara stego-image after 100 iterations using DE, and (f) extracted watermark from (e)
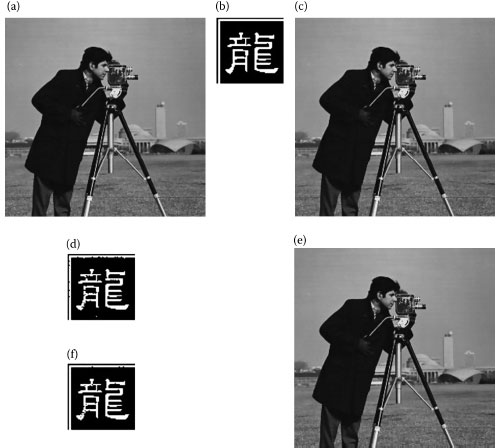
FIGURE 13.5 The images before and after the applications of GA and DE algorithms. (a) Cameraman 256 × 256 cover-image, (b) Chinese character 64 × 64 watermark, (c) cameraman stego-image after 50 iterations using GA, (d) extracted watermark from (c), (e) cameraman stego-image after 50 iterations using DE, and (f) extracted watermark from (e)..
In this chapter, a different evolutionary approach, named DE, is used for image steg-anography to break the VSS. It is a simple and efficient adaptive scheme for global optimization over continuous space. Experimental results show that the DE-based steganography is superior to the GA-based steganography. The application of DE algorithm not only improves the PSNR values of the stego-images, but also upgrades the NC values of the extracted secret messages for the same number of iterations as in that of GA algorithm.
Avcibas, I., Memon, N., and Sankur, B., Steganalysis using image quality metrics, IEEE Trans Image Process, 12(2), 221–229, 2003.
Beyer, H. and Schwefel, H., Evolution strategies—a comprehensive introduction, Nat Comput, 1, 3–52, 2004.
Cox, I. J., Miller, M., and Bloom, J., Digital Watermarking: Principles & Practice, San Francisco: Morgan Kaufmann, 2001.
Fridrich, J., Goljan, M., and Hogea, D., New methodology for breaking steganographic techniques for JPEGs, Proc of SPIE Electronic Imaging, Santa Clara, CA, pp. 143–155, 2003.
Holland, J. H., Adaptation in Natural and Artificial Systems, Ann Arbor, Michigan: The University of Michigan Press, 1975.
Karboga, D. and Okdem, S., A simple and global optimization algorithm for engineering problems: differential evolution algorithm, Turkish J Electr Eng Comput Sci, 12(1), 53–60, 2004.
Kessler, G. C., An overview of steganography for the computer forensics examiner, Forensic Sci Commun, 6(3), 1–29, 2004.
Price, K., Storn, R., and Lampinen, J., Differential Evolution: A Practical Approach to Global Optimization, Berlin:Springer, 2005.
Provos, N. and Honeyman, P., Hide and seek: An introduction to steganography, IEEE Sec Priv Mag, 1(3), 32–44, 2003.
Shih, F. Y., Digital Watermarking and Steganography: Fundamentals and Techniques, Boca Raton FL: CRC Press,, 2007.
Shih, F. Y. and Edupuganti, V. G., A differential evolution based algorithm for breaking the visual steganalytic system, Soft Comput, 13(4), 345–353, 2009.
Wayner, P., Disappearing Cryptography: Information Hiding: Steganography and Watermarking, Second Ed., San Francisco: Morgan Kaufmann, 2002.
Westfeld, A. and Pfitzmann, A., Attacks on steganographic systems breaking the steganographic utilities Ezstego, Jsteg, Steganos and S-Tools and some lessons learned, Proc Third Intl Workshop on Information Hiding, Dresden Germany, pp. 61–76, Sep. 1999a.
Westfeld, A. and Pfitzmann, A., Attacks on steganographic systems, Proc Third Intl Workshop on Information Hiding, Lecture Notes in Computer Science, Berlin:Springer-Verlag, : vol. 1768, pp. 61–76, 1999b.
Wu, Y. and Shih, F. Y., Genetic algorithm based methodology for breaking the steganalytic systems, IEEE Trans Syst, Man Cybern, 36(1), 24–29, 2006.