
Genetic Algorithm-Based Methodology for Breaking the Steganalytic Systems |
CONTENTS
14.2 Overview of our GA-Based Breaking Methodology
14.3 GA-Based Breaking Algorithm on SDSS
14.3.1 Generating the Stego-Image on the Visual Steganalytic System
14.3.2 Generating the Stego-Image on the IQM-Based Steganalytic System (IQM-SDSS)
14.4 GA-Based Breaking Algorithm on FDSS
14.5.1 GA-Based Breaking Algorithm on VSS
14.5.2 GA-Based Breaking Algorithm on IQM-SDSS
14.5.3 GA-Based Breaking Algorithm on JFDSS
Steganography is an ancient art of hiding secret messages within another apparently innocuous carrier in such a way that only the receiver knows the existence of the messages. It is different from cryptography which encodes messages, so that nobody can read it without the specific key. Another technique, digital watermarking (Cox et al., 2001; Wu and Shih, 2004), is concerned with issues related to copyright protection and intellectual property and therefore a watermark usually contains the information regarding the carrier and the owner. The well-known steganographic methods include covert channel, invisible ink, microdot, and spread-spectrum communication (Norman, 1973; Kahn, 1996). Although steganography is an ancient subject, computer technology provides a new aspect of applications by hiding messages in the multimedia materials, such as audio and images.
A famous classic steganographic model presented by Simmons (1984) is the prisoners’ problem that Alice and Bob in a jail plan to escape together. All communications between them are monitored by Wendy, a warden. Therefore, they must hide the messages in other innocuous-looking media (cover-object) in order to obtain the stego-object. Then, the stego-object is sent through the public channel. Wendy is free to inspect all the messages between Alice and Bob with two options, passive or active. The passive way is to inspect the message in order to determine whether it contains a hidden message and then to conduct a proper action. On the other hand, the active way is always to alter messages though Wendy may not perceive any trace of a hidden message. Note that, in this chapter we focus on the passive warden.
For steganographic systems, the fundamental requirement is that the stego-object should be perceptually indistinguishable to the degree that it does not raise suspicion. In other words, the hidden information introduces only slight modification to the cover-object. Most passive warden distinguishes the stego-images by analyzing their statistical features.
In general, the steganalytic systems can be categorized into two classes: spatial-domain steganalytic system (SDSS) and frequency-domain steganalytic system (FDSS). The SDSS (Westfeld and Pfitzmann, 1999; Avcibas et al., 2003) is adopted for checking the lossless compressed images by analyzing the spatial-domain statistical features. For the lossy compression images such as JPEG, FDSS (Farid, 2001; Fridrich et al., 2003) is used to analyze the frequency-domain statistical features. Westfeld and Pfitzmann (1999) presented two SDSSs based on visual and chi-square attacks. The visual attack uses human eyes to inspect stego-images by checking their lower bit-planes. The chi-square attack can automatically detect the specific characteristic generated by the least-significant bit (LSB) steganographic technique. Avcibas and Sankur (2002) proposed image quality measure (IQM) which is based on a hypothesis that the steganographic systems leave statistical evidences that can be exploited for detection using IQM and multivariate regression analysis. Fridrich et al. (2003) presented an FDSS for detecting the JPEG stego-images by analyzing their discrete cosine transformation (DCT) with cropped images. The above steganalytic systems (Westfeld and Pfitzmann, 1999; Avcibas et al., 2003; Fridrich et al., 2003) are used in our experiments to test the correctness of our GA-based methodology.
Since the steganalytic system analyzes certain statistical features of an image, the idea of developing a robust steganographic system is to generate the stego-image by avoiding changing the statistical features of the cover-image. In literature, several papers have presented the algorithms for steganographic and steganalytic systems. Very few papers have discussed the algorithms for breaking the steganalytic systems. Recently, Chu et al. (2004) presented a DCT-based steganographic system by using the similarities of DCT coefficients between the adjacent image blocks where the embedding distortion is spread. Their algorithm can allow random selection of DCT coefficients in order to maintain key statistical features. However, the drawback of their approach is that the capacity of the embedded message is limited, that is, only 2 bits for an 8 × 8 DCT block.
In this chapter, we present a new method for breaking steganalytic systems (Wu and Shih, 2006). The emphasis is shifted from traditionally avoiding the change of statistical features to artificially counterfeiting them. Our paper is based on the methodology: in order to manipulate the statistical features for breaking the inspection of steganalytic systems, the genetic algorithm (GA)-based approach is adopted to counterfeit several stego-images (candidates) until one of them can break the inspection of steganalytic systems. We are the first to utilize the evolutionary algorithms in the field of steganographic systems.
This chapter is organized as follows. The overview of our GA-based breaking methodology is described in Section 14.2. We present our GA-based breaking algorithm on SDSS and FDSS in Sections 14.3 and 14.4, respectively. Experimental results are shown in Section 14.5. The complexity analysis is provided in Section 14.6. Finally, we draw conclusions in Section 14.7.
14.2 OVERVIEW OF OUR GA-BASED BREAKING METHODOLOGY
The GA, introduced by Holland (1975) in his seminal work, is commonly used as an adaptive approach that provides a randomized, parallel, and global search based on the mechanics of natural selection and genetics in order to find solutions to a problem.
In general, the GA starts with some randomly selected genes as the first generation, called population. Each individual in the population corresponding to a solution in the problem domain is called chromosome. An objective, called fitness function, is used to evaluate the quality of each chromosome. The chromosomes of high quality will survive and form a new population of the next generation. Using the three operators: reproduction, crossover, and mutation, we can recombine a new generation to find the best solution. The process is repeated until a predefined condition is satisfied or a constant number of iterations are reached. The predefined condition in this chapter is the situation when we can correctly extract the desired hidden message.
In order to apply the GA for embedding messages into the frequency domain of a cover-image to obtain the stego-image, we use the chromosome, ξ, consisting of n genes as ξ = g0, g1g2, …, gn. Figure 14.1 gives an example of a chromosome (ξ ∈, Z64) containing 64 genes (gi∈ Z (integers)). Figure 14.1a shows the distribution order of a chromosome in an 8 × 8 block, and Figure 14.1b shows an example of the corresponding chromosome.
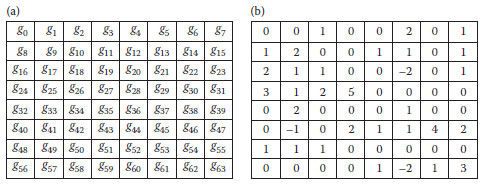
FIGURE 14.1 The numbering positions corresponding to 64 genes. (a) The distribution order of a chromosome in an 8 × 8 block and (b) an example of the corresponding chromosome.
The chromosome is used to adjust the pixel values of a cover-image to generate a stego-image, so that the embedded message can be correctly extracted and at the same time the statistical features remain in order to break steganalytic systems. A fitness function is used to evaluate the embedded message and statistical features.
Let C and S, respectively, denote the cover- and the stego-images of size 8 × 8. We generate the stego-images by adding the cover-image and the chromosome as
(14.1) |
In order to embed messages into DCT-based coefficients and avoid the detection of steganalytic systems, we develop a fitness function to evaluate the following two terms:
1. Analysis(ξ, C)—The analysis function evaluates the difference between the cover-image and the stego-image in order to maintain the statistical features. It is related to the type of the steganalytic systems used and will be explained in Sections 14.3 and 14.4.
2. BER(ξ,C)—The bit error rate (BER) sums up the bit differences between the embedded and the extracted messages. It is defined as
(14.2) |
where MessageHand MessageEdenote, respectively, the embedded and the extracted binary messages, and denotes the length of the message. For example, if MessageH = 11111 and MessageE = 10101, then BER (ξ,C) = 0.4.
We use a linear combination of the analysis and the BER to be the fitness function as
(14.3) |
where α1 and α2 denote weights. The weights can be adjusted according to the user’s demand on the degree of distortion to the stego-image or the extracted message.
(14.4) |
where Ω is a threshold for sieving chromosomes, and ψ={ξ1,ξ2,…,ξn}. It is used to reproduce k better chromosomes from the original population for higher qualities.
(14.5) |
where Θ denotes the operation to generate chromosomes by exchanging genes from their parents: ξiand ξjIt is used to gestate l better offspring by inheriting good genes (i.e., higher qualities in the fitness evaluation) from their parents. The often-used crossovers are one-point, two-point, and multipoint crossovers. The criteria of selecting a suitable crossover depend on the length and structure of chromosomes. We adopt the one- and two-point crossovers as shown in Shih and Wu (2005) through this chapter.
(14.6) |
where ∘ denotes the operation to randomly select a chromosome ξi from ψ and change the j-th bit from ξi. It is used to generate m new chromosomes. The mutation is usually performed with a probability p (0 < p ≤ 1), meaning only p portion of the genes in a chromosome will be selected to be mutated. Since the length of a chromosome is 64 in this chapter and there are only one or two genes to be mutated when the GA mutation operator is performed, we select p to be 1/64 or 2/64.
Note that in each generation, the new population is generated by the above three operations. The new population is actually the same size of k + l + m as the original population. Note that, to break the inspection of the steganalytic systems, we use a straightforward GA-selection method that the new generation is generated based on the chromosomes having superior evaluation values in the current generation. For example, only top 10% of the current chromosomes will be considered for the GA operations, such as reproduction, crossover, and mutation.
The mutation tends to be more efficient than the crossover if a candidate solution is close to the real optimum solution. In order to enhance the performance of our GA-based methodology, we generate a new chromosome with desired minor adjustment when the previous generation is close to the goal. Therefore, the strategy of dynamically determining the ratio of three GA operations is used. Let RP, Rm, and RC, respectively, denote the ratios of production, mutation, and crossover. In the beginning, we select a small RP and RM and a large RC to enable the global search. After certain iterations, we will decrease RC and increase RM and RP to shift focuses on local search if the current generation is better than the earlier one; otherwise, we will increase RC and decrease Rmand RP to enlarge the range of global search. Note that, this property must be satisfied: RP + RM + RC = 100%.
The recombination strategy of our GA-based algorithm is presented below. We apply the same strategy in recombining the chromosome through this chapter except that the fitness function is differently defined with respect to the properties of individual problem.
The Algorithm for Recombining the Chromosomes:
1. Initialize the base population of chromosomes, RP, RM, and RC.
2. Generate candidates by adjusting pixel values of the original image.
3. Determine the fitness value of each chromosome.
4. If a predefined condition is satisfied or a constant number of iterations are reached, the algorithm will stop and output the best chromosome to be the solution; otherwise, go to the following steps to recombine the chromosomes.
5. If a certain number of iterations are reached, go to step 6 to adjust RP, RM, and RC; otherwise, go to step 7 to recombine the new chromosomes.
6. If 20% of the new generation are better than the best chromosome in the preceding generation, then RC = RC – 10%, RM = RM + 5%, and RP = RP+ 5%; otherwise, RC = RC+ 10%, RM = RM – 5%, and RP = RP – 5%.
7. Obtain the new generation by recombining the preceding chromosomes using production, mutation, and crossover.
8. Go to step 2.
14.3 GA-BASED BREAKING ALGORITHM ON SDSS
As aforementioned, in order to generate a stego-image to pass though the inspection of SDSS, the messages should be embedded into the specific positions for maintaining the statistical features of a cover-image. In the spatial-domain embedding approach, it is difficult to select such positions since the messages are distributed regularly. On the other hand, if the messages are embedded into specific positions of coefficients of a transformed image, the changes in the spatial domain are difficult to predict. In this section, we intend to find the desired positions on the frequency domain that produce minimum statistical features disturbance on the spatial domain. We apply the GA to generate the stego-image by adjusting the pixel values on the spatial domain using the following two criteria:
1. Evaluate the extracted messages obtained from the specific coefficients of a stego-image to be as close as to the embedded messages.
2. Evaluate the statistical features of the stego-image and compare them with those of the cover-image such that the differences should be as small as possible.
14.3.1 GENERATING THE STEGO-IMAGE ON the VISUAL STEGANALYTIC SYSTEM
Westfeld and Pfitzmann (1999) presented a visual steganalytic system (VSS) that uses an assignment function of color replacement, called the visual filter, to efficiently detect a stego-image by translating a gray-scale image into binary. Therefore, in order to break the VSS, the two results, VFC and VFS, of applying the visual filter on the cover- and the stego-images, respectively, should be as identical as possible. The VSS was originally designed to detect the GIF format images by reassigning the color in the color palette of an image. We extend their method to detect the BMP format images as well by setting the odd- and even-numbered gray scales to black and white, respectively. The Analysis (ξ, C) to VSS indicating the sum of difference between LSBCand LSBSis defined as
(14.7) |
where ⨁ denotes the exclusive-OR (XOR) operator. Our algorithm is described below.
The Algorithm for Generating a Stego-image on VSS:
1. Divide a cover-image into a set of cover-images of size 8 × 8.
2. For each 8 × 8 cover-image, we generate a stego-image based on the GA to perform the embedding procedure as well as to ensure that LSBC and LSBS are as identical as possible.
3. Combine all the 8 × 8 stego-images together to form a complete stego-image.
14.3.2 GENERATING THE STEGO-IMAGE ON the IQM-BASED STEGANALYTIC SYSTEM (IQM-SDSS)
Avcibas et al. (2003) proposed a steganalytic system by analyzing the IQMs (Avcibas and Sankur, 2002) of the cover- and the stego-images. The IQM–SDSS consists of two phases: training and testing. In the training phase, the IQM is calculated between an image and its filtered image using a low-pass filter based on the Gaussian kernel. Suppose there are N images and q IQMs in the training set. Let xij denote the score in the i-th image and the j-th IQM, where 1 ≤ i ≤ N, 1 ≤ j ≤ q. Let yi be the value of –1 or 1 indicating the cover- or stego-image, respectively. We can represent all the images in the training set as
(14.8) |
where ε1;, ε2, …, εN denote random errors in the linear regression model (Rencher, 1995). Then the linear predictor β = [β1, β2, …, βq] can be obtained from all the training images.
In the testing phase, we use the q IQMs to compute yi to determine whether it is a stego-image. If yt is positive, the test image is a stego-image; otherwise, it is a cover-image.
We first train the IQM-SDSS in order to obtain the linear predictor, that is, β = [β1, β2, …, βq], from our database. Then, we use β to generate the stego-image by our GA-based algorithm, so that it can pass through the inspection of IQM-SDSS.
Note that the GA procedure is not used in the training phase. The Analysis (ξ,C) to the IQM-SDSS is defined as
(14.9) |
The Algorithm for Generating a Stego-image on IQM-SDSS:
1. Divide a cover-image into a set of cover-images of size 8 × 8.
2. Adjust the pixel values in each 8 × 8 cover-image based on GA to embed messages into the frequency domain and ensure that the stego-image can pass through the inspection of the IQM-SDSS. The procedures for generating the 8 × 8 stego-image are presented next after this algorithm.
3. Combine all the 8 × 8 embedded-images together to form a completely embedded image.
4. Test the embedded-image on IQM-SDSS. If it passes, it is the desired stego-image; otherwise, repeat steps 2–4.
The Procedure for Generating an 8 × 8 Embedded-image on IQM-SDSS:
1. Define the fitness function, the number of genes, the size of population, the crossover rate, the critical value, and the mutation rate.
2. Generate the first generation by a random selection.
3. Generate an 8 × 8 embedded-image based on each chromosome.
4. Evaluate the fitness value for each chromosome by analyzing the 8 × 8 embedded-image.
5. Obtain the better chromosome based on the fitness value.
6. Recombine new chromosomes by crossover.
7. Recombine new chromosomes by mutation.
8. Repeat steps 3–8 until a predefined condition is satisfied or a constant number of iterations are reached.
14.4 GA-BASED BREAKING ALGORITHM ON FDSS
Fridrich et al. (2003) presented a steganalytic system for detecting JPEG stego-images based on the assumption that the histogram distributions of some specific AC DCT coefficients of a cover-image and its cropped image should be similar. Note that, in the DCT coefficients, only the zero frequency (0,0) is the DC component, and the remaining frequencies are the AC components. Let hkl(d) and , respectively, denote the total number of AC DCT coefficients in the 8 × 8 cover and its corresponding 8 × 8 cropped images with the absolute value equal to d at location (k,l), where 0 ≤ k, l ≤ 7. Note that, the 8 × 8 cropped images, defined in Fridrich et al. (2003), are obtained using the same way as the 8 × 8 cover images with a horizontal shift by four pixels.
The probability, ρkl, of the modification of a nonzero AC coefficient at (k,l) can be obtained by
(14.10) |
Note that, the final value of the parameter p is calculated as an average over the selected low-frequency DCT coefficients (k, l) ∈ {(1, 2), (2, 1), (2, 2)}, and only 0, 1, and 2 are considered when checking the coefficient values of the specific frequencies between a cover and its corresponding cropped image.
Our GA-based breaking algorithm on the JFDSS is intended to minimize the differences between the two histograms of a stego-image and its cropped-image. It is presented below.
Algorithm for Generating a Stego-image on JFDSS:
1. Compress a cover-image by JPEG and divide it into a set of small cover-images of size 8 × 8. Each is performed by DCT.
2. Embed the messages into the specific DCT coefficients and decompress the embedded image by IDCT.
3. We select a 12×8 working window and generate an 8×8 cropped-image for each 8×8 embedded-image.
4. Determine the overlapping area between each 8×8 embedded-image and its cropped-image.
5. Adjust the overlapping pixel values by making that the coefficients of some specific frequencies (k, l) of the stego-image and its cropped-image are as identical as possible and the embedded messages are not altered.
6. Repeat steps 3–6 until all the 8×8 embedded-images are generated.
Let CoefStegoand CoefCrop denote the coefficients of each 8 × 8 stego-image and its cropped-image. The Analysis(ξ, C) to the JFDSS is defined as
(14.11) |
where ⊗ denotes the operator defined by
(14.12) |
Note that, 0, 1, and 2 denote the values in the specific frequencies obtained by dividing the quantization table. We only consider the values of the desired frequencies to be 0, 1, 2, or some values in Equation 14.12 because of the strategy of JFDSS in Equation 14.10.
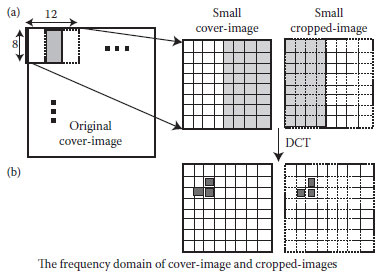
FIGURE 14.2 An example of our GA-based algorithm on the JFDSS. (a) A 128 working window; (b) the desired locations.
Figure 14.2 shows an example of our GA-based algorithm on the JFDSS. In Figure 14.2a, we select a 12×8 working window for each 8×8 stego-image, and generate its 8×8 cropped-image. Note that, the shaded pixels indicate their overlapping area, and the three black boxes in Figure 14.2b are the desired locations.
In this section, we provide experimental results to show that our GA-based stegano- graphic system can successfully break the inspection of steganalytic systems. For testing our algorithm, we use a database of 200 gray-scale images of size 256 × 256. All the images were originally stored in the BMP format.
14.5.1 GA-BASED BREAKING ALGORITHM ON VSS
We test our algorithm on VSS. Figure 14.3a and f shows a stego-image and a message-image of sizes 256×256 and 64×64, respectively. We embed four bits into the 8×8 DCT coefficients on frequencies (0,2), (1,1), (2,0), and (3,0) for avoiding distortion. Note that, the stego-image in Figure 14.3a is generated by embedding Figure 14.3f into the DCT coefficients of the cover-image using our GA-based algorithm. In Figure 14.3b – j respectively, display the bit-planes from 7 to 0. Figure 14.4 shows the stego-image and its visual filtered result. It is difficult to determine that Figure 14.4a is a stego-image.
Figure 14.5 shows the relationship of the average iteration for adjusting an 8×8 cover-image versus the correct rate of the visual filter. The correct rate is the percentage of similarity between the transformed results of the cover- and the stego- images using the visual filter. Note that, the BERs in Figure 14.5 are all 0%.

FIGURE 14.3 A stego-image generated by our GA-based algorithm and its 8 bit-planes. (a) The embedding of (f) into the DCT coefficients of the cover-image using the proposed GA-based algorithm, (b)-(e) and (g)-(j), respectively, display the bit-planes from 7 to 0.
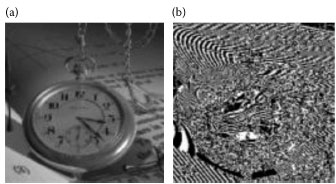
FIGURE 14.4 (a) A stego-image and (b) its visual filtered result.
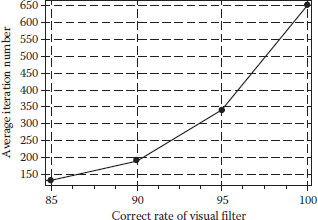
FIGURE 14.5 The relationship of the average iteration versus the correct rate of the visual filter.
14.5.2 GA-BASED BREAKING ALGORITHM ON IQM-SDSS
We generate three stego-images as the training samples for each cover-image by Photoshop plug-in Digimarc (PictureMarc, 2006), Cox’s technique (Cox et al., 1997), and S-Tools (Brown, 1994). Therefore, there are totally 800 images of 256 × 256 size, including 200 cover-images and 600 stego-images. The embedded message sizes were 1/10, 1/24, and 1/40 of the cover image size for Digimarc, Cox’s technique, and S-Tools, respectively. Note that the IQM-SDSS (Avcibas et al., 2003) can detect the stego-images containing the message size of 1/100 of the cover-image. We develop the following four training strategies to obtain the linear predictors as:
1. Train all the images in our database to obtain the linear predictor βA.
2. Train 100 cover-images and 100 stego-images to obtain the linear predictor βB, in which the stego-images are obtained by Cox’s technique.
3. Train 100 cover-images and 100 stego-images to obtain the linear predictor βC, in which the stego-images are obtained by Photoshop plug-in Digimarc.
4. Train 100 cover-images and 100 stego-images to obtain the linear predictor βD, in which the stego-images are obtained by S-Tools.
In the testing phase, we generate 50 stego-images for each linear predictor. Therefore, we will obtain four types of stego-images SIA, SIB, SIC, and SID corresponding to βA, βB, βC, and βD, respectively. It is obvious that all the SIAimages will pass through the inspection of IQM-SDSS with the linear predictor βA, but may fail with other linear predictors, similarly for the SIB, SIC, and SID.
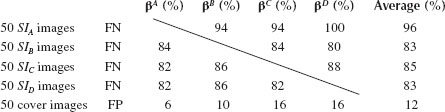
Table 14.1 shows the false-negative (FN; Type I Error) and false-positive (FP; Type II Error) rates of testing each type of stego- and cover-images under different linear predictors. For example, the FN rate of testing 50 SIA stego-images under βB is 94% indicating that the βB-IQMSS falsely decides that 94% of our stego-images belong to the cover-image. On the other hand, the FP rate of testing 50 cover-images under β is 10% indicating that the βB-IQMSS decides that 10% of cover-images belong to the stego-images. Note that the cover-images used in the testing phase are different to those used in the training phase.
TABLE 14.1
The Experimental Results of GA -Based Algorithm on IQM-SDSS
14.5.3 GA-BASED BREAKING ALGORITHM ON JFDSS
Figure 14.6 shows an example of adjusting an 8 × 8 embedded-image to obtain an 8 × 8 stego-image for breaking the JFDSS. Figure 14.6b and c shows a 12 × 8 working window, where the enclosed is the overlapping area. Figure 14.6b show the original 8 × 8 embedded- and cropped-images, respectively. We embed “1” on (1,2), (2,1), and (2,2) by compressing Figure 14.6b using JPEG under 70% compression quality to obtain Figure 14.6d. Note that, the top-left pixel is (0,0) and the messages can be embedded into any frequency of the transformed domain, so that the embedding capacity could be sufficiently high. Due to this, the JFDSS only checks frequencies (1, 2), (2,1), and (2,2), we show an example of embedding three bits into these three frequencies. Similarly, Figure 14.6e is obtained by compressing Figure 14.6f using JPEG under the same compression quality. By evaluating the frequencies (1,2), (2,1), and (2,2), the JFDSS can determine whether the embedded-image is a stegoimage. Therefore, in order to break the JFDSS, we obtain the stego-image as in Figures 14.6f Figures 14.6g and h respectively show the new embedded- and cropped-images. Similarly, we obtain Figures 14.6i and j by compressing Figures 14.6g and h, respectively, using JPEG under 70% compression quality. Therefore, the JFDSS cannot distinguish from the frequencies (1,2), (2,1), and (2,2).
Let Q Table(i, j) denote the standard quantization table, where 0 ≤ i, j ≤ 7. The new quantization table, NewTable(i, j), with x% compression quality can be obtained by
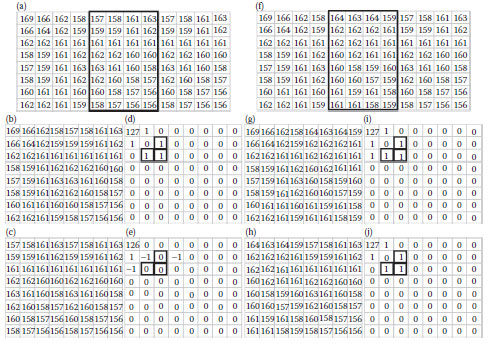
FIGURE 14.6 An example of adjusting an 8 × 8 embedded-image
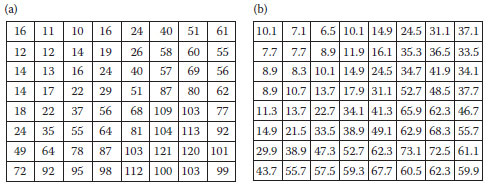
FIGURE 14.7 (a) The standard quantization table and (b) the quantization table using JPEG under 70% compression quality.
(14.13) |
where the factor is determined by
(14.14) |
Figures 14.7a and b show the quantization tables of the standard and 70% compression quality, respectively.
In general, the complexity of our GA-based algorithm is related to the size of the embedded message and the position of embedding (Shih and Wu, 2003). Figure 14.8 shows the relationship between the embedded message and the required iterations in which the cover-image is of size 8 × 8 and the message is embedded into the LSB of the cover-image by the zigzag order starting from the DC (zero-frequency)component. We observe that the more messages embedded in a stego-image, the more iterations are required in our GA-based algorithm. Figure 14.9 shows an example when we embed a 4-bit message into the different bit-plane of DCT coefficients. We observe that the lower bit-plane used for embedding, the more iterations are required in our GA-based algorithm.
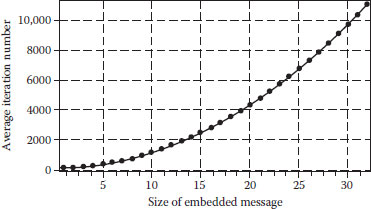
FIGURE 14.8 The relationship between the size of the embedded message and the required iterations.
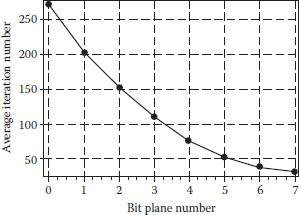
FIGURE 14.9 Embedding a 4-bit message into the different bit-plane.
In this chapter, a new GA-based algorithm of generating a stego-image is used to break the detection of the SDSS and the FDSS by artificially counterfeiting statistical features. We design a fitness function to evaluate the quality of each chromosome in order to generate the stego-image that can pass through the inspection of steganalytic systems. Experimental results show that our GA-based algorithm can not only successfully break the detection of the current steganalytic systems, but also correctly embed messages into the frequency domain of a cover-image. Moreover, our GA-based algorithm can be used to enhance the quality of stego-images.
Avcibas I., Memon, N., and Sankur, B., Steganalysis using image quality metrics, IEEE Trans Image Process, 12(2), 221229, 2003.
Avcibas I. and Sankur, B., Statistical analysis of image quality measures, Electron Imag, 11(206–223), 2002.
Brown A., S-Tools for Windows, Shareware 1994, ftp://idea.sec.dsi.unimi.it/pub/security/crypt/code/s-tools4.zip.
Chu, R., You, X., You, X., and Ba, X., DCT-based image steganographic method resisting statistical attacks, Int Conf on Acoustics, Speech, and Signal Processing, Montreal, Quebec, Canada, May 2004.
Cox, I.J., Bloom, J., Miller, M., and Cox, I., Digital Watermarking: Principles & Practice, San Francisco: Morgan Kaufmann, 2001.
Cox, I.J., Kilian, J., Leighton, T., and Shamoon, T., Secure spread spectrum watermarking for multimedia, IEEE Trans Image Process, 6167–1686, 1997.
Farid, H., Detecting steganographic message in digital images, Technical Report, TR2001412 Computer Science, Dartmouth College, 2001.
Fridrich, J., Goljan, M., and Hogea, D., New methodology for breaking steganographic techniques for JPEGs, Proc EI SPIE, Santa Clara, CA, pp, 143–155, 2003.
Holland, J. H., Adaptation in Natural and Artificial Systems, Ann Arbor, Michigan:The University of Michigan Press, 1975.
Kahn, D., The Codebreakers, 2nd edition, New York: Macmillan, 1996.
Norman, B., Secret Warfare, Washington, DC: Acropolis Books, 1973.
PictureMarc, Embed Watermark, v 1.00.45 Digimarc Corporation, 2006.
Rencher, A.C., Methods of Multivariate Analysis, New York: John Wiley, 1995, Ch. 6, 10.
Shih, F. Y., and Wu, Y.-T., Enhancement of image watermark retrieval based on genetic algorithm, J Visual Commun Image Repre, 16115–133, 2005.
Simmons, G. J., Prisoners’ problem and the subliminal channel, Proc Int Conf on Advances in Cryptology, 51–67, 1984.
Westfeld, A., and Pfitzmann, A., A., Attacks on steganographic systems breaking the steganographic utilities EzStego, Jsteg, Steganos, and S-Tools and some lessons learned, Proc Third Int Workshop on Information Hiding, Dresden, Germany, pp.61–76, 1999.
Wu Y. and Shih, F. Y., An adjusted-purpose digital watermarking technique, Pattern Recognit, 37(12), 2349–2359, 2004.
Wu, Y. and Shih, F. Y., Genetic algorithm based methodology for breaking the steganalytic systems, IEEE Trans Syst, Man Cybern, 36(1),24–29, 2006.