
Chapter 5. Intrusion Detection and Incident Response
Computer security intrusion detection and incident response began as an academic and scientific study in the 1980s. One of the first intrusion detection papers, written by Dorothy Denning, introduced an anomaly detection model that describes the foundation of the technology even today. “The model is based on the hypothesis that security violations can be detected by monitoring a system’s audit records for abnormal patterns of system usage,” Denning wrote.1 Intrusion detection continues to evolve and remains an active area of research and development. The field of incident response emerged from practitioners in response to technology misuse. The first computer emergency response team, the CERT Coordination Center, was created in 1988 in response to the Morris worm. The need to respond and manage security incidents is a practical one, but also an area that can be improved through science. In fact, the practice of incident response naturally includes scientific, or at least scientific-like, inquiry to investigate what, how, and why an incident occurred. Rigor in incident response can be especially important if the incident may eventually become part of a legal proceeding.
Tip
Rigor isn’t just about following a process. Be sure to document what you tried, what worked and didn’t work, and gaps you identified. This is important not only for legal matters, but also for developing new hypotheses later.
Scientific work in intrusion detection and incident response today continues to focus on improving the speed and effectiveness of real-world solutions, especially as network speeds increase. Research and development are also active in applying detection and response to new technologies, from SCADA to the Internet of Things. In recent years the scope of intrusion detection has broadened from a standalone, dedicated IDS machine to distributed, coordinated detection and big data analytics. Scientific thinking can also help dispel intrusion detection folk wisdom like “polymorphic attacks give attackers an advantage” and “antivirus products universally cause a significant performance penalty to workstations.”
In this chapter, you’ll learn how to scientifically evaluate choices for purchasing an intrusion detection system (IDS), how false positives and false negatives affect scientific analysis, how to measure performance and scalability, and how to conduct an example experiment to maximize Snort IDS signature performance.
An Example Scientific Experiment in Intrusion Detection
For an example of scientifically informed development and evaluation in intrusion detection, look at the paper “A Lone Wolf No More: Supporting Network Intrusion Detection with Real-Time Intelligence” by Amann, Sommer, Sharma, and Hall (2012). In the following abstract, you can see that the implied hypothesis is that integrating external intelligence into the IDS decision process produces a broader view that increases reliability of detecting complex attacks. While the primary goal is developing an enhanced IDS solution, the scientific method is used for performance evaluation to determine volume and latency. The authors test the proposed solution under realistic workloads to measure the traffic volume and added delays introduced by their new feature. Unfortunately, the authors do not measure changes in reliability (other than anecdotal evidence) with which to truly evaluate the hypothesis.
Abstract from an intrusion detection experimentFor network intrusion detection systems it is becoming increasingly difficult to reliably report today’s complex attacks without having external context at hand. Unfortunately, however, today’s IDS cannot readily integrate intelligence, such as dynamic blacklists, into their operation. In this work, we introduce a fundamentally new capability into IDS processing that vastly broadens a system’s view beyond what is visible directly on the wire. We present a novel Input Framework that integrates external information in real-time into the IDS decision process, independent of specific types of data, sources, and desired analyses. We implement our design on top of an open-source IDS, and we report initial experiences from real-world deployment in a large-scale network environment. To ensure that our system meets operational constraints, we further evaluate its technical characteristics in terms of the intelligence volume it can handle under realistic workloads, and the latency with which real-time updates become available to the IDS analysis engine. The implementation is freely available as open-source software.2
Because this implementation is available as open source software, it would be easy to develop a competing implementation and compare the two solutions. Alternatively, you may wish to test this solution in a live network and report on a case study of how well it works in your environment compared to your existing intrusion detection system.
False Positives and False Negatives
False positives and false negatives are both errors that occur in imperfect systems and analysis, and arise often in scientific analysis. A false positive occurs when you, your analysis, or your solution incorrectly identifies the presence of an event or phenomenon when it was actually absent. A false negative occurs when you, your analysis, or your solution incorrectly identifies the absence of an event or phenomenon when it was actually present.
Let’s start with a noncybersecurity example. You go to the doctor and are told that you’ve tested positive for ycanthropy and that the test is 99% accurate. But 99% is the probability that if you have the disease then you test positive, not the probability that if you test positive then you have the disease. Because you hope that you don’t have ycanthropy, you would like your test to be a false positive. Suppose that 0.1%—one out of every thousand people—actually have this rare disease. Table 5-1 illustrates real numbers instead of just percentages.
| Sick People | Healthy People | (totals) | |
|---|---|---|---|
| Test result positive | 99 (true positives) | 999 (false positives) | 1,098 |
| Test result negative | 1 (false negatives) | 98,901 (true negatives) | 98,902 |
| (totals) | 100 | 99,900 | 100,000 |
Consider intrusion detection. An IDS has a false positive if it raises an alarm for an intrusion when there was actually none present. Conversely, if the IDS has a false negative, an intrusion slipped through without detection. Both are undesirable. However, sometimes one is more undesirable than the other. In many cases, false positives and false negatives are balanced—that is, lowering one increases the other. In intrusion detection, a corporation may be unwilling to accept false negatives slipping through, and therefore tolerates a greater number of false positives. How many false positives or false negatives are acceptable depends on the situation.
Note
In an important paper, Stefan Axelsson applied the base-rate fallacy to intrusion detection systems and showed that a high percentage of false positives had a significant effect on a system’s efficiency.3 One could say that the “effectiveness” of an IDS depends not on its ability to detect intrusive behavior but on its ability to suppress false alarms.
Nobody but you can tell if something is a false positive or false negative in your network. Say you run Snort with the following rule, which detects denial-of-service attacks by alerting on traffic with the same source and destination IP address, and it is raising lots of alarms:
    alert ip any any -> any any (msg:"BAD-TRAFFIC same SRC/DST";
    sameip; reference:cve,CVE-1999-0016;
    reference:url,www.cert.org/advisories/CA-1997-28.html;classtype:bad-unknown;
    sid:527; rev:4;)
Whenever you see lots of alarms from a rule, especially a newly added rule, you should take a careful look at the validity of the alarms. In this case, this rule is known to cause false positives due to normal Windows server traffic on UDP ports 137 and 138. If you didn’t know this was a common false positive, you would look at the alarms and start by investigating the offending source IP. In this case, it is easy to mitigate the false positives by explicitly ignoring this rule for a Windows server (with IP 10.1.10.1):
    alert ip !10.1.10.1 any -> any any (msg:"BAD-TRAFFIC same SRC/DST";
    sameip; reference:cve,CVE-1999-0016;
    reference:url,www.cert.org/advisories/CA-1997-28.html; classtype:bad-unknown;
    sid:527; rev:4;)
To experiment with false negatives, you could generate packets that
should violate the rule and send it past the IDS. If
there is no alarm, you have a false negative and you should investigate
why the traffic didn’t match the IDS rule. Here is a command to test the
rule used above using hping3, a versatile packet creation
tool:
hping3 10.1.10.1 --udp --spoof 10.1.10.1
These errors are certainly not limited to intrusion detection. Anytime an imperfect system must answer binary (yes/no) questions about the presence or absence of a cybersecurity-related phenomenon, the false positive and negative rates should be calculated. Classical examples include antivirus (is this a virus?), log analysis (are these events correlated?), and network protocol identification (is this an SSL packet?).
Cybersecurity solutions in practice do not have 100% accuracy and therefore have some level of false positives and/or false negatives. The measurement of these types of errors is known as the false positive rate or false negative rate. These rates are probabilities over multiple comparisons. The false positive rate is as follows:
(False Positives) / (False Positives + True Negatives)
The false negative rate is here:
(False Negatives) / (True Positives + False Negatives)
In scientific literature, it is common to see a plot of the true positives and the false positives, known as a receiver operating characteristic (ROC) curve. The graph illustrates the accuracy of the system (called the detector) in single-detection tasks like intrusion detection. In Figure 5-1, you can see how the shape of the curve shows the accuracy of the system, with perfect accuracy in the top-left corner.
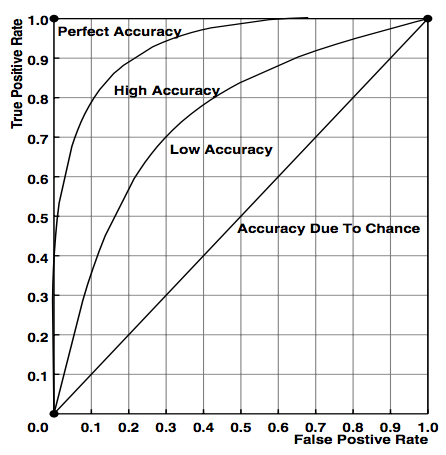
Figure 5-1. Ideal receiver operating characteristic (ROC) curves (from University of Newcastle)
Sometimes it is possible to lower the false positive and false negative rates by sacrificing some other variable, such as performance. Giving the system additional time to calculate a more accurate result could be worth the trade-off, but experimentation is required to understand how much improvement in accuracy can be gained and whether users are willing to accept the added time cost. For evaluation purposes, it is useful to plot detection rate versus false alarms per unit time. These curves convey important information when analyzing and comparing IDSs. An IDS can be operated at any given point on the curve by tuning the system. Complex systems like IDS have many settings and configuration parameters that affect the system’s overall accuracy. Stateful firewalls and intrusion detection systems require more computing power and complexity than stateless systems, but in most situations provide added security and lower false positives and negatives at an acceptable cost.
In the next section we will look at how to measure, test, and report on performance and two other attributes of cybersecurity solutions.
Performance, Scalability, and Stress Testing
Three attributes of cybersecurity products and solutions that are greatly important to users are performance, scalability, and resilience. Cybersecurity protections are often used in hostile environments where adversaries are actively working to break them down. Therefore, users of these defenses want to know how well the offering performs, how well it scales, and how it performs under stress. Buyers often use these attributes to compare products, and to judge products’ value. There are many interpretations for defining and measuring these attributes and selecting the corresponding scientific measurements. Consider these examples:
Our results suggest that keeping up with average data rates requires 120–200 cores.
In the experimental evaluation, the two proposed techniques achieve detection rates in the range 94%–99.6%.
Compared with the native Android system, OurDroid slows down the execution of the application by only 3% and increases the memory footprint by only 6.2%.
Based on the data presented, the SuperSpeedy algorithm clearly outperforms the other AES finalists in throughput.
Each of these statements speaks differently about performance, and indirectly about scalability and resilience. In two cases, you see that the metric is given as a range rather than a single value. Reporting that an intrusion detection system, for example, has a 99% detection rate could be confusing or misleading because detection rates depend on many variables. This variability is also why scalability is important. Cloud computing is attractive to users because a fundamental tenant is the ability to handle unexpected (and expected) changes in demand.
Think about how your cybersecurity process or product changes the operating environment. These changes could improve the status quo, such as a time or memory speedup. Many solutions incur some kind of performance penalty to CPU usage, response time, throughput, etc. You should consider the penalty when using your solution in the average case and in the worst case. If you think that your solution incurs “low overhead,” be prepared to defend that claim.
There are numerous performance benchmarks available today for a variety of use cases. Table 5-2 shows a few.
| Performance benchmark | Description |
|---|---|
| Valgrind | Open source instrumentation framework for dynamic analysis, including a suite of performance benchmarks |
| Linpack | Measures computing power |
| Rodinia | Measures accelerated computing (e.g., GPUs) |
| netperf | Measures network traffic |
| CaffeineMark | Java benchmark |
| BigDataBench | Benchmark for scale-out workloads |
In reality, most researchers don’t use benchmark packages for measuring cybersecurity solutions. Reasons for this include cost and time, but low-cost and low-overhead alternatives are also available to allow you to gather data. In Linux, sysstat provides CPU utilization statistics that might suffice for your analysis. Many developers also create their own tools and techniques for measuring performance. Whatever you choose, be sure to report and adequately describe your methodology and results.
Here are two examples for benchmarking using built-in Linux tools. The first provides timing statistics about this program run. The second detects memory usage and errors.
[~] time ./program1

real    0m0.282s
user    0m0.138s
sys     0m0.083s

[~] valgrind --tool=memcheck ./program1
...
==8423== HEAP SUMMARY:
==8423==     in use at exit: 31,622 bytes in 98 blocks
==8423==   total heap usage: 133 allocs, 35 frees, 68,841 bytes allocated
==8423==
...
Case Study: Measuring Snort Detection Performance
In this section, we will walk through an experiment that measures Snort performance. Snort, the free and lightweight network intrusion detection package, was first introduced at the Large Installation System Administration (LISA) Conference in 1999. It has enjoyed widespread adoption around the world because of its powerful capabilities and open source distribution. Snort’s primary feature is a rule-based signature engine and a rich language for creating signatures to detect activity of interest.
Building on Previous Work
Any practical deployment of Snort has many IDS signatures, possibly even hundreds or thousands. Snort’s algorithms determine the order in which to check the input against the applicable rules. As you can expect, for any given input, the more rules that must be checked and the more computationally intensive the rules are, the slower the entire system performs.
A 2006 study by Soumya Sen confirmed this claim (Figure 5-2). The study author remarked, “The alarming fact about the growth in rule set is that larger rule sets implies more severe time constraints on packet handling and pattern matching by Snort, and failing to cope with this growing trend will mean severe performance deterioration and packet loss.” IDS signature writers are very particular about optimizing rule performance and optimizing rule ordering. For example, defeat rules associated with broad categories of traffic are often processed first because they quickly decide whether there’s a need to process additional rules. Even individual rules can be optimized; a rule which fires based on packet size and content is better optimized by checking the size first (a fast check) before searching the packet content for a match (a slow check). Today Snort has a performance monitor module and performance profiling tools for measuring real-time and theoretical maximum performance.
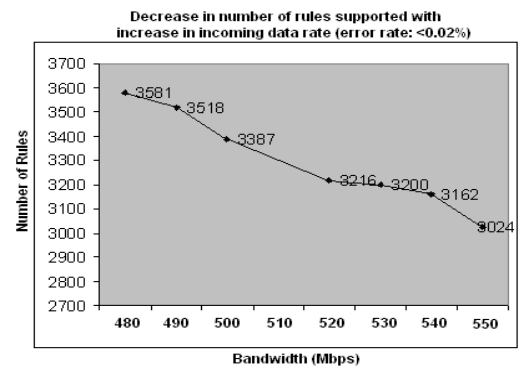
Figure 5-2. Dependence of bandwidth supported on rule set size (payload size: 1452 bytes) (from University of Minnesota)
It might be useful to look at the experimental setup for another evaluation in which the researchers compared their new regular expression pattern matching algorithm to Snort and a commercial SIEM. Note the details about the test environment and the brief introduction to the metrics collected:4
We conducted our experiments on an Intel Core2 Duo E7500 Linux-2.6.3 machine running at 2.93 GHz with 2 GB of RAM. We measure the time efficiency of different approaches in the average number of CPU cycles needed to process one byte of a trace file. We only measure pattern matching and submatch extraction time, and exclude pattern compilation time. Similarly, we measure memory efficiency in megabytes (MB) of RAM used during pattern matching and submatch extraction.
The authors provide specifications about the CPU, OS, and RAM because these details affect the outcome of the evaluation. It is important to record similar details for your experiments.
A New Experiment
Consider a new hypothetical scientific experiment to dynamically reorder Snort rules based on historical usefulness. The intuition is that given a well-chosen set of individually optimized signatures, signatures that have alerted in the recent past are likely to appear again, and therefore should be checked early in the detection process. Here are null and alternative hypotheses:
- H0
Dynamically reordering signatures of recently observed alerts to the top of the list will not improve Snort performance.
- H1
Dynamically reordering signatures of recently observed alerts to the top of the list improves Snort performance.
You will want to compare the performance with and without reordering in order to decide if you should accept the hypothesis. As a control, you could use the results from Sen’s study described above. However, this is unadvised because that study did not publish enough details about the rules used or experimental setup that would allow you to precisely compare your results (you can and should compare your results with that existing study). Instead, you should do a new control test to measure performance where the only variable change is dynamic rule reordering. Testing this hypothesis requires a prototype system that can do what we’ve described, namely reordering signatures in an intelligent way when Snort raises an alarm.
There are several ways to measure performance in this experiment. One would be to observe the effects on the allowable bandwidth throughput, as in Sen’s study. Another choice would be measurement of changes to false positives and false negatives. A third choice would be measuring resource utilization such as memory and CPU load. There is no one right answer, and you may choose more than one set of measurements, but be sure to explain what, how, and why you measured the variables you did.
Figure 5-4 shows a graph that could show how reordering compares to the baseline. This graph shows that dynamic reordering allows you to have a greater number of rules than no reordering at the same network bandwidth. Say that you also measure the attacks detected and false alarms for Snort with and without dynamic reordering. The ROC curve in Figure 5-3 illustrates the comparison between the two systems and summarizes the relationship between false positive and detection probability. With these results, it’s clear that for false alarm rates less than 55%, dynamic reordering increases detection. This is curious since both systems are using the same rules so you’d expect them to have identical ROC curves. We’ve discovered an interesting result that demands further investigation. At this point, it would be useful to set a new hypothesis about the cause and continue looking for the cause.
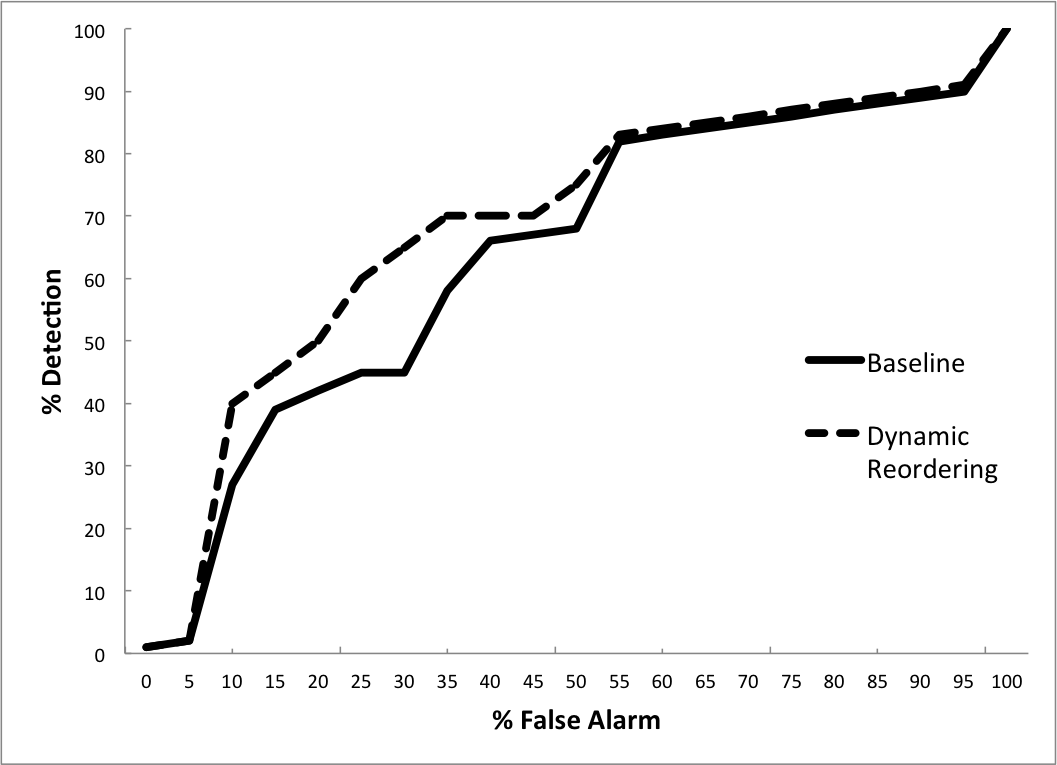
Figure 5-3. ROC curve of the percentage attacks detected versus the percentage of false alarms for Snort IDS with and without dynamic signature reordering
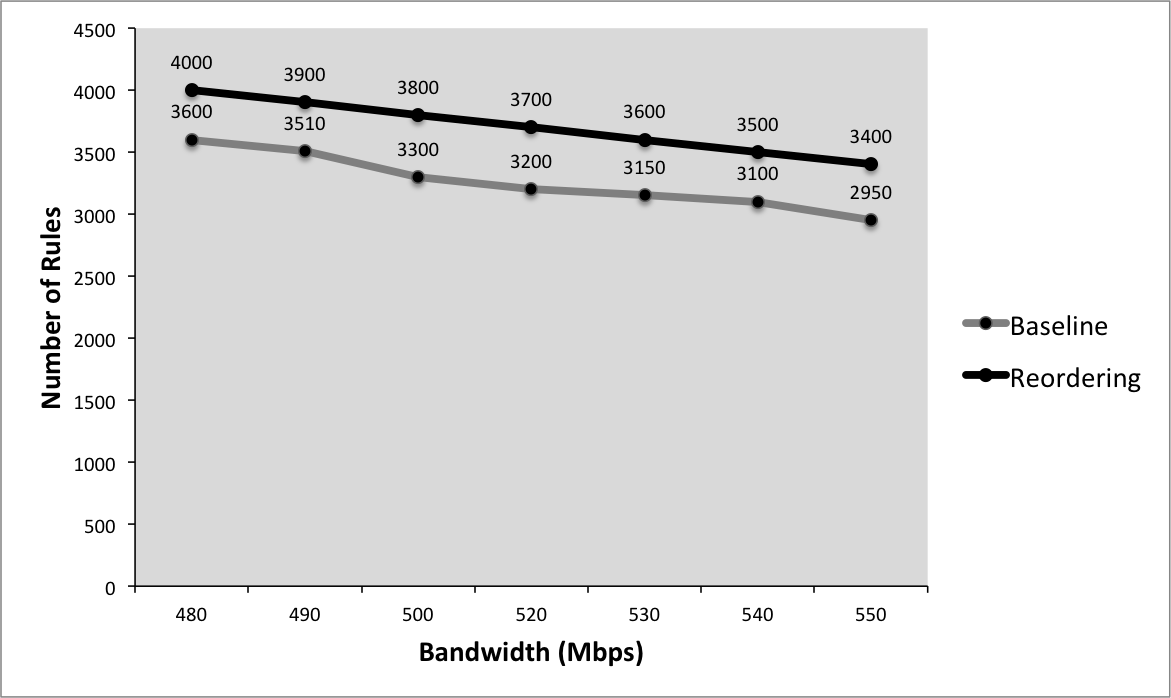
Figure 5-4. Bandwidth versus number of rules for Snort with and without rule reordering
If you’ve proven that dynamic reordering increases Snort performance, people will want to know and use your results. When you document and report the results of this experiment to your boss, team, or colleagues, you will include all the details necessary for another person to replicate the experiment. At a minimum, you would describe the experimental setup (hardware, network, rules used, network traffic source, and data collection instrumentation) and details about the algorithm for rule reordering. In the best case, you should publish or post online the exact Snort rule files used, source code for your modifications, and compilation and runtime commands.
How to Find More Information
Scientific research in this field is published and presented in general cybersecurity journals and conferences and at intrusion-specific venues including the International Symposium on Research in Attacks, Intrusions, and Defenses (RAID) and the Conference on Detection of Intrusions and Malware & Vulnerability Assessment (DIMVA).
Conclusion
This chapter explored cybersecurity science in intrusion detection and incident response. The key takeaways are:
The need to respond and manage security incidents is a practical one, but also an area that can be improved through science.
False positives and false negatives are errors in imperfect systems and analysis which arise in scientific analysis. Modifying intrusion detection systems and their signatures can adjust the rates of false positives and false negatives.
Performance, scalability, and resilience are important to users of cybersecurity products and solutions. Each can be measured and evaluated.
We applied cybersecurity science to an example experiment that measured performance related to dynamically reordered Snort IDS rules.
References
Christopher Gerg and Kerry J. Cox. Managing Security with Snort and IDS Tools. (Boston, MA: O’Reilly, 2004)
Henry H. Liu. Software Performance and Scalability: A Quantitative Approach. (Indianapolis, IN: Wiley, 2009).
David J. Marchette. Computer Intrusion Detection and Network Monitoring: A Statistical Viewpoint. (Heidelberg: Springer, 2001)
Zhenwei Yu and Jeffrey J. P. Tsai. Intrusion Detection: A Machine Learning Approach. (London: Imperial College Press, 2011)
1 Dorothy Denning. “An Intrusion-Detection Model,” IEEE Transactions on Software Engineering, Volume SE-13, Issue 2, Feb. 1987
2 Bernhard Amann, Robin Sommer, Aashish Sharma, and Seth Hall. “A lone wolf no more: supporting network intrusion detection with real-time intelligence.” In Proceedings of the 15th international conference on Research in Attacks, Intrusions, and Defenses (RAID’12), Davide Balzarotti, Salvatore J. Stolfo, and Marco Cova (Eds.). Springer-Verlag Berlin, Heidelberg (2012), 314-333.
3 Stefan Axelsson. “The Base-Rate Fallacy and Its Implications for the Difficulty of Intrusion Detection,” In Proceedings of the 6th ACM Conference on Computer and Communication Security, ACM Press, 1999, pp. 1–7.
4 Liu Yang, Pratyusa K. Manadhata, William G. Horne, Prasad Rao, and Vinod Ganapathy. “Fast Submatch Extraction using OBDDs,” In Proceedings of the eighth ACM/IEEE symposium on Architectures for networking and communications systems (ANCS ’12). ACM, New York, NY, USA, 163−174.