
Chapter 5: Building a Data Bridge with SAS Information Map Studio
5.2 Navigating SAS Information Map Studio
5.3 Creating an Information Map
5.3.1 Identifying External Tables
5.3.3 Organizing Content in Folders
5.3.6 Creating Filters: Pre Filters and Prompted Filters
5.3.7 Data Item Properties Revisited
5.3.8 Features of Hot Spotters Information Map
5.4 Maintaining and Updating an Information Map
5.5 Creating an Information Map with Prompted Linked Filters
5.1 Introduction
Clinicians from the Medical Management department at Healthy Living Inc. struggle with managing the needs of their most complex and sick members. They spend a significant portion of their time collecting data either from the claims systems or, worse yet, from paper medical records before consulting with the patients. They are frustrated because putting patient profiles together takes time away from patient care. The clinicians have difficulty compiling information about patient and population groups, such as those with diabetes or those belonging to a specific primary care home. They currently receive demographic and condition count reports from the SAS programmers in the IT department, but these reports are neither comprehensive nor standardized.
The SAS programmers in the IT department want clinicians to focus on patient care. Using SAS Information Map Studio and SAS Web Report Studio, they develop web applications that deliver comprehensive, standardized, and updated reports about patient and population profiles.
This chapter teaches you how to build information maps. An information map is the bridge between the data warehouse and a web application.
An information map makes complex data easy by adding a layer of business intelligence and logic to data in the warehouse. You can join tables, rename relevant variables to impart business sense, create new variables, and impose security-based data restrictions all in the information map. Moreover, sophisticated user filters and prompts can be built right in the information map. An information map is the primary data source for SAS Web Report Studio.
SAS Information Map Studio is the client application used to create, maintain, and update information maps. Like other BI applications, it is easy to use and powerful, and it has an uncluttered interface. This chapter teaches you how to perform the following tasks in SAS Information Map Studio:
1. Use tables as data sources for the information map.
2. Specify complex join conditions between tables.
3. Rename data items and organize them in folders.
4. Leverage the Properties tab of a data item to apply formats and change the classification of a data item from numeric to character.
5. Compute a new data item based on a wide variety of available SAS functions.
6. Create filters and prompted filters that automatically flow through to SAS Web Report Studio.
Business analysts can leverage information maps to query and analyze data from the warehouse. Information maps can be accessed directly from SAS Add-In for Microsoft Office. They are also available from SAS Enterprise Guide, SAS Web Report Studio, and the SAS BI Dashboard.
The process of creating connection profiles is similar among SAS BI client applications. For a review of how to create a connection profile, see Chapter 4.
5.2 Navigating SAS Information Map Studio
The layout of SAS Information Map Studio is simple. It has a drop-down menu, a toolbar, and three panes. The toolbar is shown in Figure 5.1. Commonly used icons are explained in Table 5.1.
Figure 5.1: The Toolbar in SAS Information Map Studio
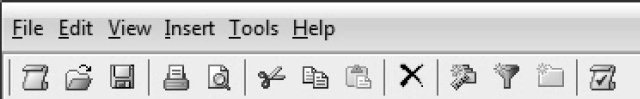
Table 5.1: Commonly Used Icons in SAS Information Map Studio
 |
Opens information map. |
 |
Creates a new data item in the information map. |
 |
Creates a new filter in the information map. |
 |
Runs a test query. This is used to test information maps. |
The three panes in SAS Information Map Studio are Resources, Selected Resources, and Properties. The Resources pane enables you to select data sources for a map. As Figure 5.2 shows, this pane toggles between Application Servers and Information Map Folders. Tables or cubes can be selected from Application Servers. An existing information map is opened from Information Map Folders.
Figure 5.2: Resources Pane in SAS Information Map Studio

The other panes of SAS Information Map Studio, Selected Resources and Properties, are used for actively creating and managing information maps.
Figure 5.3: Selected Resources and Properties Panes of SAS Information Map Studio

The Selected Resources pane has two tabs, Design and Relationships. Design is used for getting variables from tables and organizing them in the information map. Relationships enables users to specify join conditions between selected tables.
The Properties pane enables you to view the properties of an information map column, much like the CONTENTS procedure in SAS does. As you select different items, its properties are reflected in the Properties pane. In Figure 5.3, the properties of Health Plan are displayed.
5.3 Creating an Information Map
An information map needs at least one table as its data source. The information map can contain calculated columns, filters, and prompts. This section creates an information map to support web applications that are built in Chapter 6.
5.3.1 Identifying External Tables
Let’s start by identifying tables that are required by the information map. The goal is to build comprehensive patient and population profiles. The bulk of a patient profile centers on the patient’s medical encounters and demographic information. In an information map, the following tables are used:
• Demographics
• Encounter
• Provider
• DRG
• ICD
To add these tables to an information map, navigate to the DW library, select Resources → Application Servers, and drag the relevant tables to Selected Resources.
5.3.2 Joining Tables
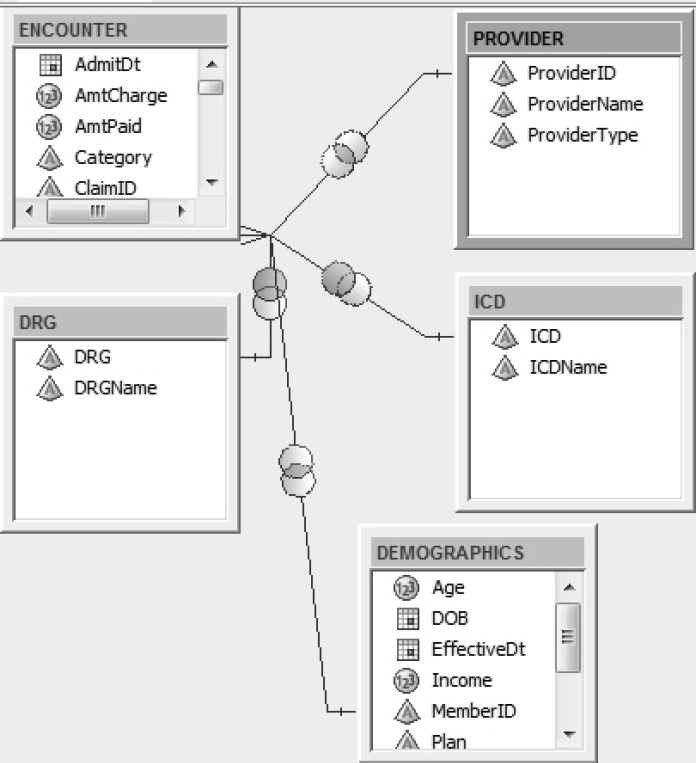
The Demographics table consists of patients and their demographic data. Each row of the table uniquely identifies a patient. Because each patient can have more than one medical encounter, the relationship between the Demographics table and the Encounter table is one to many. Each record from Demographics joins to one or more records from Encounter. Much like Demographics, the Provider table uniquely identifies providers and their characteristics. Encounter has a many to one relationship with Provider.
Consider how the two reference tables, DRG and ICD, relate to Encounter. In the test data, DRG codes correspond with inpatient admissions, and ICD-9 codes correspond with ER visits. It makes sense to join the inpatient portion of Encounter with DRG. Similarly, it makes sense to join the ER part of Encounter with ICD.
By selecting Selected Resources → Relationships, you can specify how each table joins with another table.
1. To join Encounter to Provider, drag ProviderID from Encounter, and drop it onto ProviderID in Provider. Using similar logic, join all five tables as shown in Figure 5.4.
Figure 5.4: Specify Join Relationships between Tables in SAS Information Map Studio
2. To control a join condition, double-click on the Venn diagram joining Encounter and Demographics. This opens the Relationship Properties dialog box as shown in Figure 5.5.
a. Select many to one for Cardinality.
b. Leave the Outer join check boxes under Table 1 and Table 2 unchecked. This creates an inner join.
Figure 5.5: Specify Join between Tables in SAS Information Map Studio

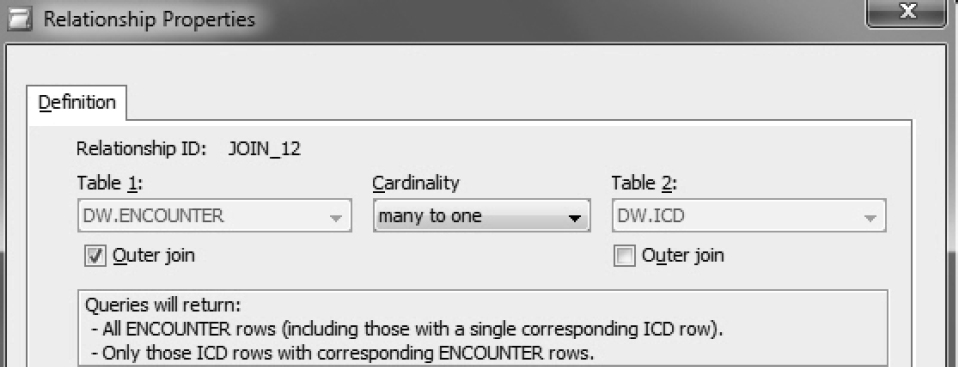
3. Double-click on the Venn diagram joining Encounter and ICD. This is shown by Figure 5.6.
a. Select many to one for Cardinality.
b. Check Outer join under Table 1. This ensures that all records from Encounter are retained, rather than only records that join with ICD.
Figure 5.6: Specify Left Outer Join between Tables in SAS Information Map Studio
4. Repeat step 3 to join Encounter and DRG.
5.3.3 Organizing Content in Folders
SAS Information Map Studio enables you to organize content in folders. This is useful for both the developer and the user of the information map.
This section organizes variables from source tables in information map folders.
In an information map, variables are referred to as data items whose names reflect their labels in the data set. This is useful because variable names in the data warehouse tend to be cryptic, whereas variable labels impart business meaning. Data items can be renamed in an information map.
To create a new folder, click on the New Folder icon in the toolbar, and drag and drop data items into the new folder. Repeat this until all data items are organized by functional areas as shown in Figure 5.7.
Figure 5.7: Folders in an Information Map

Although you have only begun discovering the power of information maps, it is clear that they make complex data easy by hiding the complexities of the data warehouse. A well-organized map is far more meaningful to a business analyst than complex code generated by the SQL procedure.
5.3.4 Setting Properties
Data items in an information map behave similarly to variables in a SAS data set. Data items can be one of two types, measure or category. For example, Age Of Member is a measure data item (think numeric). Health Plan, which contains benefit plans offered by Healthy Living Inc., is a category data item (think character). Data items accept formats as SAS variables do.
The Properties pane in SAS Information Map Studio contains all of the necessary information about a data item. It enables you to change a data item’s type from a measure to a category or vice versa. It specifies how a measure data item should be aggregated. For example, you might want the average of Length of Stay.
Figure 5.8 shows the properties of two data items, Health Plan and Age Of Member.
Figure 5.8: Properties of Data Items
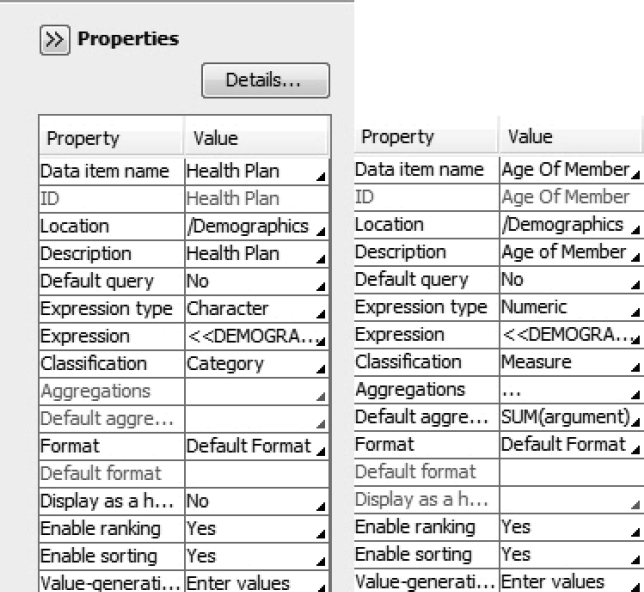
Table 5.2 shows explanations of key elements in the Properties pane.
Table 5.2: Key Elements in the Properties Pane
| Location | Specifies where the data item is located. Health Plan is located in the Demographics folder. |
| Expression | Specifies how the data item relates to the SAS variable. SAS functions can be used to transform source data. |
| Classification | Specifies category or measure. |
Data items can be converted from measure to category and vice versa in SAS Information Map Studio. Consider instances where it is useful to convert a measure data item to a category data item. For example, consider the DRG data item that contains numeric codes. If it is stored in the data warehouse as a numeric, then it would flow through as a measure in an information map. Because it is not a measure, it should be converted to a category in the information map.
5.3.5 Creating Computed Items
A key strength of an information map is the ability to create new data items and integrate them seamlessly with existing data items.
This section creates the following three data items:
• Difference: Billed Minus Paid Amounts
• Percent Paid: Ratio of Paid to Billed Amounts
• Member Count: Distinct Member Count
Computing Difference
1. To create the difference, right-click on the Amount folder, and select New Data Item.
2. In the Data Item Properties window, enter the following information:
a. Data item name: Name of the new data item.
b. Location: Folder where the data item is going to be located.
c. Description: Brief description of the data item.
d. Click Edit to create an expression.
3. Create the expression using a Business Data node or Physical Data node as shown in Figure 5.9.
Figure 5.9: Expression Editor in SAS Information Map Studio

SAS functions can be added to an expression using the Functions tab.
Business Data performs the computation on data after the map query has run. Physical Data performs the computation on data before the map query has run. For complex formulas involving nonadditive operations, Business Data should be used.
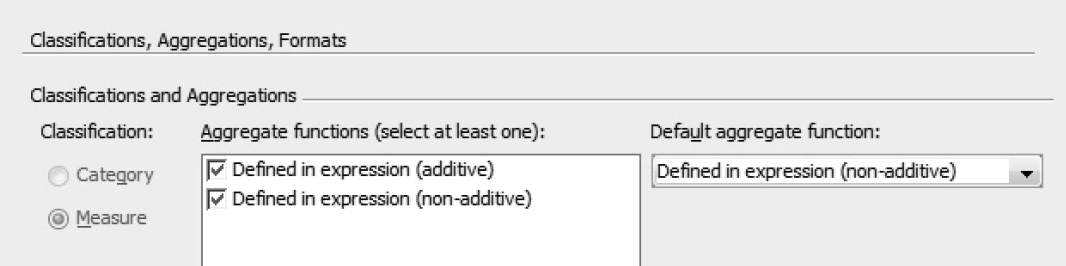
4. In the Data Item Properties window, click the Classification, Aggregations, Formats tab. Change the following information as shown in Figure 5.10:
a. Because the data item is numeric, Measure is selected.
b. By default, all Aggregate functions are selected.
c. The SUM function is selected for Default aggregate function.
d. Under Formats, change format to COMMA.
Figure 5.10: Specify Properties of a Measure

Computing Percent Paid
5. Repeat steps 1 and 2 for Percent Paid.
6. Because Percent Paid is a ratio of two measures, select Business Data as data source. Business Data ensures that the ratio is computed after the map retrieves its data. This is shown in Figure 5.11.
Figure 5.11: Expression Editor in SAS Information Map Studio

7. In the Data Item Properties window, click the Classification, Aggregations, Formats tab. Select Defined in expression (non-additive) for Default aggregate function as shown in Figure 5.12. It would be incorrect to use the addition function in Percent Paid.
Figure 5.12: Specify Properties of a Measure
Computing Member Count
8. Repeat steps 1 through 4 for Member Count, substituting the following expression:
COUNT(DISTINCT <<root.Memberid>>)
5.3.6 Creating Filters
A filter is a way to subset data. SAS Information Map Studio offers three types of filters:
1. basic filters
2. prefilters
3. prompted filters
Filters created in an information map are integrated with other BI applications. They are available in applications such as SAS Web Report Studio. They can be used to standardize the ways to subset data.
A basic filter is the simplest way to subset data. Basic filters are visible to users and applications. You can choose to include filters from an information map in a SAS Web Report Studio report.
Prefilters are similar to basic filters, but they differ in one respect. They are invisible to users and applications. They can be set up so that they are included in any query accessing the information map. This means that you cannot control their usage. In addition, user applications do not see prefilters. A prefilter is not visible in SAS Web Report Studio, but it is included in a SAS Web Report Studio report by default. A prefilter can be used to demonstrate how Healthy Living Inc. ensures that only paid claims are included in analytics.
Prompted filters are the most sophisticated of the three filter types. Whereas basic filters can be thought of as static, hardcoded WHERE statements in the SAS programming language, prompted filters resemble WHERE statements with dynamic macro variables. Depending on their setup, prompted filters give you the choice of entering values or selecting one or more values from a drop-down list.
This section creates a prefilter and several prompted filters.
Creating a Prefilter
1. To create a filter, click on the New Filter icon in the toolbar.
2. In the New Filter dialog box, enter the following information as shown in Figure 5.13.
a. Filter name: Name of the filter.
b. Data item: Source of the filter data.
c. Condition: Select Is equal to.
d. Value(s): Select Enter value(s).
e. Enter ‘Paid’. The use of quotation marks is in syntactical agreement with the SAS programming language.
f. Select the Hide from user check box.
Figure 5.13: Create a New Filter

3. Status appears in the Information Map Contents.
4. To ensure that the information map uses the Status filter every time it is accessed, the filter and its associated table need to be included in the information map. This is done by modifying the map’s properties.
a. Select Edit → Properties.
b. On the General Prefilters tab, move Status from Available filters to Selected filters. This is shown in Figure 5.14.
Figure 5.14: Information Map Properties

c. On the Required Tables tab, move Encounter to Required tables.
5. To test the information map, click on the Run a Test Query  icon in the toolbar.
a. Specify Status, Billed Amt, and Paid Amt in the test query.
b. Click View SQL. Verify that the Status prefilter is included in the test query. This is shown in Figure 5.15.
Figure 5.15: View SQL in Test Query

Creating Prompted Filters
There are two parts to building a prompted filter. The first part is to create a filter. The second part is to create a prompt and tie it to the filter. This section creates prompted filters for MemberID and Name of Provider.
MemberID Prompted Filter
1. To create a filter, click on the New Filter icon in the toolbar.
2. In the New Filter dialog box, enter information as shown in Figure 5.16.
a. Select Prompt user for value(s) for Value(s).
Figure 5.16: Create a Prompted Filter

b. Click New to create a prompt for MemberID.
3. On the General tab of the New Prompt dialog box, enter the following information.
a. Name: Name of the prompt.
b. Displayed text: Text with which the user is prompted.
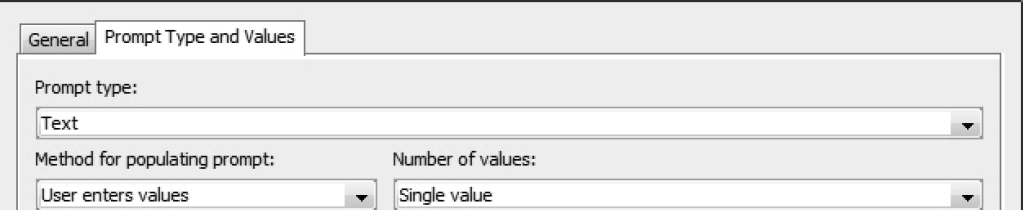
4. On the Prompt Type and Values tab, enter the following information as shown in Figure 5.17.
a. Prompt type: Select Text. MemberId is a character field.
b. Method for populating prompt: Select User enters values. A list of values of MemberID is not a good idea because it would be too long to be helpful to the user.
c. Number of values: Select Single value. The intent of the prompt is to provide information for one member at a time.
Figure 5.17: Create a Prompt
5. The prompt for MemberID is constructed as part of creating a filter for MemberID. As Figure 5.18 shows, the prompt and filter are connected.
Figure 5.18: MemberID Prompted Filter

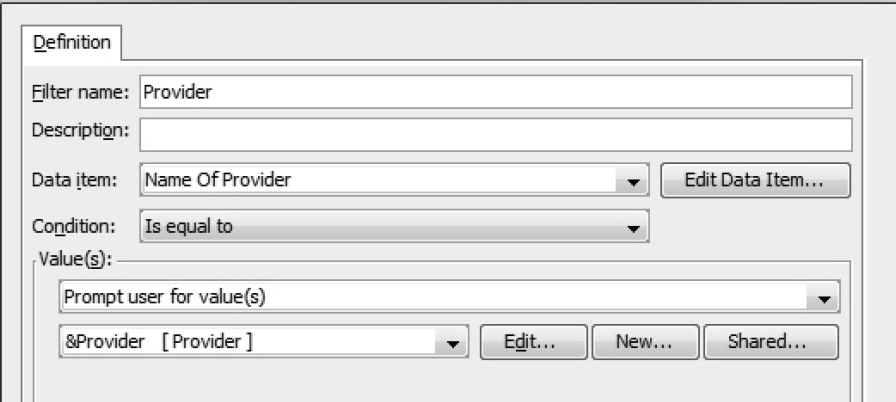
Name Of Provider Prompted Filter
1. Repeat steps 1 through 3 for Name of Provider.
2. On the Prompt Type and Values tab, enter the following information as shown in Figure 5.19.
a. Prompt type: Select Text. Name Of Provider is a character field.
b. Method for populating prompt: Select User selects values from a static list. A static list is generally faster than a dynamic list and is a good candidate when the values do not change frequently.
c. Number of values: Select Multiple values.
d. Select the All possible values check box. This is a timesaver for the user.
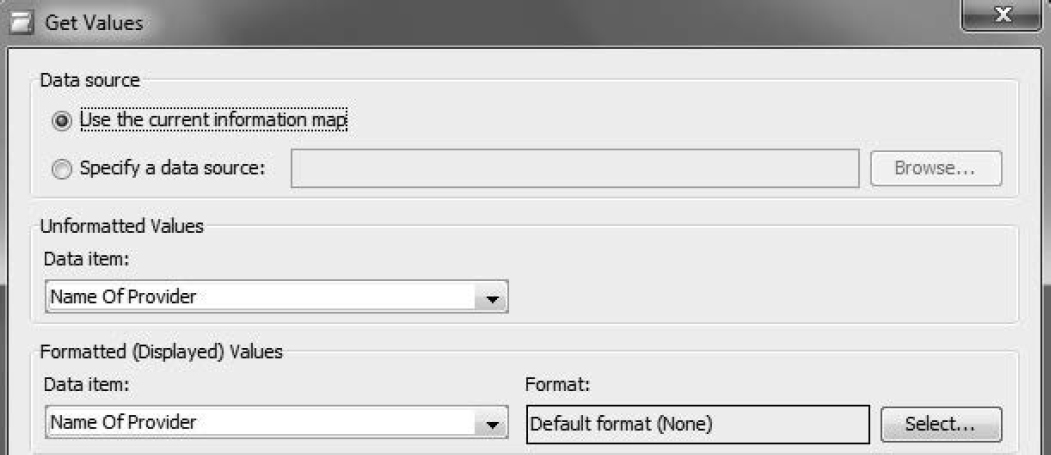
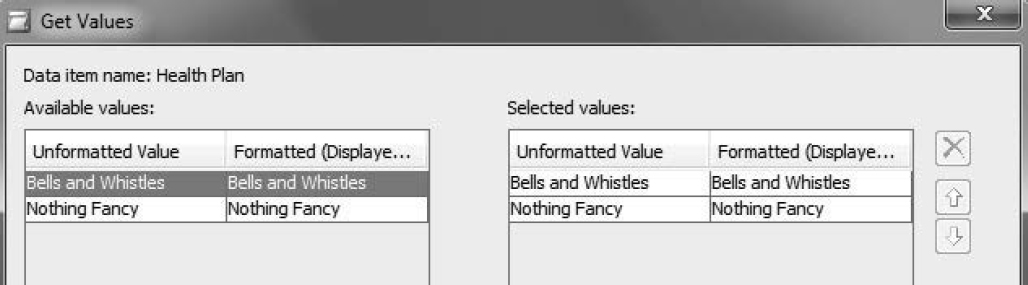
e. Click Get Values to create a list of values.
Figure 5:19: Create a Prompted Filter

f. In the Get Values dialog box, select Use the current information map for Data source. Select Name Of Provider for Data item. This information is shown in Figure 5.20.
Figure 5.20: Populate a Static List in a Prompted Filter
3. The filter for Provider and its prompt are connected.
Figure 5.21: Provider Prompted Filter
5.3.7 Revisiting Data Item Properties
A data item can be used for filtering either within an information map or further downstream in an application such as SAS Web Report Studio. For filtering to perform accurately, a key data item property called the Value-Generation Method needs to be set up correctly.
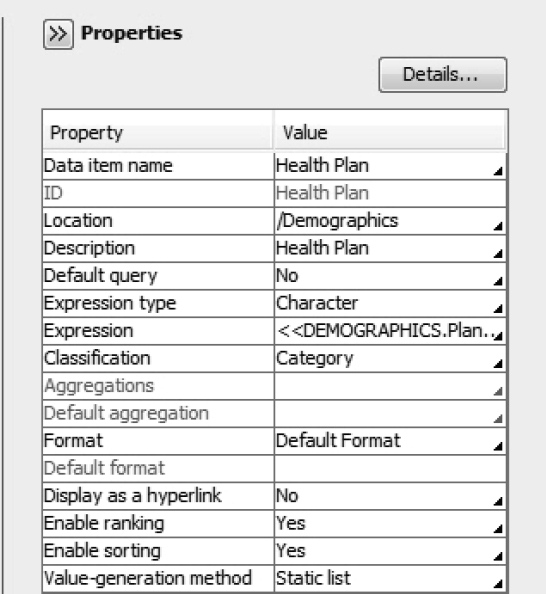
This section shows how the properties of Health Plan can be modified so that it can be filtered in a downstream application.
1. In the Data Item Properties window, click the Value-Generation Method tab. There are three options for the value-generation method as shown in Figure 5.22.
Figure 5.22: Create a List of Values for a Data Item in SAS Information Map Studio

a. The default value is User enters values (no list of values is provided). This option does not allow the user to select from a list of values when filtering in SAS Web Report Studio.
b. User selects values from a dynamic list creates a dynamic list for filtering.
c. Select User selects values from a static list (defined below). This allows users to create a list in the map. A key disadvantage of a static list is that it is not updated automatically with data updates.
d. Click Get Values to retrieve the value of Health Plan as shown in Figure 5.23.
Figure 5.23: Static List Containing Values of Health Plan
e. Verify in the Properties pane that the Value-generation method for Health Plan is Static list.
Figure 5.24: View Data Item Properties in SAS Information Map Studio
2. Repeat step 1 to modify the value-generation method for Type of Encounter. Set this property to Static list.
5.3.8 Features of the Hot Spotters Information Map
The Hot Spotters map created thus far has the following data management features:
1. It combines data from various tables in the data warehouse in complex ways.
2. It organizes data in folders so that the data makes business sense.
3. It computes new data items.
4. It renames data items so that the names work with analytics.
5. It retrieves only paid claims from the data warehouse. This is performed using a prefilter. Analysts or applications using the Hot Spotters map can make sure that only paid claims are included.
6. It enables you to decide what data to retrieve using prompted filters.
5.4 Maintaining and Updating an Information Map
An information map might need to be updated because its underlying data, including libraries, tables, and columns, might change. SAS Information Map Studio is intelligent enough to prompt users when data sources need updating.
New columns from a source table can be added to the information map in the Selected Resources pane of SAS Information Map Studio.
To update a map, select Tools → Resource Replacement.
The Resource Replacement dialog box contains the following tabs:
1. Application Server
2. Libraries
3. Tables
4. Columns
Each tab enables you to select a replacement value.
1. To change the source of the information map to another table, uncheck the Display only unresolved resources check box on the Tables tab.
2. Select another table under Replacement Table as shown in Figure 5.25.
Figure 5.25: Replace Tables in an Information Map

5.5 Creating an Information Map with Prompted Linked Filters
Health-care insurance companies group their claims data in various ways. The clustering of claims supports both financial and clinical analysis. It makes it ideal to apply a filter with two or more linked prompts. A prompted linked filter involves the following three variables:
1. The first variable groups claims by who billed them. These include, but are not limited to, hospital inpatient, hospital outpatient, specialist physician, primary care physician, nursing home, and pharmacy.
2. The second variable groups claims by where the encounter took place. Consider an ER visit culminating in an inpatient stay. The corresponding ER claim is categorized as inpatient in the first variable and ER in the second variable. Similarly, primary care can be performed in a variety of settings, although the doctor’s office is the most common. If a primary care visit takes place in a nursing home, then the corresponding ER claim is categorized as primary care in the first variable and nursing home in the second variable.
3. The third variable groups claims by the diagnoses resulting from the medical encounter. These diagnoses are usually DRG codes for inpatient encounters and ICD-9 codes for all others.
A prompted linked filter for the first and second variables is useful to clinicians because it aids them in viewing parts of the patient or population medical experience. The vast number of codes in the third variable makes it a less desirable candidate for inclusion in the filter.
This section builds a filter with two linked prompts. Because the test data does not have detailed claim categorization, a dependency between Name of Provider and Health Plan is created. This enables you to first select a value for Health Plan. Depending on your selection for Health Plan, you select a value from a limited set of values for Name of Provider.
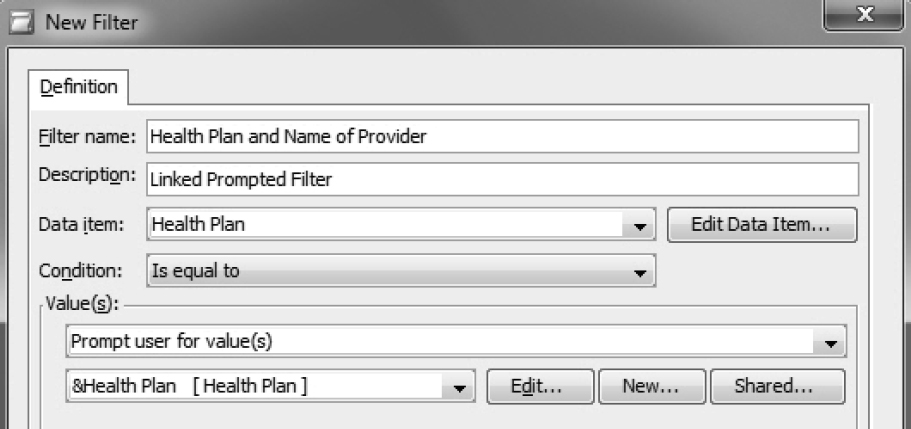
1. Create a new filter to store Health Plan and Name of Provider filters and prompts.
a. Enter a filter name. Select a name indicative of the dual nature of the filter.
b. Create a filter and prompt for Health Plan and Name of Provider as shown in Figure 5.26.
Figure 5.26: Build a Dual Filter
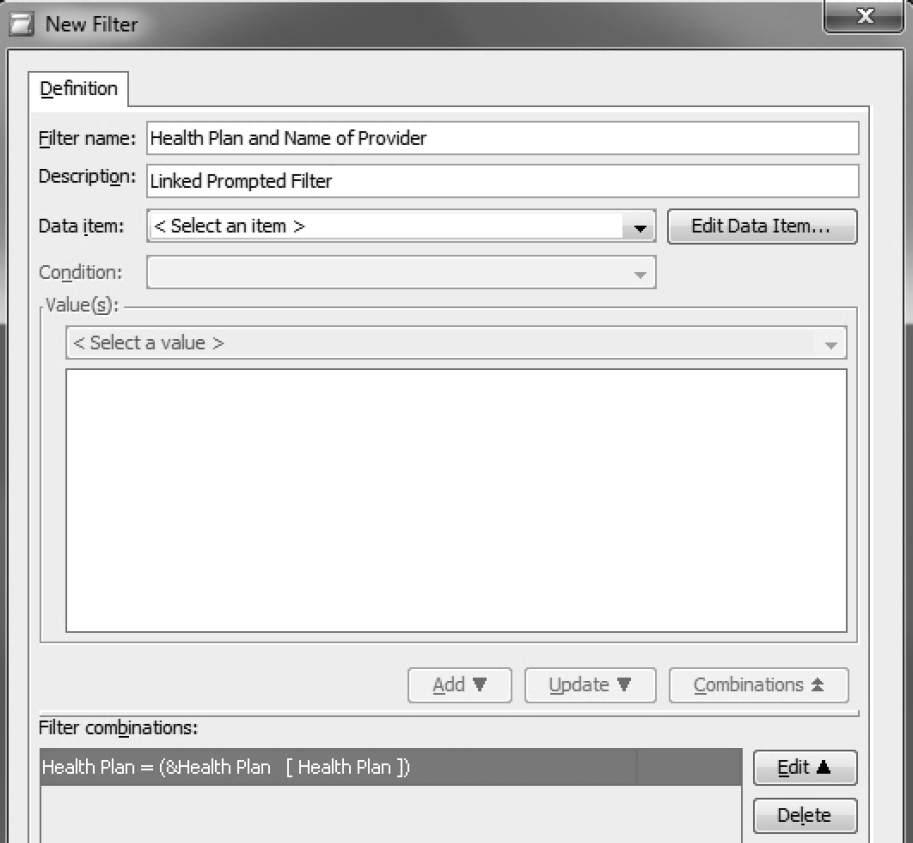
c. Click Add to add the Health Plan and Name of Provider filter to the Filter combinations pane. This is shown in Figure 5.27.
Figure 5.27: Create Prompted Filter Combinations
2. Create a filter and prompt for Name of Provider.
a. On the Prompt Type and Values tab, select User selects values from a dynamic list for Method for populating prompt. This is crucial because the list of values for Name of Provider depends on the choice for Health Plan. This is shown in Figure 5.28.
Figure 5.28: Populate Second Prompted Filter in Dual Filter

b. Add Name of Provider to the Filter combinations pane.
c. Select Establish dependencies between prompts as shown in Figure 5.29.
Figure 5.29: Create Dependent Prompted Filters

3. Test the filter to see whether you receive the prompt as shown in Figure 5.30.
Figure 5.30: Linked Prompted Filters

The only drawback to a filter containing two or more linked prompts is that it tends to be slow at run time. To balance speed with the need for linked prompts, data items containing only a handful of values should be used. For example, health-care diagnosis codes, which are numerous, should be avoided.
5.6 Conclusion
In this chapter, you learned that an information map bridges the distance between the data warehouse and web applications. It hides the complexities of the data warehouse, and it makes data accessible to web applications and users. The information map that you created is the primary source for the web applications in the next chapter.
In this chapter, the focus was primarily on the data management capabilities of information maps. In Chapter 7, you will take information maps to a higher level by loading them with data security and dynamic data updating features.