
Chapter 1: An Overview of SAS Business Intelligence
1.2 Features of the US Health-Care Industry
1.2.1 Public Insurance Programs
1.4 SAS BI Solutions for the Health-Care Industry
1.5 Conceptual Architecture of SAS BI Platform
1.6 Physical Architecture of the SAS BI Platform
1.8 Seamless Integration between SAS BI Tools
1.9 SAS Metadata: The Glue That Holds It All Together
1.10 Features of the SAS BI Platform
1.11 Description of SAS BI Applications
1.1 Introduction
Information technology has created vast efficiencies in many industries, but has not yet fulfilled its promise in health care. The health-care industry collects data mostly for operational purposes. The data needs to be organized in a transparent and integrated way so that it can yield knowledge and aid in strategy.
SAS Business Intelligence (BI) tools convert data into knowledge and value. This book demonstrates that SAS BI solutions can be applied successfully in the health-care industry. In this book, actual health-care applications are created and can be lifted straight from the book and put to effective use immediately. All applications use sample data that is easy to create and has the richness of operational data.
This chapter provides an overview of SAS BI technology. It describes sample data used in the book and previews SAS BI solutions described in the rest of the book. First, some contextual background about the US health-care industry is provided.
1.2 Features of the US Health-Care Industry
Every market consists of buyers and sellers. Buyers buy products and services from sellers at prices determined by the forces of supply and demand. The health-care market differs from most markets in that it splits buyers into two distinct entities: consumers and payers. Consumers consume health care, but generally do not pay directly for these services. Payers pay for health care and are central to any discussion of the market.
The United States does not have a single system of health insurance. An individual might receive private or public health insurance or both. An individual might not be insured at all. Of the US population, 84% currently has some form of insurance, and the remaining 16% has no insurance.
The private health insurance marketplace is rife with companies of varying structures. A discussion about these companies is not within the scope of this book. Let’s focus instead on the insurance paid for by the government because it often plays the role of market leader in the industry.
1.2.1 Public Insurance Programs
There are currently two main public insurance programs, Medicare and Medicaid. Medicare is wholly financed by the federal government. Medicaid is jointly financed by the federal government and individual state governments.
Medicare is a national health insurance program for the elderly and disabled. The federal government pays the health expenditures of 37 million elderly Americans. Including the disabled, non-elderly population, Medicare provides coverage to about 14% of the US population and is the single largest insurer.
Medicare is so dominant in the US health-care system, that few providers and no insurance companies can ignore it. Medicare payments are either made directly to providers or indirectly to insurance companies. Medicare payment and condition-classification methodologies are industry standards that are used by providers, insurance companies, and state governments. Hospitals leverage Medicare methodologies with their non-Medicare business models. State governments routinely implement Medicare methodologies for their Medicaid programs.
Medicare’s payment methodologies are widely considered industry standards, and they can be categorized by type of health service.
Inpatient and Outpatient Hospital: Medicare pays for hospital services on a prospective or predetermined basis. Its inpatient payment system is based on the diagnosis-related groups (DRGs) developed by Yale University. DRGs classify all possible diagnostic and procedural codes from the International Classification of Diseases, Ninth Revision (ICD-9) into meaningful groupings. Medicare plans to implement ICD-10, which primarily differs from its previous version in code specificity and volume. ICD-10 has 155,000 codes as opposed to the current 17,000.
Medicare’s outpatient payment system is similar to its inpatient prospective methodology. Outpatient services are classified under groups called Ambulatory Payment Classifications (APCs).
Physician: Medicare uses a resource-based relative value scale (RBRVS) to reimburse physicians. Each service is given relative value units (RVUs). The physician’s fee is calculated by multiplying the RVUs by a conversion factor and adjusting for geographical cost variations.
Medicaid provides coverage for certain economically disadvantaged groups, such as mothers with low income and their children. Because Medicare’s coverage of nursing homes is limited, Medicaid finances nursing home expenses for the elderly who are poor enough to qualify for Medicaid during long nursing home stays. Medicaid is jointly financed by the federal government and state governments, and is administered by each state. Program design, including coverage and enrollment, differ by each state.
The Medicare and Medicaid programs play a dominant role in the US health insurance market. As Table 1.1 shows, the government pays for a large share of total health insurance expenditures. Almost 50% of total health insurance funds in 2010 originated from the government.
Table 1.1: Health-Care Insurance Expenditures (In Billions)
| Source of Funds | 2008 | 2009 | 2010 | % in 2010 |
|---|---|---|---|---|
| Private Health Insurance | 807.6 | 828.8 | 848.7 | 45% |
| Government | 810.7 | 874.2 | 926.0 | 49% |
| Medicare | 466.9 | 499.8 | 524.6 | |
| Medicaid | 343.8 | 374.4 | 401.4 | |
| Other | 82.4 | 90.3 | 96.1 | |
| Total | 1700.7 | 1793.3 | 1870.8 |
Source: Office of the Actuary, National Health Statistics Group, Centers for Medicare & Medicaid Services
1.2.2 HIPAA Privacy Rule
The health-care industry is bound by legislation to treat sensitive patient data in a confidential manner. The privacy rule of the Health Insurance Portability and Accountability Act (HIPAA) lays out strict guidelines on the use and disclosure of protected health information (PHI). To protect patient identifying information, HIPAA imposes restrictions on data access and sharing. Companies that violate HIPAA are subject to stiff penalties. The restrictions deeply impact the health-care industry’s IT structure and work processes on an operational and strategic level.
1.3 Data Used in This Book
This book uses a fictitious insurance company, Healthy Living Inc., to simulate applications of SAS BI solutions. The company insures members eligible for Medicare. As a result, it receives its revenue entirely from the federal government, specifically Centers for Medicare and Medicaid Services (CMS). HIPAA compliance impacts the company’s IT structure and business processes.
1.3.1 Healthy Living Inc.’s Data Model
Healthy Living Inc.’s primary business is to pay claims to providers for members enrolled in its health plans. Its data is modeled around a transactional or fact table called Encounter. The table represents health-care utilization and costs. Each encounter is denoted by a unique identifier, ClaimID. For the sake of simplicity, encounters are limited to two types, Emergency Room (ER) visits and hospital admissions. ER visits have an associated date of service and an ICD-9 code. Hospital admissions have associated admit and discharge dates and a DRG code. Hospital admissions also have associated ICD-9 codes, but DRG codes are used for most clinical and reporting purposes. Table 1.2 describes the information contained in the Encounter table.
Table 1.2: Variables in Encounter
| Column Name | Column Description |
|---|---|
| ClaimID | Unique identifier for patient encounter. |
| MemberID | Identifier for member. |
| ProviderID | Identifier for hospital. |
| ClaimRepID | Identifier for claims representative. |
| Category | Type of patient encounter: inpatient or ER. |
| Status | Paid or denied. |
| DRG | Diagnosis-related group assigned at discharge. Relates to inpatient admissions only. |
| ICD | Diagnostic code. |
| AmtCharge | Amount charged by provider. |
| AmtPaid | Amount paid by insurance. |
| DOS | Date of service for ER visit. Date of admission for hospital admission. |
| AdmitDt | Date of hospital admission. |
| DischargeDt | Date of inpatient discharge. |
| YearMonthDOS | Year and month of service. |
| YearDOS | Year of date of service. |
| MonthDOS | Month of date of service. |
| PaidDt | Date claim was paid. |
| YearMonthPaidDt | Year and month of paid date. |
| AdmitDt | Date of admission for hospital admission. |
| DischargeDt | Date of discharge for hospital admission. |
| LOS | Length of stay in days for hospital admissions. |
Other tables in Healthy Living Inc.’s data mart are dimensional and lookup tables. These tables combine with Encounter to add different perspectives to encounters. The data model in Figure 1.1 shows the structure of the company’s data mart and join relationships within its tables.
Figure 1.1: Data Model
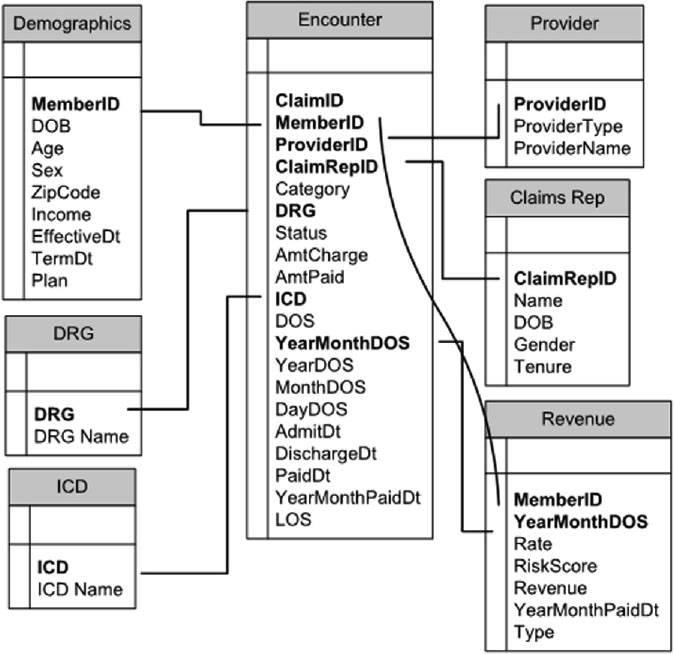
Although most tables are self-explanatory, Revenue merits further discussion. It contains monthly payments by CMS. Payments depend largely on the member’s risk score, which measures how sick a member is. The risk score is based on a composite of the member’s demographic information and current diagnoses. A higher risk score denotes a sicker member and leads to higher payments. Moreover, a risk score is adjusted periodically based on medical encounter data provided by Healthy Living Inc. to CMS. This means that payments are adjusted periodically, and CMS might make both negative and positive payments, retroactively.
Revenue can be joined with Encounter only after data is summarized in both tables. The data aggregation code is displayed in the following PROC SQL:
Program 1.1: Aggregating Data in Revenue and Encounter
proc sql;
create table RevenueSummary as
select MemberId, YearMonthDOS, sum(Revenue) as Revenue
from Revenue
group by MemberID, YearMonthDOS;
create table EncounterSummary as
select MemberID, YearMonthDOS, sum(AmtPaid) as AmtPaid
from Encounter
group by MemberID, YearMonthDOS;
quit;
Once Revenue and Encounter are summarized, they can be joined using MemberID and YearMonthDOS.
Healthy Living Inc.’s data mart is created entirely using SAS code, which can be downloaded from the author’s website.
1.4 SAS BI Solutions for the Health-Care Industry
SAS BI solutions created in this book include the following:
1. Business analysts at Healthy Living Inc. rely on their IT department for their data and analytical needs. They are frustrated because IT fulfillment does not match their speed. The analysts would prefer to retrieve and analyze their data themselves. They cannot because they do not know how to access and navigate the company’s data warehouse. SAS BI tools can remove these technical roadblocks and empower analysts to help themselves.
2. The physicians and nurses at Healthy Living Inc. do not devote as much time to patient care as they would like because of a lack of integrated data system and automated reporting. Before a patient consult, a nurse has to compile medical history and a patient profile from many different electronic systems and even paper records. The nurse would like to identify populations of patients with greater needs so that she can pay more attention to them. She cannot because the data has not been compiled. With SAS BI solutions, the nurse generates comprehensive patient and population profiles at a moment’s notice.
3. The executives want to know the state of Healthy Living Inc. Currently, they piece together its vital statistics from various departments. They receive numbers on revenue, costs, and profits from the Finance department. Reports on the clinical conditions of the company’s enrollees come from the Medical Management department. The Enrollment department supplies the executives with data on membership. The executives are frustrated because the information from various departments often has discrepancies. They want an application that enables them to gather overall information quickly and to drill into detailed data. SAS BI provides executives with a dashboard, fulfilling their data and analytical needs.
4. The database administrators at Healthy Living Inc. help the company comply with HIPAA regulations. They restrict access to sensitive tables in the company’s data warehouse. This approach is not adequate. An employee often has to manually blackout sensitive information to share a report with others. SAS BI technology has several methods for restricting data access intelligently. It removes the need for archaic and time-consuming methods for protecting sensitive patient data.
1.5 Conceptual Architecture of SAS BI Platform
The SAS BI Platform consists of a suite of products or applications that fall under two broad categories. The categories are Internet and client-based applications. An Internet application is accessed from a web browser. A client application is installed on the user’s computer. An Internet application enables users to share and access data without limits. As long as the user has an Internet connection, she can access her application.
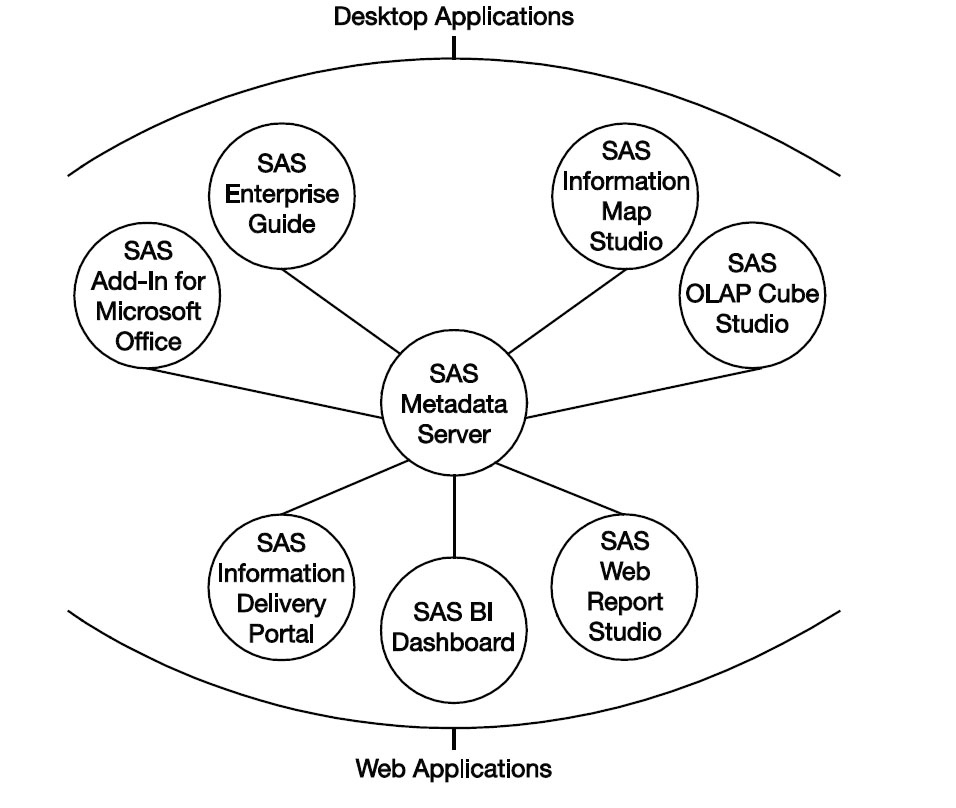
All SAS BI applications are controlled by and connected to the SAS Metadata Server, the brains of the entire SAS BI Platform. As a result, the applications integrate seamlessly with each other. SAS stored processes can be accessed through or used within all applications. An information map, a product of SAS Information Map Studio, might be used by a number of SAS BI applications. Figure 1.2 shows the conceptual architecture of the SAS BI Platform.
Note that SAS stored process technology is not shown in Figure 1.2 because it is not considered an application. A SAS stored process is primarily SAS code.
Figure 1.2: Conceptual Architecture of the SAS BI Platform (Select Applications Shown)
1.6 Physical Architecture of the SAS BI Platform
The physical architecture of the SAS BI Platform or how it is installed varies greatly by company needs and size. A large company with many BI users needs to devote more hardware resources than a small company with a handful of BI users. However, most BI installations are marked by the presence of three servers. A server is a computer or a program installed on a computer to process services.
The three servers present in most installations of SAS BI are the SAS Metadata Server, the SAS Application Server, and the SAS Web Server.
A small company might choose to install all three of the servers on one physical machine, creating a virtual installation. The servers share the resources of the single computer. Other applications besides SAS can be installed on this single computer.
Figure 1.3: SAS BI Installation for a Small Company

The presence of three servers in the SAS BI Platform does not restrict a larger company from using more hardware resources. The three servers can be spread out on more than three computers or machines. A large company might decide to place the SAS Application Server on several machines. The SAS Application Server ensures that larger jobs are completed in a timely manner by distributing the jobs across multiple machines.
The SAS BI Platform has three servers because each has a distinct function. The SAS Metadata Server processes the services of SAS metadata and is the controlling brain of the SAS BI Platform. The server is discussed in greater detail in section 9.
The SAS Application Server is the workhorse of the SAS BI Platform because it processes all user requests. A SAS programmer runs some code from SAS Enterprise Guide. An analyst clicks to view a report online. The SAS Application Server makes both of these requests happen.
The third server is the SAS Web Server. As its name implies, the SAS Web Server ensures that SAS Internet-based applications run appropriately on the Internet.
1.7 Types of SAS BI Tools
SAS BI applications have two main classifications. The following table groups applications appropriately. SAS stored process technology is not shown in the table because it integrates well with both classifications of applications.
Table 1.3: Types of SAS BI Applications
| SAS BI Application | Internet | Client or Type |
|---|---|---|
| SAS Enterprise Guide | Windows | |
| SAS Add-In For Microsoft Office | Windows | |
| SAS Information Map Studio | Java | |
| SAS OLAP Cube Studio | Java | |
| SAS Management Console | Java | |
| SAS Web Report Studio | X | |
| SAS Dashboard | X | |
| SAS Information Delivery Portal | X |
Although differences between Java and Windows applications are beyond the scope of this book, the two types of client applications are distinguished by one small, but important difference. They use different connection profiles. Connection information for Windows applications is located in a file with an extension of .xml. A file with an extension of .swa contains connection information for Java applications. Both connection profiles are saved, by default, in the user’s home directory in the following location: Applications DataSAS MetadataServerProfiles.
The SAS administrator might choose to allow BI users to save their user names and passwords on their local computers. If so, the BI user does not need to supply his user name and password at login. The only exception is the first login, where he is prompted to create a connection profile.
1.8 Seamless Integration between SAS BI Tools
Have you ever observed a child playing with wooden blocks? You can think of SAS BI tools as variously shaped wooden blocks. Put the tools together in different ways to create various applications.
The following designs are featured in the book.
Figure 1.4 shows how a set of SAS Web Report Studio reports can be linked together to form a drill-down application. A single information map sources all three reports. A user begins by viewing aggregate information. She then looks at information about a patient cohort of interest. Finally, she selects an individual to view his detailed information.
Figure 1.4: Drill-Down SAS Web Report Studio Application
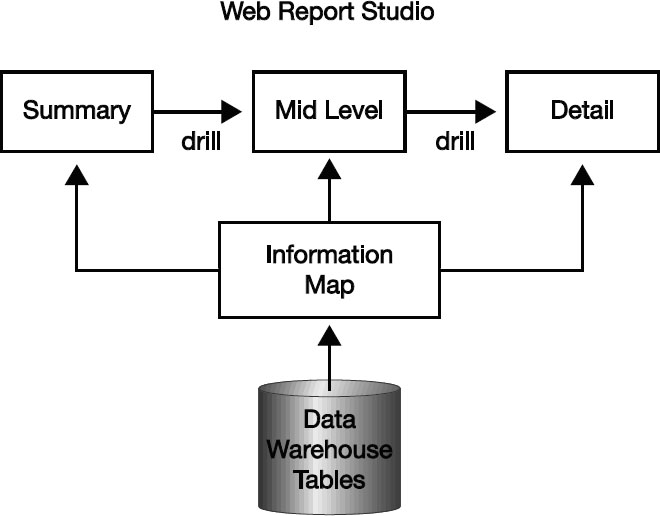
Figure 1.5 shows how SAS Web Report Studio can be used to push out reports via e-mail to various users. The report is sourced from a SAS stored process. Users receive their reports via e-mail at regularly scheduled intervals. This solution hides all technical complexity from its users.
Figure 1.5: Reports Delivered via E-mail
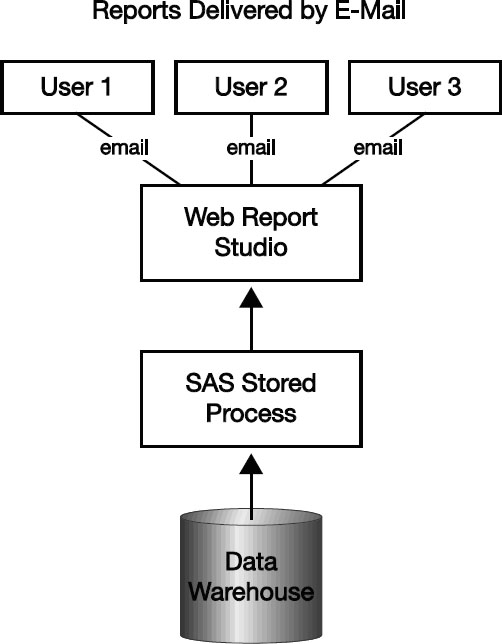
Figure 1.6 shows the combined power of SAS stored processes and SAS Information Map Studio to create an up-to-date SAS Web Report Studio application. A SAS stored process is embedded in the information map, enabling it to retrieve the most recent data.
Figure 1.6: Drill-Down SAS Web Report Studio Application with Dynamic Data Updating
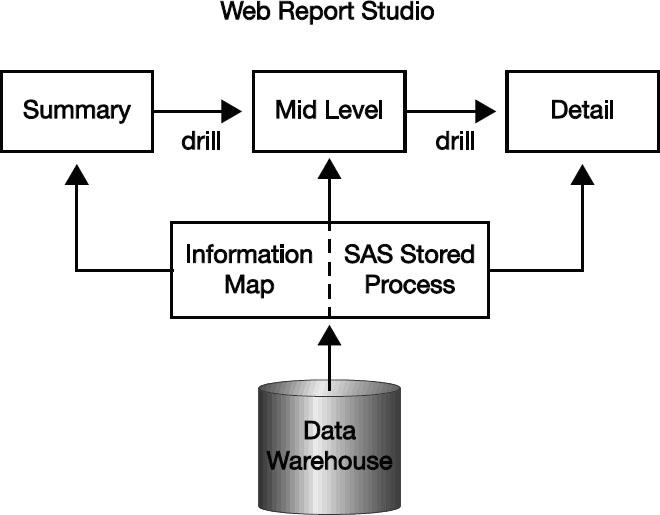
Figure 1.7 shows an OLAP-based SAS Web Report Studio application. The user slices and dices through variables to analyze key metrics. Computations might be added both in the OLAP information map and the OLAP cube, which are refreshed periodically from the data warehouse.
Figure 1.7: Slice and Dice Web Reports through SAS Web Report Studio
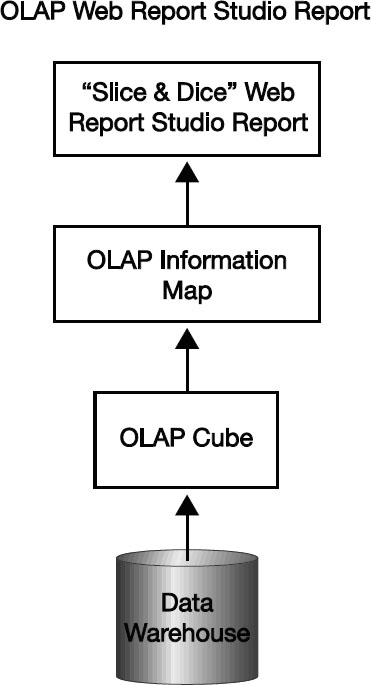
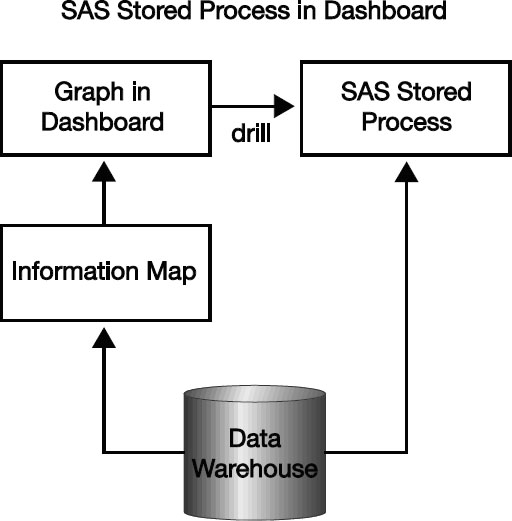
Figure 1.8 shows how an information map can be used as a source for a graph in the SAS BI Dashboard. The user has the ability to click on the graph and see detailed results.
Figure 1.8: Executive Dashboard: Design of Revenue and Costs Graph with a Drill-Through to Details
1.9 SAS Metadata: The Glue That Holds It All Together
Metadata is data about data. Consider the following table:
Table 1.4: A Page of Data
| Name | Age | Score |
|---|---|---|
| Amy Smith | 49 | 99 |
| Arnold Rogers | 55 | 87 |
There are two observations and three columns. The columns Age and Score contain numeric data. The column Name contains character or text data. The data is sorted by descending values in the Score column.
The description about data is formally called metadata. Metadata for a SAS data set might be reported by the CONTENTS procedure.
The SAS Metadata Server is the central repository for all metadata pertinent to the SAS BI Platform.
SAS metadata has metadata about various data tables. The tables might be SAS data sets. The tables might be from databases such as Oracle or SQL Server. SAS metadata contains information about tables from SAS and tables not from SAS, and the SAS Metadata Server stores information about how to connect to various databases.
Information about how the SAS BI Platform is configured is also contained in SAS metadata. For example, a small company with a handful of BI users is likely to have a different configuration than a large company with numerous BI users. SAS administrators might choose to change the configuration so that it better meets their company’s needs. For example, web performance might be optimized by changing the configuration of the SAS BI Platform. All configuration information is stored in SAS metadata. SAS metadata also contains information about the location of various parts of the SAS BI Platform.
Who uses the SAS BI Platform? Depending on site configuration, users can be report writers, application developers, SAS administrators, and dashboard and report viewers. BI users can be segmented into functional groups such as IS, Finance, and Provider Services. SAS metadata is the guardian of all knowledge about users and their groups.
What data can the users of the SAS BI Platform see and not see? A manager in the Finance department views her own department’s reports but cannot see the reports of other departments. An HR manager sees the salaries of all employees, but an employee views only her own salary. SAS metadata is the holder of all security information, including the myriad ways in which data access can be restricted.
SAS metadata is the custodian of all BI content, which is the product of any BI application.
1.10 Features of the SAS BI Platform
The SAS BI Platform has characteristics that make it easy to learn. Its tools share a common look and feel. SAS OLAP Cube Studio looks very much like SAS Information Map Studio. Likewise, SAS Information Delivery Portal and the SAS BI Dashboard are very similar.
SAS BI tools are intuitive and accessible. SAS Web Report Studio can be learned quickly. SAS Add-In for Microsoft Office has no learning curve if you know Excel or Word–you can easily create SAS reports and submit data queries from SAS. SAS OLAP Cube Studio and SAS Information Map Studio provide a point-and-click interface. Both applications generate SAS procedural code so that SAS developers (which is their primary audience) have little trouble with them.
Role-Based Applications
SAS BI tools are easy to use because they are adopted to fit their users’ technical abilities. Several of them are role-based–their front-end interface and capabilities vary depending on the user’s job. SAS Web Report Studio, SAS Management Console, SAS Add-In for Microsoft Office, and SAS Enterprise Guide are all role-based applications.
The role-based features of SAS BI tools merit further highlighting with two examples–SAS Web Report Studio, an Internet-based reporting application, and SAS Management Console, a client-based application for administering the SAS BI Platform.
SAS Web Report Studio molds itself around the jobs of its users. Figure 1.9 shows a manager, a business analyst, and a report developer on a technical spectrum. The manager receives the simplest flavor of SAS Web Report Studio, whereas the report developer experiences the application’s full functionality.
Figure 1.9: SAS Web Report Studio: A Role-Based Application

SAS Management Console is highly adoptable because it carves out administrative duties by specific areas. For example, an administrator who is in charge of adding users and managing their access receives the user-related module of SAS Management Console. Another administrator uses its data management module, which enables him to maintain data and library connections. Although the learning curve for administering all aspects of the SAS BI Platform is steep, specific administrative functions can be learned quickly.
User-Prompting Framework
A user-prompting framework is applicable in most SAS BI tools. This framework enables information maps, stored processes, and reports to run conditionally by filters created by the user. The framework is consistent throughout all applications. The user has the flexibility to enter numeric, character, or date values. The user might choose one or many values from a drop-down list. The filters, themselves, can share dependencies.
The process of creating prompts is similar between SAS Web Report Studio and SAS Information Map Studio. If you learn how to create filters and prompts in one application, it is easy to extend that knowledge to other SAS BI applications. Setting up prompts correctly in SAS stored processes is more complex because it requires knowledge of both SAS programming and macros.
1.11 Description of SAS BI Applications
In this section, individual SAS BI tools in the SAS BI Platform are briefly described. Although cursory, the section is intended to give you a conceptual understanding of SAS BI tools.
SAS Enterprise Guide
SAS Enterprise Guide is a client-based application that is probably the single, most powerful application in the SAS BI Platform. It contains a full host of data management, analytical, and administrative capabilities. SAS Enterprise Guide offers foolproof wizards to guide unfamiliar users with tasks.
The Tasks Menu in SAS Enterprise Guide includes data management, manipulation, statistical analysis, and reporting capabilities. Table 1.5 shows some of its capabilities.
Table 1.5: Selected Capabilities of the Tasks Menu in SAS Enterprise Guide
| Tasks→Data | Tasks→Describe | Tasks→Graph |
|---|---|---|
| Filter and Sort | List Data | Bar Chart |
| Append Table | Summary Statistics | Pie Chart |
| Create Format | Summary Tables | Line Plot |
| Transpose | List Report Wizard | Scatter Plot |
| Random Sample | One-Way Frequencies | Bubble Plot |
| Rank | Table Analysis | Tile Chart |
Although the chief attraction of SAS Enterprise Guide is its point-and-click interface, it enables SAS programmers to carry on business as usual, checking and completing code. SAS programmers have the option of linking various programs together, and then scheduling them.
SAS Enterprise Guide interfaces with most other applications in the SAS BI Platform. The SAS developer might create, test, and invoke SAS stored processes. She might view data from information maps. She might slice and dice her way through OLAP cubes.
SAS Stored Processes
A SAS stored process is SAS code plus instructions. SAS code is created by programmers or by several BI applications such as SAS Enterprise Guide. Instructions stored with the SAS code specify how and where the code should be run. SAS stored processes can be simple or complex. They are saved or registered with SAS metadata.
Stored processes can be divided into two main groups; those with prompts that require users to select or enter information, and those without prompts. Prompted stored processes might have complex prompts with dependencies built into them. Consider a report with two prompts, Gender and Medical Diagnosis. If Medical Diagnosis is dependent on Gender, you see diagnoses pertinent to the selected value of gender. This is useful because it prevents the user from selecting prompt values that lead to empty reports.
Prompts in SAS stored processes are linked to code by macro variables. Therefore, a good working knowledge of macro programming is a prerequisite for creating stored processes with prompts. For example, if a stored process allows the user to choose one, more, or all of the values of a filter, then the macro code should be flexible enough to count the number of values chosen by the user, create the requisite number of macro variables, and insert them appropriately in the code.
Although stored processes can be created by other BI applications or code, SAS Enterprise Guide offers a handy wizard to create, test, and modify them.
Stored processes are primarily used for self-service reporting. Instead of asking a programmer to run a SAS report, the BI user can run a stored process from either Excel or the web and generate the report herself. On-demand reports are the ideal candidates for stored processes because BI users can run them at their convenience. Stored processes enable business users with little or no technical expertise to tap into the power of SAS programming.
SAS Add-In for Microsoft Office
SAS Add-In for Microsoft Office exposes much of the power of SAS to Microsoft Office users. Users might view SAS reports in Outlook, run a stored process in Excel, and insert a pie chart in PowerPoint.
A business user might use SAS Add-In for Microsoft Office to run SAS stored processes. A savvy technical user might want to submit ad hoc queries by opening up data from tables in the data mart. An advanced business user might use statistical, reporting, and graphical capabilities in SAS Add-In for Microsoft Office.
SAS Information Map Studio
SAS Information Map Studio, a client-based application, is used to create, test, and modify information maps.
An information map is a bridge between the data warehouse and reporting. It adds a layer of business intelligence and logic to data from the data warehouse. Using its point-and-click interface, the SAS programmer can join tables, rename variables, and create new variables using SAS functions. She can create prompts and filters and impose security-based restrictions.
A wide variety of SAS BI applications integrate with information maps. Information maps are the primary sources of data for SAS Web Report Studio applications. They might be used as a data source for a SAS dashboard. They might be used directly by the user in SAS Enterprise Guide or SAS Add-In for Microsoft Office.
SAS Information Maps use relational and OLAP data as their data source. An OLAP information map is based on a single cube, rather than multiple tables. Filters and associated prompts can be placed easily in an OLAP information map.
A SAS stored process can also be used as a data source to an information map. By incorporating a stored process within its data sources, an information map is able to update data dynamically.
SAS Web Report Studio
SAS Web Report Studio is a web-based reporting application, enabling the report writer to build complex, multi-section reports with interdependent prompts. As a role-based application, SAS Web Report Studio is both simple and intuitive.
Information maps are the primary data source for SAS Web Report Studio. Filters and their associated prompts from an information map are easily ported to a SAS Web Report Studio report.
SAS Web Report Studio can create reporting applications that enable the user to navigate from summary to detailed data. Various reports, linked by prompts, retrieve data from relational information maps.
SAS Web Report Studio integrates with OLAP information maps to create slice-and-dice reports with full OLAP functionality, such as access to detailed records.
SAS OLAP Cube Studio
SAS OLAP Cube Studio is a point-and-click interface for creating, modifying, and maintaining OLAP cubes. An OLAP cube enables the user to analyze key metrics with respect to multiple groupings of variables. It is a collection of files, some of which are pre-aggregated, that are joined with each other in multidimensional ways.
Suppose a clinician wants to analyze ER utilization. An OLAP cube enables her to slice and dice ER utilization with respect to variable groupings such as geography and time. She might begin with a county-level view of her data, and then drill-down to the street-level information. At the same time, she might analyze utilization by year, and then delve into quarter, month, or even day.
SAS OLAP Cube Studio provides step-by-step directions for building and editing a cube through a wizard. It provides the advanced SAS programmer the option of downloading PROC OLAP code.
SAS BI Dashboard
Suppose you are driving your car and glance over at the fuel gauge. It points to E, which tells you that you need to stop at a gas station, pronto. How long did it take you to read the gauge and convert its information into an effective decision? Not long at all–the process was practically instantaneous.
The sole purpose of a dashboard is to relay information quickly so that the viewer can act upon it. To extend the earlier example, what do you need to build an effective fuel gauge? For starters, you need data on the remaining amount of fuel in the tank. You need a speedometer display to convey that information. Finally, you need some type of evaluation measurement that groups the amount of fuel in the tank into categories–E, F, and somewhere in the middle.
SAS BI Dashboard is a web application that enables users to design and build dashboards and related content. A dashboard built in the application might be viewed in the SAS BI Dashboard or in the SAS Information Delivery Portal.
SAS Information Delivery Portal
The SAS Information Delivery Portal is a web-based, one-stop shopping center for data analytics. Easy to navigate and customize, it integrates most BI content. It displays dashboards built with SAS BI Dashboard, reports built in SAS Web Report Studio, SAS stored processes, and much more.
A key strength of the SAS Information Delivery Portal is that it provides an effortless way to deliver different information to groups within a company. Separate web pages can be set up for groups as diverse as the Medical Management department and Senior Management in a health-care organization. A nurse in Medical Management uses her dashboard while an executive views information pertinent to him.
SAS Management Console
The SAS Metadata Server is the custodian of metadata. It stores information about tables, libraries, users, access permissions, and SAS BI content. SAS Management Console, a point-and-click client application, enables SAS administrators to update and maintain this information. Because administration of the SAS BI Platform is beyond the scope of this book, only a brief overview of the capabilities of SAS Management Console is provided in this section.
The vast majority of administrative functions is performed via SAS Management Console’s various plug-ins. As a role-based application, SAS Management Console’s plug-ins can be carved out by administrative tasks. An administrator who is in charge of adding users and managing their access receives the User Manager plug-in. Another administrator who maintains data and library connections works with the Data Library Manager plug-in. Although the learning curve for administering all aspects of the SAS BI Platform is steep, specific administrative functions can be learned quickly.
1.12 Conclusion
There are several reasons why SAS BI is a good fit for the health-care industry. First, SAS BI tools are easy to learn. Second, the tools are comprehensive. Their breadth enables the implementation of solutions at all levels within the industry. Finally, the SAS BI Platform integrates well with existing infrastructure, promising a rapid adoption of SAS BI technology.