
Chapter 7: Data Security and Dynamic Updates with SAS Information Map Studio
7.2 Data Security in an Information Map
7.2.1 Restricting Access to Claims Data
7.2.2 Restricting Access to Medical Diagnoses
7.4 Scheduling and Distributing a Report in SAS Web Report Studio
7.4.1: Distributing Reports Conditionally
7.1 Introduction
In Chapter 5, you created information maps primarily to manage data. The maps combined tables, subset data, and created new variables and user prompts.
In this chapter, the power of information maps is extended beyond data management and reporting. The first health-care application described in the chapter uses information maps to impose data access restrictions. The second application leverages maps to enable users to receive dynamically updated data.
The primary focus of this chapter is the advanced use of information maps. Because information maps are used to source reporting applications, a discussion of pertinent SAS Web Report Studio features is included. A review of the business context behind the two extensions is explained.
Application 1: The health-care industry is bound by HIPAA legislation to treat sensitive patient data in a confidential manner. Healthy Living Inc. is no exception. HIPAA restrictions deeply impact the company’s work processes. Here are two examples.
An online claims processing system processes and pays the majority of the company’s claims. Claims representatives adjudicate the remainder. In compliance with HIPAA, a claims representative is allowed to view only medical data from claims that he or she has processed or is assigned. To process a claim, he or she manually enters a claims identifier in the online claims processing system. She maintains electronic (or even paper) copies of her current and past work.
Clinicians at the company are careful about sharing their members’ diagnoses. Some conditions, especially those related to mental health and HIV status, are more sensitive than others. To comply with privacy guidelines, a clinician has to print a member’s health profile, and then use Wite-Out to erase certain diagnoses.
SAS programmers in the company’s IT department improve the two work processes by building data security into the information maps. Their solution enables each claims representative to view his or her own claims. It enables clinicians to restrict showing certain member diagnoses.
Application 2: The health-care insurance industry works with claims data. Claims records represent medical encounters that have been processed for billing. They do not include recent medical encounters. This leaves a significant void for analytics. Health insurance companies fill the void partially from hospital census reports, which consist of ER visits and current hospitalizations.
Healthy Living Inc. receives hospital census reports from its contracted hospitals. SAS programmers in the IT department combine the hospital census reports, and then forward relevant information to clinicians. Because of timing issues, they often miss reporting key encounters, causing delays in patient care.
Information maps integrate stored processes to update data dynamically. Using information maps, SAS programmers build web reports that can be run on demand or scheduled at certain times to ensure updated data for clinicians.
7.2 Data Security in an Information Map
In this section, you create information maps that use a user’s identity to restrict access to data.
The user’s identity information is stored in SAS metadata. It contains, but is not limited to, the following data:
• User ID is the same as the Windows logon user ID for the user. This is mandatory data.
• Name is the display name. This is mandatory data.
• A value for user’s group(s) is not required, but is highly recommended.
A sales representative who is part of the North America sales group has an individual user ID and an assigned group of North America Sales. Rather than administer the user individually, the SAS administrator should leverage group membership to simplify user management.
This section uses the user ID of a user to implement data access restrictions.
It is probably a good idea for a company to rely on more than one method of data security. For example, most companies have data security at the database level. This is usually controlled by database administrators. This book focuses on data security imposed on SAS BI applications, such as in information maps and cubes.
7.2.1 Restricting Access to Claims Data
In Chapter 1, in Figure 1.1, the ClaimRep Table has data about Healthy Living Inc.’s claims representatives. The company uses the first name of a claims representative as the user ID in SAS metadata.
Figure 7.1: ClaimRep Table
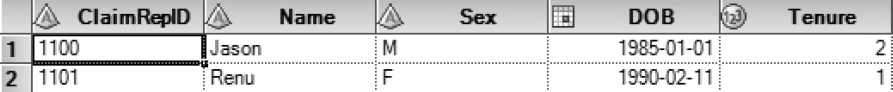
Data access restrictions are implemented in information maps via filters. As a filter subsets data, it is used to ensure that a claims representative only views his or her own records. It compares values of name and user ID, and then excludes rows where the values do not match.
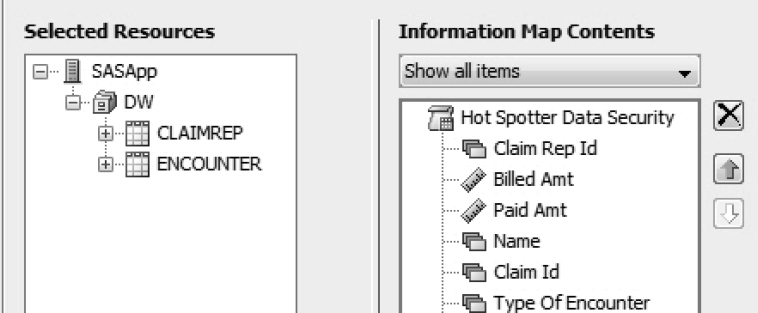
1. Create an information map sourced from ENCOUNTER and CLAIMREP.
a. Select data items as shown in Figure 7.2.
Figure 7.2: Data Items in the Information Map
b. Set the join relationship between ENCOUNTER and CLAIMREP as a many-to-one inner join.
2. Create a filter based on Name as shown in Figure 7.3.
a. Data item: Select Name.
b. Condition: Select Is equal to.
c. Value(s): Select Derive identity values (for row-level permissions). This implements data security based on Name.
d. Property: Click SAS.PersonName. This is the user ID. The idea behind a security-based filter is to compare name to user ID and exclude unmatched rows.
e. Select the Hide from user check box. This ensures that the filter cannot be seen or removed by users.
Figure 7.3: Create a Security-Based Filter

Consider a company where data access is determined by membership in a group. For example, sales representatives might be grouped by the various health plans they sell. The Medicare team sees its own enrollments, whereas the commercial plan team views its membership. In this scenario, the security filter is based on group identity, not individual identity. A security filter compares SAS.IdentityGroupName to a field in the data warehouse table containing group data.
3. Apply the filter to all queries from the map. See section 5.3.6, “Creating Filters,” for more information.
a. Add the filter to the properties of the map.
b. Add ClaimRep as a required table in the map.
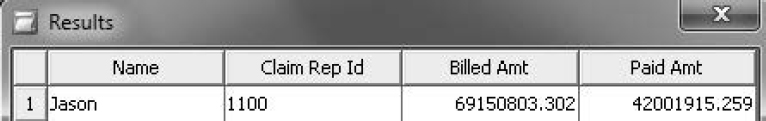
4. Test the filter for a claims representative named Jason.
a. Log on with Jason’s credentials.
b. Click View SQL in the Test the Information Map dialog box to display the View Query dialog box. Verify that the filter is applied. The code includes a WHERE clause restricting Name to Jason.
Figure 7.4: View SQL to Verify Security-Based Filter

c. Confirm the results.
Figure 7.5: Results from a Security-Based Filter
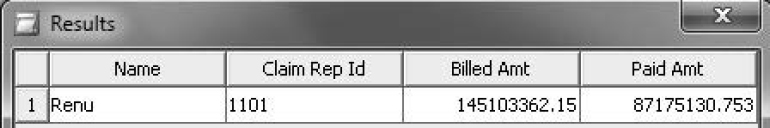
5. Test the filter for a claims representative named Renu by repeating step 4.
Figure 7.6: Results from a Security-Based Filter
6. Create a SAS Web Report Studio report based on the map. A security-based filter is automatically applied. No further work is needed to ensure that claims representatives see only their own records.
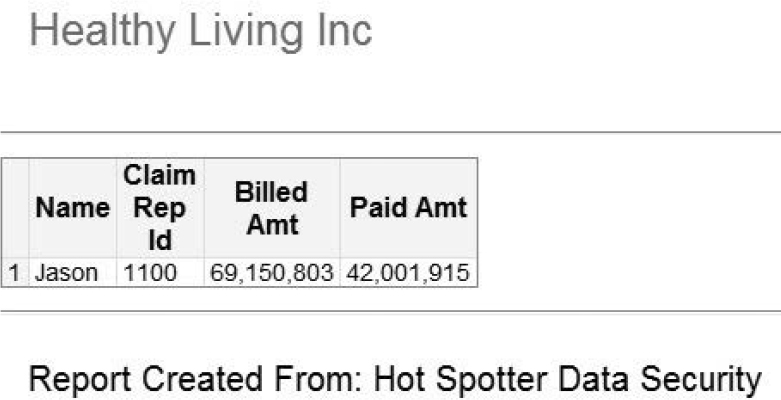
a. Log on as Jason to view his report.
Figure 7.7: Claims Processed by Claims Representative Jason
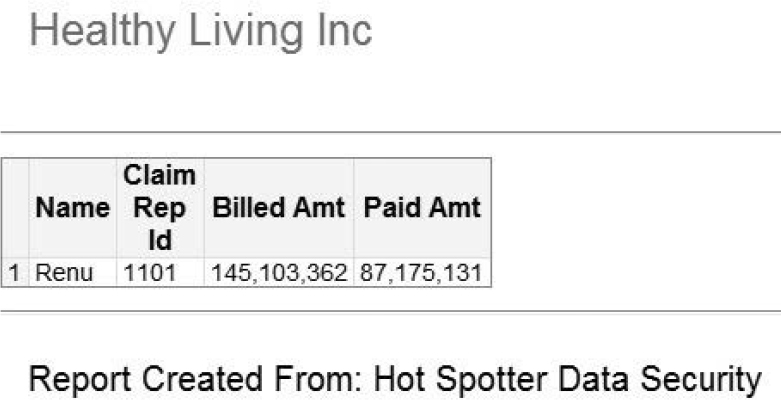
b. Log on as Renu to view her report.
Figure 7.8: Claims Processed by Claims Representative Renu
7.2.2 Restricting Access to Medical Diagnoses
Security-based filters are useful in a variety of circumstances. In this section, you apply a filter to restrict access to medical conditions.
Claims representatives, Jason and Renu, are now the company’s clinicians. They have different data access restrictions. Whereas Renu is allowed to view all medical conditions, Jason is not permitted to view DRG code 885 or Psychosis.
1. Construct a table that specifies what data a clinician can see. The table is a unique combination of DRG codes and a clinician’s name. Renu appears in three rows because she is allowed to view all three DRG codes. Jason appears in two rows because he cannot view DRG code 885.
Program 7.1: DRG Codes Seen and Unseen
* DRG-Related Data Access Restrictions for Clinicians;
data DW.Clinician;
infile cards dsd;
length DRG $3 ClinicianID $25 ClinicianName $25;
input DRG $ ClinicianID $ ClinicianName;
cards;
291,1100,Jason
682,1100,Jason
291,1101,Renu
682,1101,Renu
885,1101,Renu
;
run;
The case study of two clinicians at Healthy Living Inc. with different privileges to see medial conditions is somewhat forced. However, it is not at all uncommon in the health-care industry for clinicians to go to great lengths to hide patient conditions from other clinicians outside of their organization to comply with HIPAA. Clinicians use Wite-Out, paste blank paper over relevant parts of a health services report, or use some other time-consuming measure to hide a patient’s conditions. A method based on business intelligence of restricting data access is even more pertinent as efforts intensify to share data with multiple providers.
2. Source an information map from three data tables, Encounter, DRG, and Clinician.
3. Create a filter based on Clinicianname as shown in Figure 7.9.
a. Data item: Select Clinicianname.
b. Condition: Select Is equal to.
c. Value(s): Select Derive identity values (for row-level permissions). This implements data security based on Clinicianname.
d. Property: Click SAS.PersonName. This is the user ID. The idea behind a security-based filter is to compare Clinicianname to user ID and exclude unmatched rows.
e. Select the Hide from user check box. This ensures that the filter cannot be seen or removed by users.
Figure 7.9: Create a Security-Based Filter

4. Apply the filter to all queries from the map. See section 5.3.6, “Creating Filters,” for more information.
a. Add the filter to the properties of the map.
b. Add Clinician as a required table in the map.
5. Create a DRGs by Clinician report in SAS Web Report Studio.
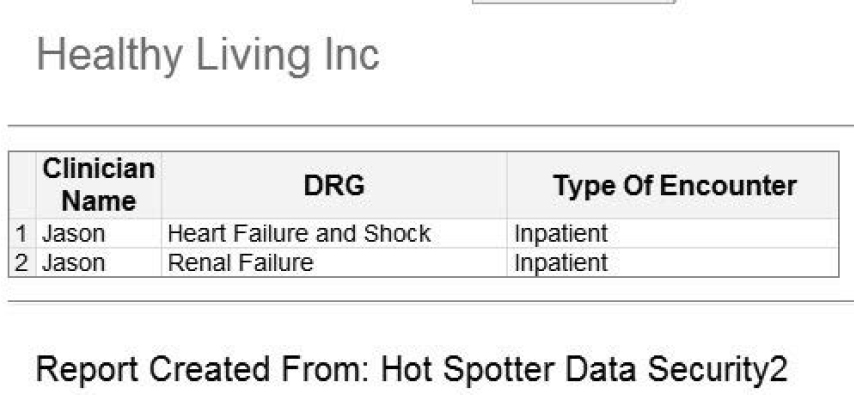
a. Log on as Jason and verify the report results.
Figure 7.10: DRG Codes Viewed by Jason
b. Log on as Renu and verify the report results.
Figure 7.11: DRG Codes Viewed by Renu

Think about the Member Profile report from the previous chapter. After being prompted to enter a MemberID, clinicians and analysts at Healthy Living Inc. use the report to view a complete health profile of a member. You can easily modify the information map, sourcing the Member Profile report to add data access restrictions. These security-based restrictions flow through seamlessly to the report, enabling you to comply with HIPAA privacy laws.
7.3 Dynamic Data Updates
The IT department at Healthy Living Inc. has two types of medical encounter data.
• The first type is medical encounter data derived from the company’s claims processing system. Because claims have gone through the billing process, they represent past encounters. Claims populate the Encounter table.
• The second type is recent medical encounter data arriving in daily loads from various hospitals as census reports. The census reports are in text format. They are placed in an area separate from the company’s data warehouse.
Clinicians at Healthy Living Inc. use the Member Profile report in SAS Web Report Studio to look up the medical encounters of a patient. However, they rely on SAS programmers to parse more recent medical encounters from hospital census reports. Because these reports are sometimes delayed, clinicians often miss important updates.
By integrating SAS stored processes with information maps, SAS programmers can deliver a web report that enables clinicians to access updated information at any time.
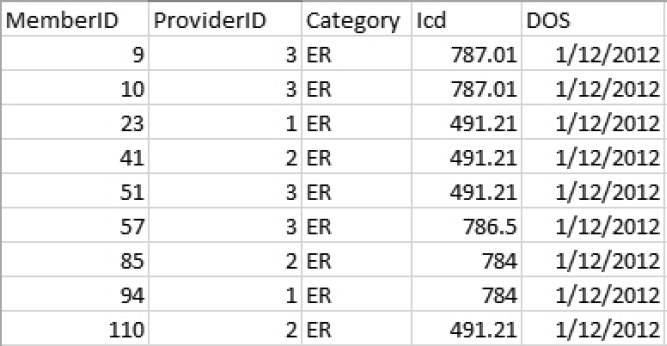
1. Begin by creating a mock hospital census report in Excel, saving the file as a CSV.
Figure 7.12: Hospital Census Report
2. Manipulate the data further using a SAS DATA step.
Program 7.2: Read Hospital Census Data
* Creating Hospital Census Data;
libname ER 'C:BI BookER Daily';
filename ER 'C:BI BookER DailyENCOUNTERSYESTERDAY.csv';
data ER.Encounters2;
infile ER dsd firstobs=2;
length Category $15 ProviderID $20 ICD $10 MemberID $10.;
input MemberID $ ProviderID $ Category $ ICD $ DOS:yymmdd10.;
format DOS mmddyy10.;
if _N_=1;* Placeholder data set;
run;
a. Program 7.2 performs the following:
i. It reads the CSV file and creates a permanent data set in the ER library.
ii. It places the first row of data in the permanent data set because the permanent data set is a placeholder.
3. The main idea behind dynamic updating with a SAS information map is to insert a stored process that accesses and processes the most recent hospital census reports. Every time the information map is queried, the stored process runs first, populating the map with dynamically updated data. A practical application of this concept has several components.
a. Every information map needs to have at least one permanent table defined in the metadata as its data source. This is the reason why a permanent data set is needed.
b. An information map can be used by multiple people at the same time. Therefore, the permanent data set is really a placeholder with one row of data. The placeholder data set can also be empty. The stored process embedded in the map accesses the most recent hospital census reports. Instead of producing a report as most stored processes do, it creates a data set. This is because a stored process in an information map cannot surface reports. The data set is created in each user’s temporary workspace. This is critical because it allows multiple people to use the map at the same time.
4. Put all of the parts into an information map.
5. Register Encounters2 in the ER library.
a. In SAS Enterprise Guide, select Tool → Update Library Metadata.
b. Select ER library.
c. Select Update and add table definitions in metadata with the actual tables and columns. This updates existing table definitions and adds new table definitions.
Figure 7.13: Register a Table in Metadata
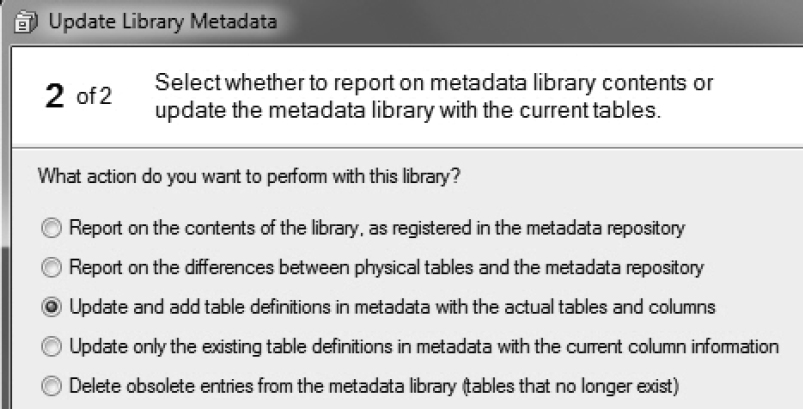
The first two buttons in the second step of the Update Library Metadata task create reports. The next three buttons perform updates.
6. Create code for a stored process. This code has two objectives.
a. It reads EncountersYesterday.csv to access the most recent encounters.
b. The code creates a data set in the user’s Work directory. This is done by rerouting the ER library to point to the user’s Work directory, enabling multiple users to run the stored process and the information map at the same time.
c. It places macro language for the stored processes within the code, rather than relying on a wizard to run the code.
Program 7.3: Stored Process Code for Dynamic Data Updating
filename ER ‘C:BI BookER DailyEncountersYesterday.csv’;
*ProcessBody;
%stpbegin;
%let workpath=%sysfunc(pathname(work));
*Point ER library to macro variable workpath;
Libname er “&workpath”;
data ER.Encounters2;
infile ER dsd firstobs=2;
length Category $15 ProviderID $20 ICD $10 MemberID $10.;
input MemberID $ ProviderID $ Category $ Icd $ DOS:yymmdd10.;
format DOS mmddyy10.;
run;
%stpend;
The PATHNAME function is used to determine the complete path of a user’s Work directory. %SYSFUNC allows non-macro functions such as PATHNAME to be used with macro code.
7. Convert the code in Program 7.3 to a stored process using the Create New SAS Stored Process wizard in SAS Enterprise Guide.
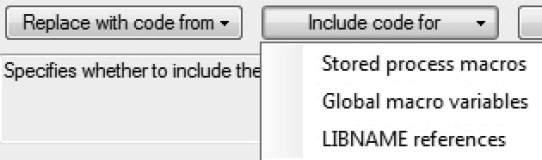
a. In the SAS code, prevent the wizard from adding stored process code as shown in Figure 7.14. In the drop-down menu for Include code for, deselect each of the three additions. The reason that the additions are not needed is that Program 7.3 includes all stored process code elements that are needed.
Figure 7.14: Control Stored Process Code Additions in the Wizard
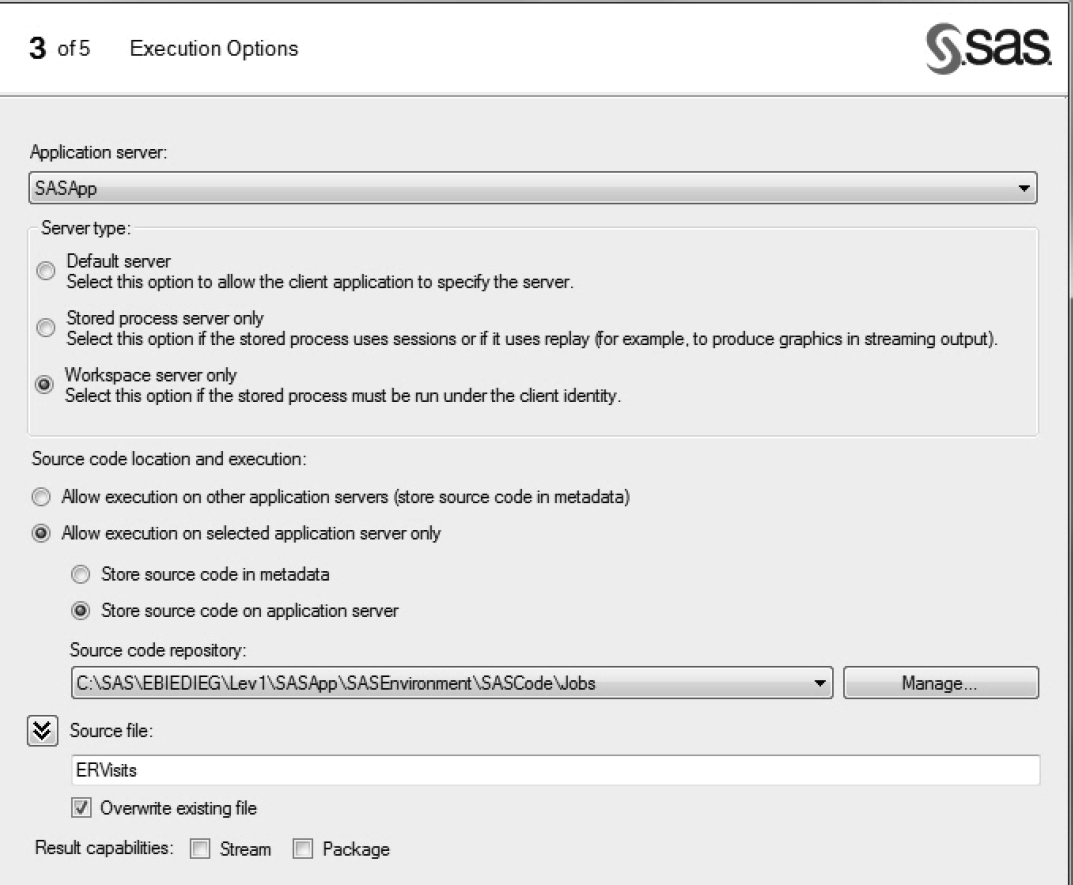
b. On the Execution Options page, enter information as shown in Figure 7.15.
i. For Server type, select Workspace server only. Information maps use the SAS Workspace Server and cannot see stored processes that run on the SAS Stored Process Server.
ii. For Results capabilities, deselect Stream and Package. An information map cannot accept any output from the stored process, other than output from the data set.
Figure 7.15: Execution Options
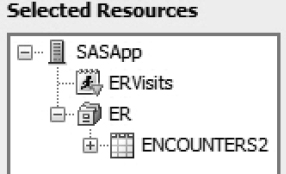
8. Build the information map.
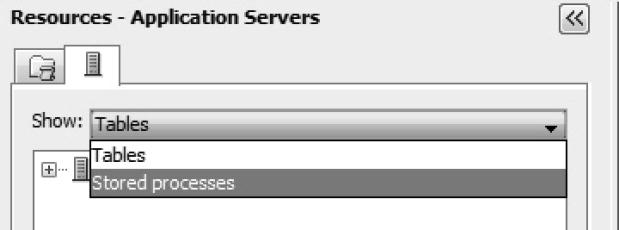
a. Add the Encounters2 table to Selected Resources because at least one permanent table is required before selecting a stored process. Recall that Encounters2 has one observation and acts as a placeholder data set.
b. For Show, select Stored processes as shown in Figure 7.16.
Figure 7.16: Show Stored Processes in SAS Information Map Studio
c. Locate and add ERVisits to Selected Resources as shown in Figure 7.17.
Figure 7.17: Stored Process in an Information Map
9. Test the information map and confirm that the stored process runs before the map is queried. Any updates to the source data flow through to the map when the stored process is run.
Figure 7.18: Dynamically Update Data with a Stored Process in an Information Map

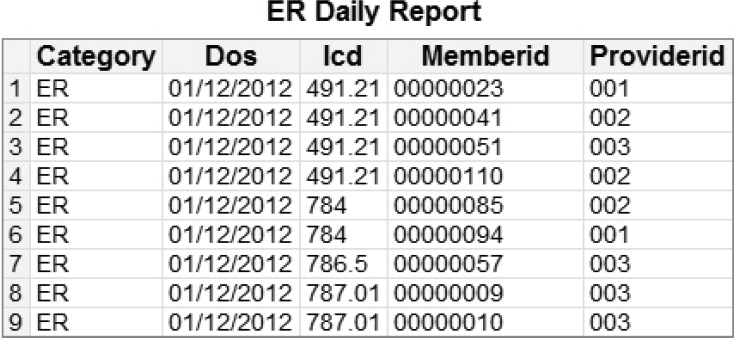
10. Create an ER Daily report in SAS Web Report Studio. The report shows the most recent medical encounters and can be run on demand or scheduled and distributed as needed.
Figure 7.19: ER Daily Report
7.4 Scheduling and Distributing a Report in SAS Web Report Studio
Clinicians at Healthy Living Inc. run the ER Daily report in several ways. They run it themselves when they need updated results. In addition, they have the report e-mailed to them on a specific schedule. This section focuses on report distribution via e-mail.
1. Select File → Manage Files.
To access the full functionality of file management, make sure that the report is not open. Close the report before you perform any file management tasks.
2. From the Actions drop-down menu for ER Daily, select Distribute as shown in Figure 7.20.
Figure 7.20: File Management in SAS Web Report Studio

The Actions drop-down menu shows file management capabilities. Although most menu options are self-explanatory, it is useful to fully understand Update resources. A report will break if its source information map is renamed or moved. Update resources provides a quick and easy way to update the information for a source information map without re-creating the report.
3. In step 1 of Distribute Report, enter a schedule as shown in Figure 7.21.
Figure 7.21: Report Scheduling in SAS Web Report Studio

4. In step 2 of Distribute Report, choose whether the report should be included as a PDF attachment or as HTML. Then, click Recipients and Distribution Rules to specify recipients.
5. Using the  icon, create a new recipient list. New rows can be added using the
  icon.
icon.
Figure 7.22: Create a Recipient List in SAS Web Report Studio

7.4.1: Distributing Reports Conditionally
A slight modification to the report and its distribution enables clinicians at Healthy Living Inc. to receive ER Daily differently. A clinician might be assigned to a cohort of patients and, as a result, might be interested in only monitoring the assigned cohort. Assume that clinicians at Healthy Living Inc. receive ER Daily based on Provider ID.
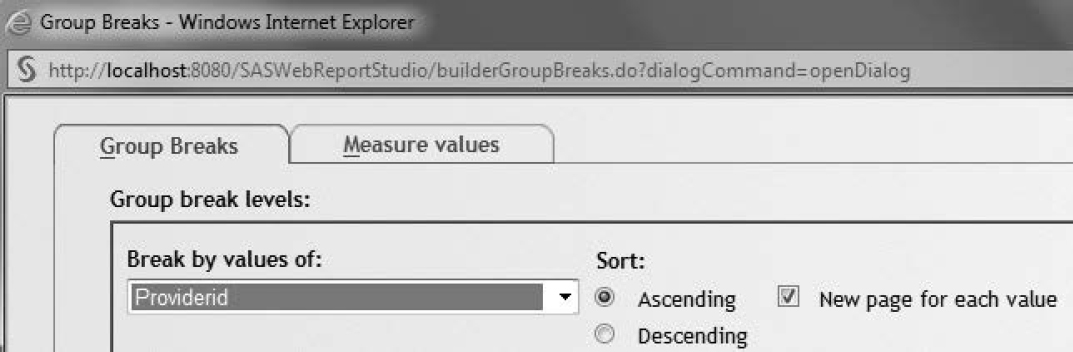
1. In SAS Web Report Studio, modify ER Daily to include report breaks. On the Edit tab, select Data → Edit Group Break.
2. In the Group Breaks dialog box, for Break by values of, select Providerid. Select the New page for each value check box as shown in Figure 7.23.
Figure 7.23: Report Breaks
3. Verify that the report contains sections by Providerid.
Figure 7.24: ER Daily Report by Providerid

4. Close the report.
5. Select File → Manage Files.
6. Click View my scheduled and distributed reports to modify the distribution created in section 7.4, “Scheduling and Distributing a Report in SAS Web Report Studio.”
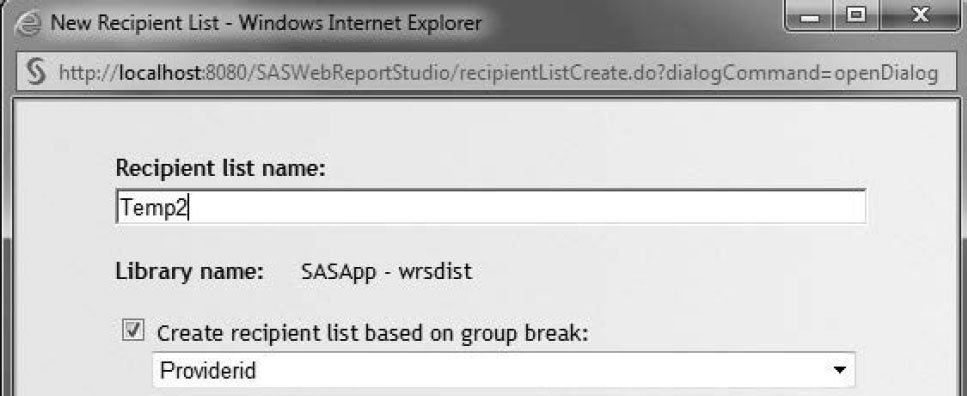
7. Create a new recipient list. The existing recipient list can be overwritten.
8. Click on the  icon to create a new recipient list. Select Create recipient list based on group break, and then select Providerid.
Figure 7.25: Modify Recipient List to Distribute Reports Conditionally
9. Enter e-mail addresses for each clinician for each value of Providerid.
Figure 7.26: Create a Conditional Recipient List
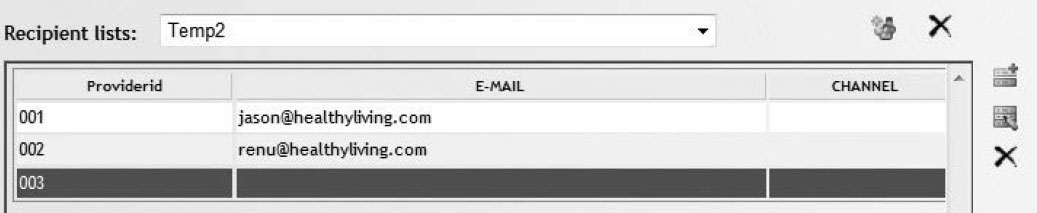
As a result of report and distribution modifications, different clinicians will receive different sections of the report. However, it is important not to confuse conditional report distribution with limited access to data. There is nothing to prevent a clinician from viewing the entire report by running it on demand.
7.5 Conclusion
In this chapter, you developed applications that use information maps in advanced ways. In the first health-care application, you saw how maps can restrict access to data. In the second application, you leveraged maps to enable users to receive dynamically updated data. Although both applications were presented in a separate and sequential manner, this was done for the sake of simplicity and clarity. You can combine the two applications to create a third application that restricts data access and provides dynamic updates.