
The other package we will be installing is called IPTraf, which is short for IP Traffic Monitor. This is a terminal-based program that monitors traffic on any of the interfaces connected to your network or the BeagleBone.
Once again, we save the tar ball to the /usr/src directory and then unzip it to a directory:
- First we get the tarball from the source website:
wget https://fedorahosted.org/releases/i/p/iptraf-ng/iptraf-ng-1.1.4.tar.gz - Then, we untar it into a directory:
tar –xzfv iptraf-ng-1.1.4.tar.gz - We then change to the
iptraf-ng-1.1.4directory, which was created previously. - Type the following commands to compile the source code:
./configure
make
make install
That's it we're done!
Perform the following steps for configuring IPTraf:
- We run the program by typing
iptraf-ngin the terminal window. The following is the start screen: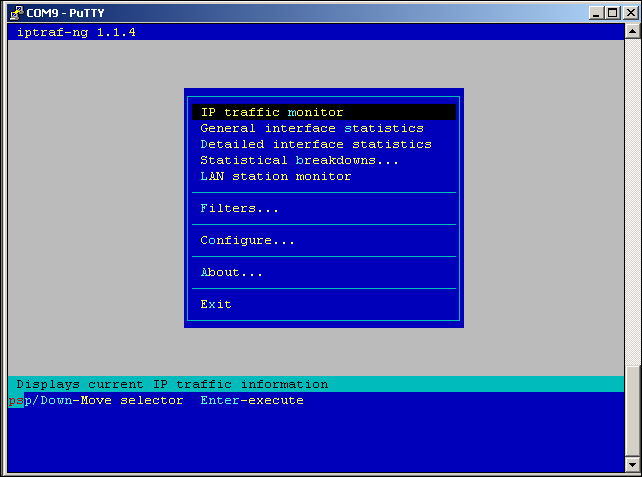
iptraf-ng start screen
- The first thing we have to do is to configure the program options:
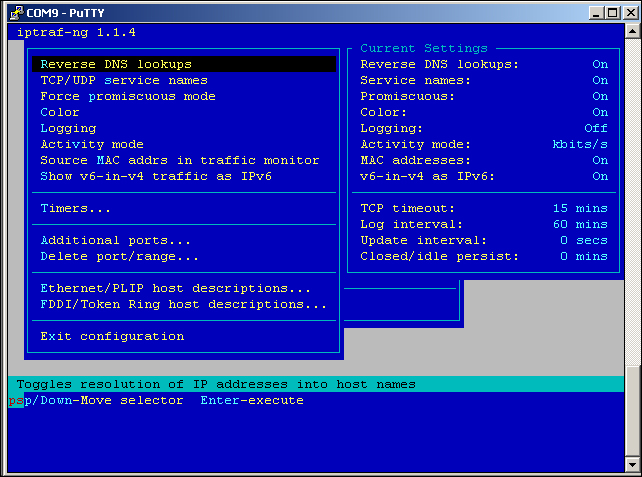
iptraf-ng configure screen
In the preceding figure, I have enabled all of the options, with the exception of logging. The up and down arrows on your terminal cause the menu bar to move up and down. A description of the feature appears in the box at the bottom.
- The next thing we can do is set up some simple filters:
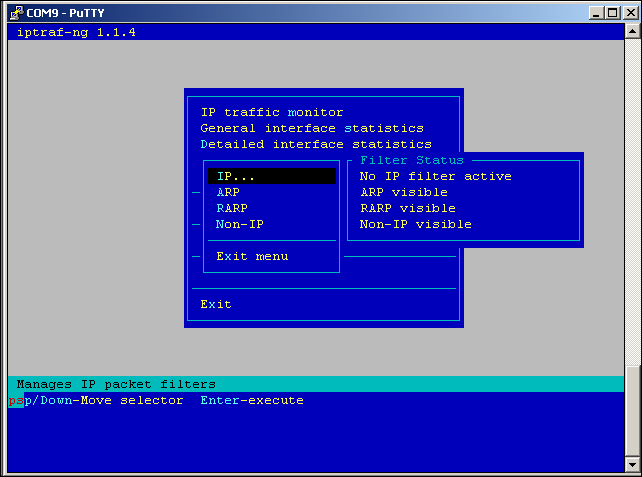
Set up a filter
- The next step is to edit a filter. From the IP section, we select Define New Filter.
Define New Filter
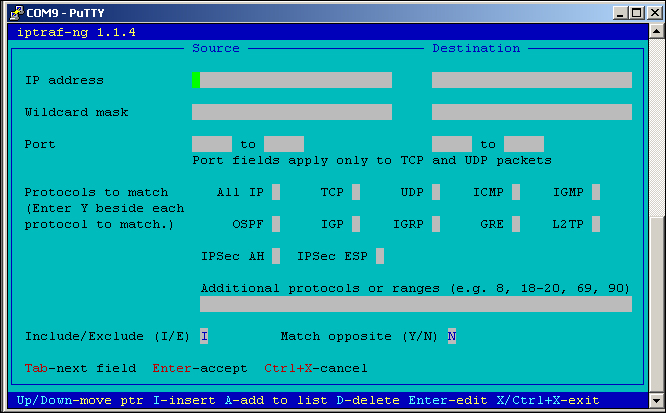
- We are now ready to enter some parameters. In my case, all I did was ask the software to track packets from a source address of
192.168.10.104, which is one of the computers on my network.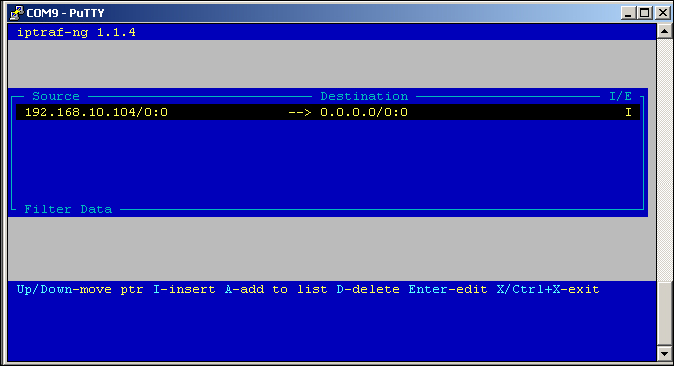
Filter data
- Now that we have our software configured, it is time to run and see what we can find.
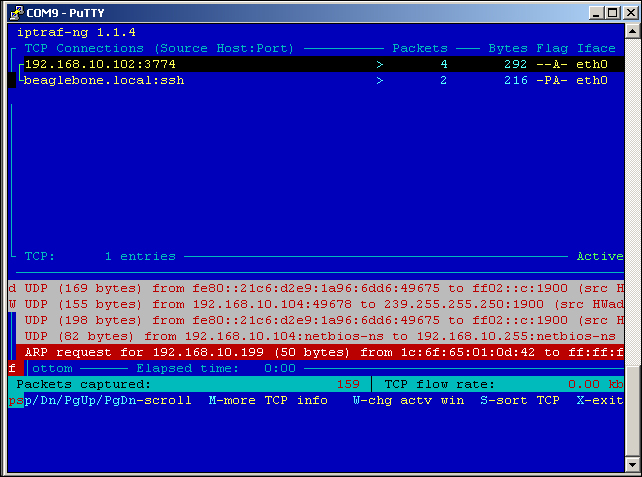
Capturing data
In the top portion of the window, we see the connections to eth0 on the BeagleBone. The first IP address is my lab computer, which I use for developing code. The second IP is a local connection that I made to BeagleBone via SSH. You will also notice an ARP request from one of my other PCs at the address 192.168.10.199.
Most of the other traffic is at the UDP packets 192.168.104, which (if you will recall) was the IP address in the filter we set up earlier.
For the skeptics in the audience, the following figure is the LAN computer's page of my wireless router.
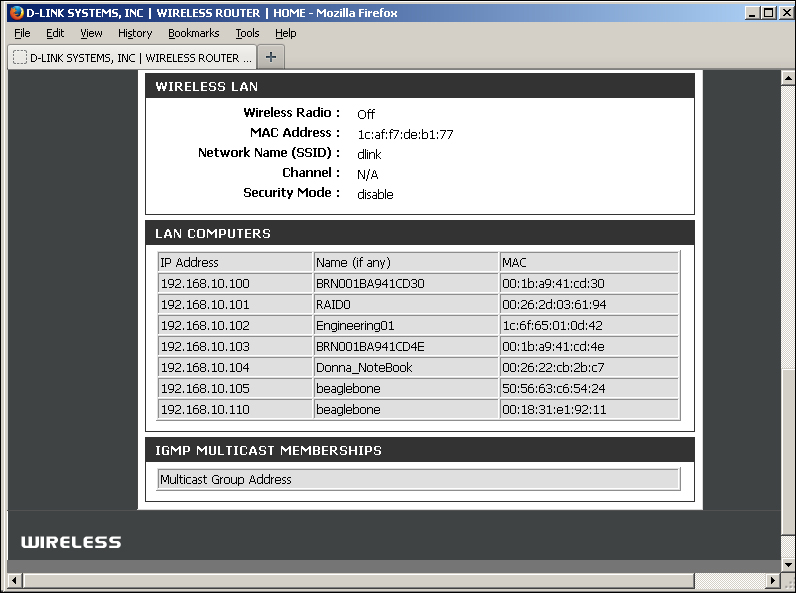
Network addresses
If you recall, I said that address 192.168.10.102 was my engineering lab computer. Also, my wife's notebook is the one we were filtering for, at 192.168.10.104.
The BeagleBone appears twice on the list because one address is assigned to eth0, which is the actual Ethernet port (192.168.10.105), and another is probably the USB/LAN port (192.168.10.110).
You can also see my two network RAID drives at the addresses 192.168.10.100 and 192.168.10.101.
The following is an excerpt from the IPTraf documentation, which is installed when you install IPTraf:
SYNOPSIS
iptraf { [ -f ] [ -q ] [ -u ] [ { -i iface | -g | -d iface | -s iface |
-z iface | -l iface } [ -t timeout ] [ -B [ -L logfile ] ] ] | [ -h ] }
For additional information on how to use IPTraf, simply type man iptraf at the console.