
As the name suggests, this action will help us drill down from a master view to show related and more detailed information in one or more target sheets. For example, drilling down to show relevant States by selecting a particular Region and further drilling down to show relevant cities by selecting a particular State from the filtered view. This kind of a structured drill down is often referred to as guided analytics. Let us understand how to create and use filter actions in Tableau.
We will use the already built dashboard for this recipe. We will begin by duplicating this dashboard and then creating the filter action to drill down from Sales distribution by Region sheet to Sales distribution by State as well as Sales distribution by Region and Category sheet. Let's get started.
- Begin by right-clicking on the Dashboard tab which says My first Tableau Dashboard and selecting the Duplicate Sheet option. Refer to the following screenshot:

- Rename this dashboard as
Dashboard for Filter Action. - Next, we will create actions by navigating to the Dashboard | Actions…. option from the toolbar. We will be offered the option as shown in the following screenshot:

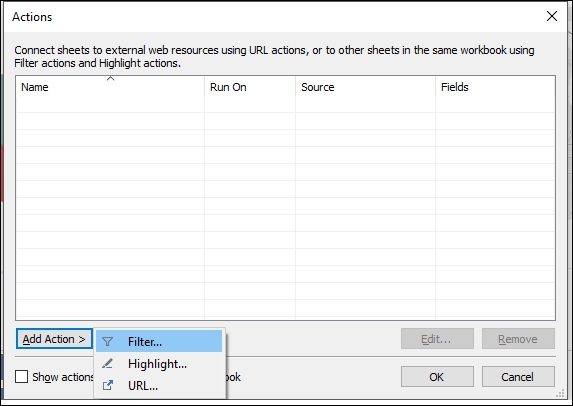
- Next, click on the Add Action > button and select the Filter… option. Refer to the following screenshot:
- Once we do that, we will get the view as shown in the following screenshot:

- Name this action
Region filter. In the Source Sheets: selection, we will keep the selection from the drop-down menu as it is and then uncheck everything except the Sales distribution by Region. In the Target Sheets selection, we will do a similar thing, except we will keep everything and instead only uncheck the Sales distribution by Region. From the Run action on: selection, click on the Select option and our updated action will be as shown in the following screenshot:
- When we click OK, we will get to see the view as shown in the following screenshot:

- Click OK to return to the dashboard. Now, click on the orange slice of the pie which represents the East region in the Sales distribution by Region sheet and see the other two sheets update accordingly to show the relevant information for the East region. Refer to the following screenshot:

- In order to clear the filter, we can click in the white area of the
Sales distribution by Regionsheet or click again on whatever is currently selected or simply just press Esc.
For any action to work, we need to specify a source and a target for that action. The source is where the action is created and the target is where the action will show the effect. We can have multiple source sheets and multiple target sheets as well.
The drop-down list that is available for the source and target selection can be used to either select a source sheet or data source. When we select a data source, we will get the list of individual sheets that should act as our source sheet.
Further, we can run the action by giving the user the following options:
- Hover: This will enable the action by simply hovering over a mark in the view.
- Select: We will have to click on a mark in the view to run the action.
- Menu: We can either activate the action by selecting the action from the right-click menu or by selecting the action that appears in the tooltip when we click or hover over a particular mark. Refer to the following screenshot:

Just below the Run action as: section, there is a section which says, Clearing the selection will:. There are three option available which are explained here:
- Leave the filter: Once the filter is cleared, this option will leave the filter on the target sheets. Even after the filter is cleared, the target sheets will still show the last filtered results.
- Show all values: Once the filter is cleared, this option will restore the original view of the target sheets by including all values.
- Exclude all values: Once the filter is cleared, this option will clear the complete view of the target sheets by excluding all values. These cleared sheets will only be visible when we select a mark from the source sheet.
Next, when we want to run the action from a specific mark on the source sheet, then we can specify the same in the bottom section of the action which says Target Filters. This section has an Add Filter dialog box which helps us add a filter to the target sheet based on a specific field. This filter will only include values that match the target field and the source field. For example, we have Sales distribution by Region and Category sheet. If we use this sheet as a source of the filter, then it will give us an output which will be for a combination of a particular Region and Category. Let's say we click on a bar which represents Furniture as Category and Central as Region. The filter action in this case, will update our target sheets to show information for Furniture Category and Central Region. However, this may not be the case always. We already have a Sales distribution by Region sheet, which is being used to filter the desired Regions. Whereas, we currently don't have the option for selecting only the categories. In this case, we can use the Target Filters option, where we use the Selected Fields option then click on the Add Filter button at the bottom left corner and define Category as Source Field and Target Field.
Read more about filter actions by referring the following link:
http://onlinehelp.tableau.com/current/pro/desktop/en-us/actions_filter.html.
Further, one last but important point to know is that we can also auto-generate a filter action by clicking on the dropdown of the gray border of the source sheet and selecting the option of Use as Filter. Refer to the following screenshot:
