It is said that a picture is worth a thousand words, and hence, instead of just looking at numbers in a grid format and trying to make sense out of them, it is always better to analyze the data visually. Having said that, there may be occasions when we are required to represent some data as numbers. This is where we can use Text tables in Tableau.
Text tables are also known as Crosstabs views and are typically used to show important numbers at a glance. They are very similar to Excel's pivot table.
Let's create a Text table view that shows the sales for different product categories across different regions. Let's see how we can build this.
- Create a new worksheet by pressing Ctrl + M on your keyboard. This will create a new sheet called Sheet 5. Let us rename it as Text table.
- Then let us drag the Region field from the Dimensions pane and drop it into the Columns shelf.
- Next, let us drag the Category field from the Dimensions pane and drop it into the Rows shelf.
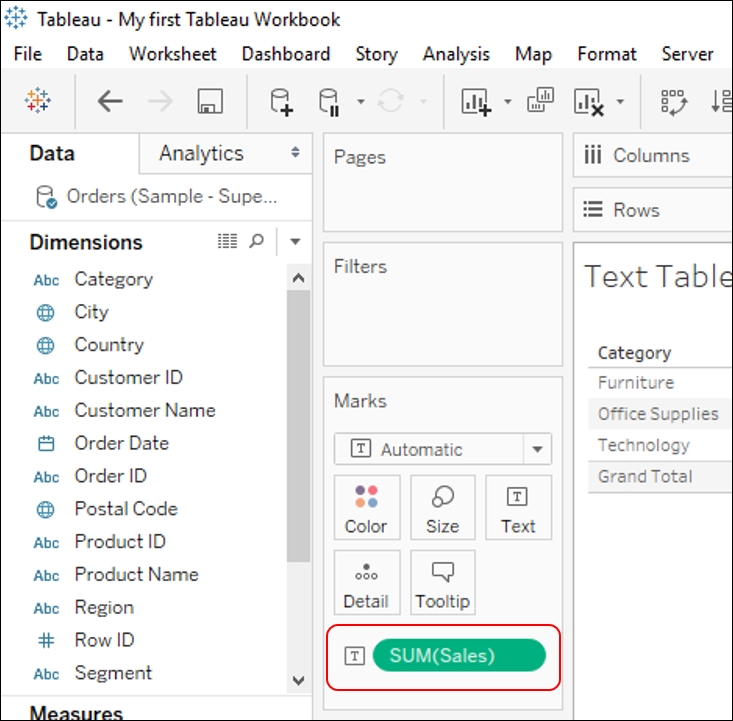
- After we have done this, we will drag the Sales field from the Measures pane and either drop it into the Text shelf in the Marks card, or into Abc in the view. Refer to the following image:

- After we drop Sales into the Text shelf, we will get to see the view shown in the following image:

- This is how we create a Text table in Tableau. Now, these are just numbers that show the Sales of each product Category across each Region. However, we still don't know the total sales of product categories or the total sales of the different Regions. To achieve this, we will click on Analysis in the Menu bar or toolbar. Select Total and then select Show Row Grand Totals and Show Column Grand Totals. See the following image:

- Once we have selected both the respective grand totals of both the rows and columns, we will get the output as shown in the following image:

The mark used for creating a Text table in Tableau is Text. When we put Category in the Rows shelf and Region in the Columns shelf, we create a crosstab output and the number in a cell is basically the Sales value for a particular Category in a particular Region.
For example, the first value from the left is 163797 and is shared between Furniture and Central. This is the Sales value of Furniture in the Central region.
Since this is a Text table, we will see that the Sales field is placed in the Text shelf in the Marks card and the icon in front of the Sum(Sales) pill is to let the user know which shelf is used to represent the field. Refer to the following image: