
The Manual approach in Tableau is a simple drag and drop functionality that users can adopt to build visualizations. This approach gives the users power and flexibility to decide how they want to create their views. In the following recipe, we will build some basic views using the Manual approach.
We can manually build a view in Tableau by dragging and dropping the Dimensions and Measures pane into the Rows or Columns shelf. We will see this approach in the following recipe, and to do this, we will continue working in the workbook named My first Tableau Workbook, which we created and saved in Chapter 1, Keep Calm and Say Hello to Tableau.
- If the workbook isn't already open, then open it by double-clicking on
My first Tableau Workbook.twbby navigating toDocuments|My Tableau Repository|Workbooks. Once we do this, we will see the view shown in the following screenshot:
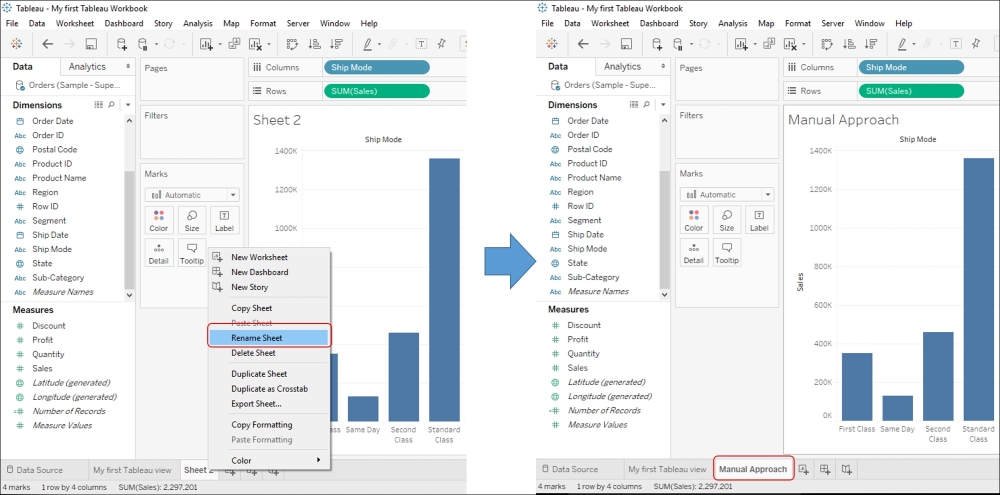
- Now, to create our next visualization, create a new worksheet by right-clicking on the tab that says My first Tableau view and selecting the New Worksheet option; alternatively, you can do this by clicking on the first tab right next to the My first Tableau view tab. You can also create a new worksheet by selecting the New Worksheet icon on the toolbar or by typing Ctrl + M on the keyboard. Refer to the following image:

- Once we do this, we will get a blank new worksheet named Sheet 2. In Sheet 2, first let us drag the Ship Mode field from the Dimensions pane and drop it into the Columns shelf. We will then drag the Sales field from the Measures pane and drop it into the Rows shelf. Refer to the following image:

- This is how we can use the drag and drop approach to manually build views in Tableau. However, as the last finishing touch for this recipe, right-click on Sheet tab, which says Sheet 2, and rename it to Manual approach. Refer to the following image:
When we use the Manual approach, there is no hard-and-fast rule for dragging and dropping fields into a particular shelf. We can place our Dimensions and Measures fields in either the Rows shelf or the Columns shelf; alternatively, we can also use the Color, Size, Text, or Detail shelf.
Further, instead of directly dropping fields into the Rows or Columns shelf, we can also drop them into the section that says Drop field here. Refer to the following image:

Dropping the field into the vertical section (refer to annotation 1) is the same as placing the field in the Rows shelf. When we do this, the field automatically gets placed in the Rows shelf. Similarly, dropping the field into the horizontal section (refer to annotation 2) is equivalent to dropping it into the Columns shelf. And, if we drop Dimension into the middle section (refer to annotation 3), then by default, Tableau will place it in the Rows shelf. However, if we place Measure in the middle section, then Tableau will place the field in the Text shelf in the Marks card. This is the default behavior of Tableau.
What are those Blue and Green pills?
In an earlier recipe, where we created a bar chart to show Sales by Ship Mode, we also saw that Ship Mode in the Columns shelf is shown as a Blue pill and Sum(Sales) in the Rows shelf is shown as a Green pill. This is because Ship Mode is a discrete field, whereas Sales is a continuous field.
Discrete fields are always shown as a Blue pill and will always result in headers being drawn whenever they are placed on the Rows or Columns shelves.
However, Continuous fields are always shown as a Green pill and will always result in axes when we add them to the view.