
In the previous recipe, we saw the filter action which basically filters the view based on the selection. However, if you don't wish to filter the view but instead just draw attention to certain marks that are of interest, then a great way to do so is to simply color them and dim the rest. This is what we use highlight actions for. As the names suggests, this action highlights the marks based on a certain selection while dimming the other marks. This way we can draw attention to the points of interest while being able to compare them with the other marks as well.
Let us see how to create and use a highlight action.
We will use the already built dashboard for this recipe. We will begin by duplicating the My first Tableau Dashboard and then creating the highlight action from Sales distribution by Region sheet to Sales distribution by State as well as Sales distribution by Region and Category sheet to highlight only the selected region. Let's get started.
- In order to create a highlight action, let us first duplicate the Dashboard tab which says
My first Tableau Dashboardand rename it asDashboard for Highlight Action. - Then select Dashboard | Actions…. and from the Add Action > button select the Highlight… option.
- Once we do that, the view will be as shown in following screenshot:

- Name this action
Region highlight. In the Source Sheets: selection, we will keep the selection from the dropdown as it is and then uncheck everything except the Sales distribution by Region. In the Target Sheets section, we will do a similar thing except we will keep everything and instead uncheck the Sales distribution by Region. From the Run action on: section, we will click on the Menu option and our updated action will be as shown in the following screenshot:
- When we click OK, we will get to see the view as shown in the following screenshot:

- Click OK and return to our dashboard. Now we need to remember that the highlight action is available on the Menu option.
- Now, in order to enable the highlight action, we will first have to click on the link which appears in the tooltip when we hover over any Region on the pie chart. However, if the link doesn't appear in the tooltip , then we can enable it in our tooltip by first selecting the
Sales distribution by Region sheetand then clicking on the Worksheet | Tooltip… option in the toolbar and then selecting the On Hover – Show tooltips on hover option from the dropdown. Refer to the following screenshot:
- Once we are done with this, we can see a link when we hover over any Region in the
Sales distribution by Regionsheet. Refer to the following screenshot: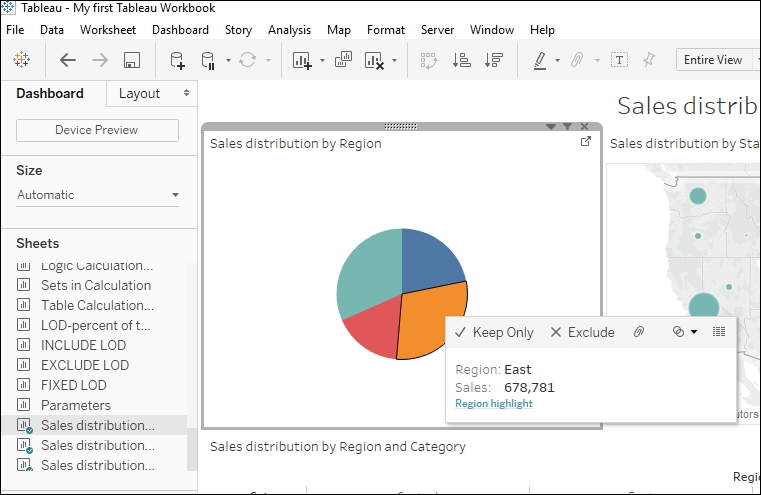
- Enable the highlight action by clicking on this link in the tooltip which appears when, let's say, we hover over the orange slice which is the East region. Once we do that, we will see the see the view as shown in the following screenshot:

- Notice how the map highlights the orange colored bubbles, whereas, in the bar chart, since there is no color used, it just highlights the pane for the East region.
- Now, in order to clear this action, we can click in the white area of the
Sales distribution by Regionsheet or just press Esc on our keyboards.
The difference between filter and highlight actions is that the filter action will update the target sheets to show only the relevant marks whereas the highlight action will update the target sheets to show each and every mark and highlight only the relevant marks and dim the rest.
In the highlight action, we saw a section labeled Target Highlighting. This has three options which are as follows:
- Selected Fields: When we use this option, the marks in the target sheets will be highlighted based on the selected fields in the source sheet and these marks will only be highlighted when the marks in the target sheets are the same as the selected ones that are selected in the source sheets.
- Dates and Times: When we use this option, the marks in the target sheet will be highlighted only when the date and time of the marks in the target sheet and the date and time of the selected marks in the source sheets are the same.
- All Fields: When we use this option, the marks in the target sheets are highlighted when they match the marks selected in the source sheet. This is like an Include all option where all fields are considered while trying to find a match.
Highlight actions can also be auto-generated from a Color legend or from the highlight option in the toolbar. Refer to the following screenshot:

Another way of highlighting any mark is to use the Highlighters feature in Tableau. It basically gives an input box where we can search for data points by typing the words or selecting from a drop-down list. In the preceding example, if we enable this functionality for Region, then we will get an input box saying Highlight Region and when we type a region, Tableau will highlight that region. To enable this, we can select a sheet on the dashboard or go to a sheet and select the Analysis | Highlighters option from the toolbar. Refer to the following screenshot:

Read more about the highlight action by referring to the following link: http://onlinehelp.tableau.com/current/pro/desktop/en-us/actions_highlight.html.