
In this chapter, we will learn the techniques of designing and building a variety of IDS/IPS capabilities into our network range. We will also look at the deployment of typical host and endpoint security configurations. We will discuss the following topics:
- Deploying a network-based IDS
- Implementing a host-based IPS and endpoint security
- Working with virtual switches
- Evasion
This chapter will provide us with a methodology to use when we encounter a number of different monitoring devices. In this chapter, we will look at evasion, that is, techniques to avoid detection. While this is a popular topic, as a professional security tester, the reality is that it is rarely asked for; furthermore, it is dependent on so many factors, it is not something that is easy to prepare for. The success is largely determined by the type and location of the IDS sensors, as well as their configuration. There is a possibility that you will be asked to evade detection as part of the scope of your work and this is why we cover it in the book.
As we previously discussed in Chapter 6, Creating an External Attack Architecture, when we deploy a network-based Intrusion Detection System (IDS), we place a sensor on each segment of the network. The sensor consists of a network card that is placed in promiscuous mode, and this turns the MAC address filtering off. All of the traffic is passed up the stack and to the application that is monitoring the sensor. We also discussed the challenges of deploying sensors on a switch, since the traffic is not sent out of all ports, and this can pose a challenge to provide data to the sensor.
With a network-based IDS, the function of the IDS is to process the network traffic at the packet level and then analyze it for characteristics or patterns that might be indications of an attack. As you think about this, keep in mind that the network sensor is capturing packets; so, how many packets are traversing the network at any one time? This is one of the challenges of the network-based IDS (how to process traffic at ever-increasing speeds of a network). However, we are getting ahead of ourselves. The first thing we want to do is design our architecture so that we have a good representation of a typical IDS we might see on a client's network. We will be using the following diagram:
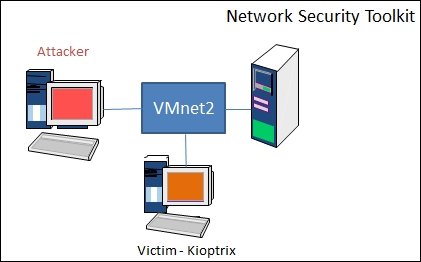
We can build the architecture and test sensors at every point, but there really is no point in doing that. This is because we have the luxury of using a virtual environment such as VMware. So, once we decide what we want to test with, we just change the network adapter to be connected to that switch. Again, this is another reason why we have made the choices that we have.
Another thing to note is that we want to have a victim to attack and see how the IDS responds, but an even better method, especially when it comes to evasion, is to channelize the attack traffic directly at the network sensor. This would provide us with the power to see whether the attack at the sensor can get through without being detected. We will do this later, in the Evasion section.
The next thing we will do is start up our three machines and verify whether we have the IDS up and functioning. Before we do this, you should verify your settings with the Network Security Toolkit, the Kali machine, and the victim, and check that they are all connected to the VMnet2 switch. You might be wondering why we do not use the VMnet8 switch, as it would provide us with Internet connectivity and other built-in features of the VMware tool. This is a valid question, and the biggest reason why we have selected another switch is that we want to ensure we do not have any spurious or abnormal traffic that could cause us problems with the sensor. The VMnet8 switch shares the adapter configuration with the host machine, and often, there are packets that are transmitted and can interfere with our results. Once the machines are started, we will start the Snort sensor. Log in to the Network Security Toolkit virtual machine, then click on Applications | Internet | Firefox and open the Firefox tool.
If the Firefox browser opens and there is no username and password set in the displayed dialog box, enter the username and password that you created when the machine was built, or when you ran the script.
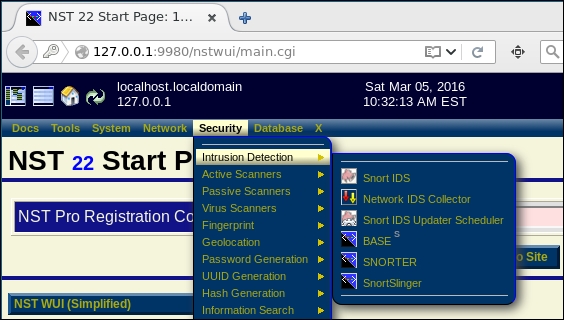
This should place you at the home page of the Network Security Toolkit Web User Interface. Then, navigate to Security | Intrusion Detection | Snort IDS, as shown in the following screenshot:
Once the Snort page opens, you will want to see which state you left the machine in when you either suspended or shut down the virtual machine. If you do not see a sensor in a state listed, then you have to configure the interface for the sensor. Even though we explained this earlier, we will work through it again so that you do not have to look for it. If you do not see a sensor listed, then you need to scroll down and select the appropriate interface. For the book, we are using the eth16777736 interface, so the examples that follow will be based on this. If you have set the VMnet2 switch on another interface, then you will have to select that interface and not the one we are using.
Once you have selected the radio button for the appropriate interface, then click on Setup/Start Snort to start the sensor on the interface.
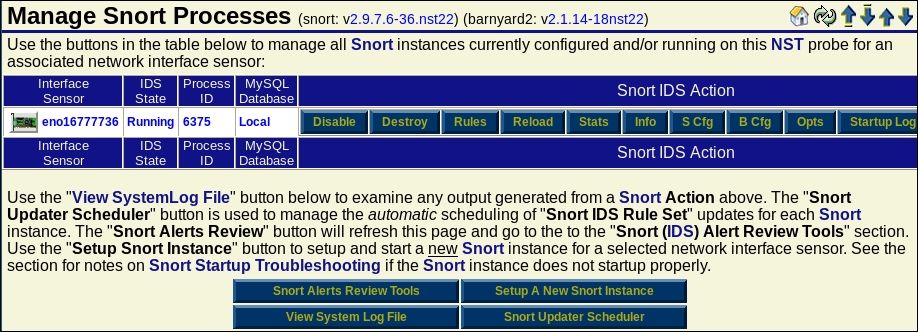
Once the sensor has successfully started, you should see that the Snort sensor is in the Running state, as shown in the following screenshot:
Once the process is in the state we want it to be in, we will verify whether our rule is turned on. Click on Rules and verify whether the scan rules are selected. An example of this is shown in the following screenshot:
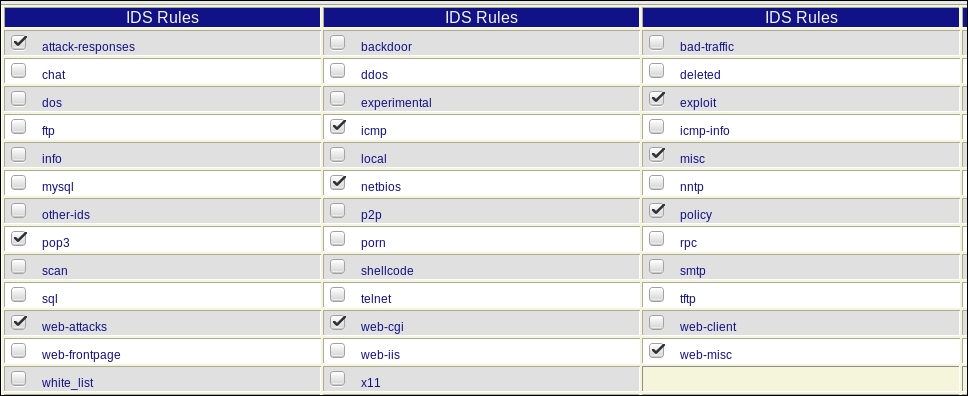
As the previous screenshot shows, the scan rules are not activated, and as such we have to select them before continuing.
Once you have started Snort, open another window and use an illegal flag combination scan to verify the sensor is working. As a reminder, we used the Christmas tree scan in Chapter 6, Creating an External Attack Architecture; you can use this or any scan that contains illegal flags, such as a FIN or a NULL scan.
Another thing that we like about Network Security Toolkit, in addition to the ease of setup of Snort, is the fact that we have excellent tools for Snort. We will look at the Base Analysis Search Engine (BASE) tool. To start BASE, you need to navigate to Security | Intrusion Detection | BASE.
When the BASE tool starts, you will be asked to authenticate yourself. The credentials should already be entered for you, and if not, then you will have to enter the appropriate credentials to access the GUI. Once you have done this, click on OK, as shown in the following screenshot:
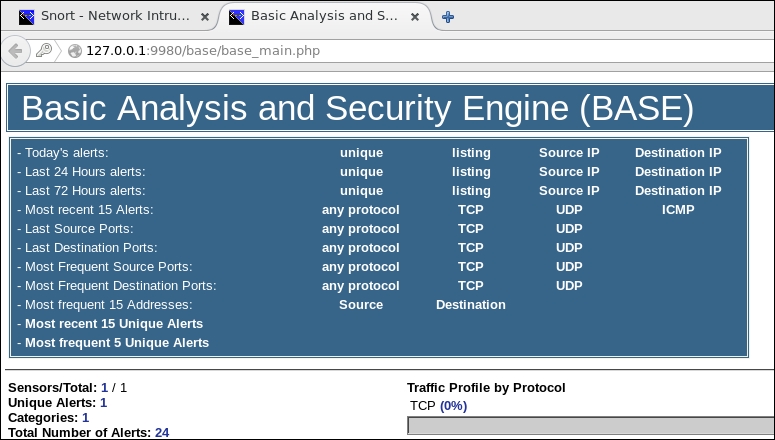
The BASE GUI allows us to record the alerts that the sensor detects in the graphical display. Return to your Kali machine and run the Christmas tree scan again. As a reminder, you configure the scan using the X option. Once the scan is complete, return to the BASE display and refresh the display, and you should now see detected TCP traffic, as shown in the following screenshot:
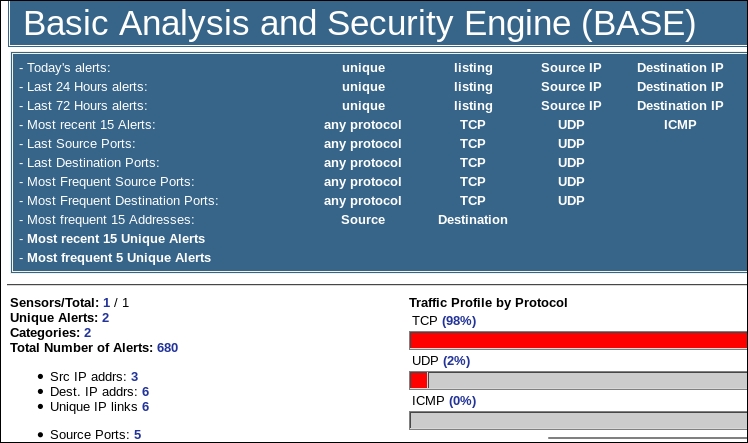
A nice thing about the BASE tool is the information that you can examine from the alerts. We will do this now. Click on the percentage number and this will bring up another window with a list of the alerts that have been detected by the sensor. An example of this is shown in the following screenshot:
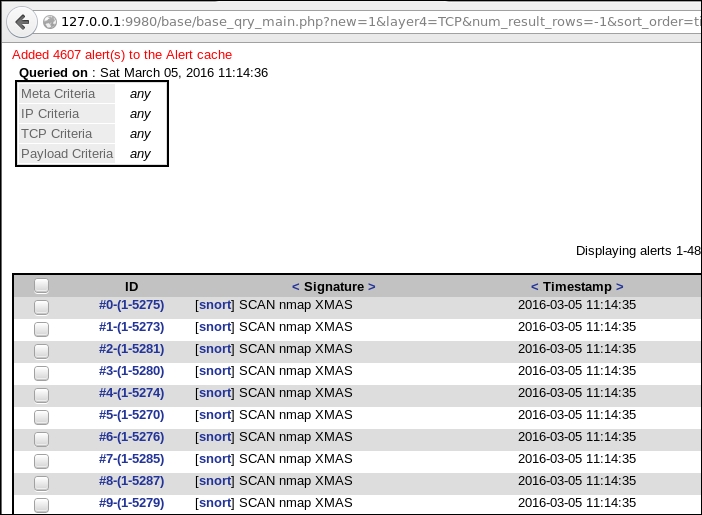
The next thing we want to do is to examine the alerts. We do this by clicking on an alert. When you click on the alert, you will see additional information about the alert. An example of this is shown in the following screenshot:
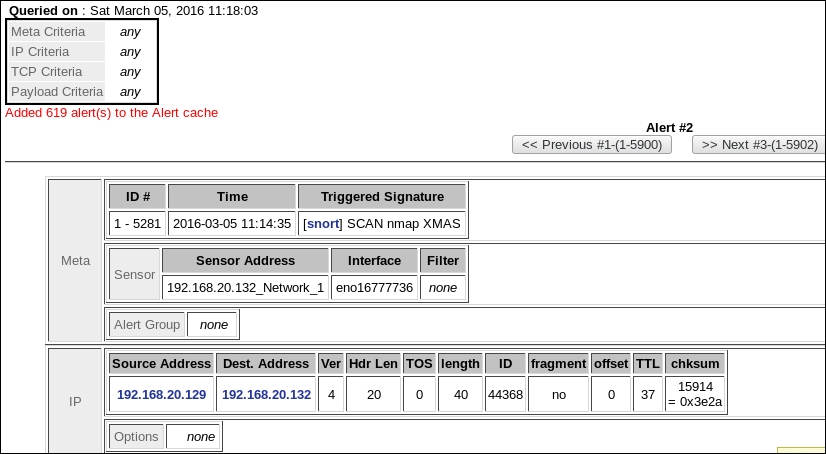
As the previous screenshot shows, the composition of the packet, including the display of the encapsulated data, is available for review. This shows that the Nmap tool sets the FIN, PUSH, and URGENT flags to represent the scan. Some tools will set all six flags when they perform the scan.
There are two links located in the Meta section and under the Triggered Signature. Click on the Snort link and it will bring up the rule that triggered the signature.
The signature shows information that you can examine to discover additional details, not only about the signature, but also about the impact of the triggered event. Furthermore, you can address information on the false positive rating. This is important because many administrators that implement an IDS will turn off signatures that generate a high number of false alerts. In fact, as you may recall, we had to turn the scan rule on, and this is because it has a tendency for a high false positive rating. We will now examine the false positive rating of the Nmap XMAS scan. In a browser, enter https://www.snort.org/rule-docs/1-1228. Scroll down and review the information; one of the things you want to look at here is the false positive rating. This continues to be a problem for IDSes, and it is something we can take advantage of during our testing. From the defense standpoint it is imperative that an IDS be tuned in an environment, and it is one of the things that often either does not get done, or is not done properly. Of course, since we are penetration testing, that is a good thing for us. An example of the beginning of the page is shown in the following screenshot:
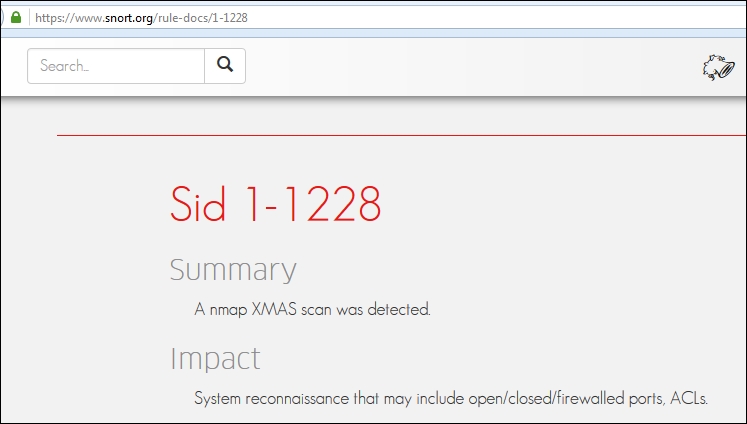
The false positive rating will be shown further down the page, and as you will discover, there is no false positive rating for an XMAS scan, and when you think about it, that makes sense because it is such a defined setting of flags in a packet.
We now have an IDS range that we can use to observe how our different tools and techniques will react. Before we do this, we will clear any alerts in the machine, and to do this, you need to go to the bottom of the Query Results screen and navigate to Action | Delete alert(s). Once you have done this, click on the Entire Query button to delete the alerts and then return to the main screen by clicking on Home. We will use the Nikto web scanning tool to see how the Snort sensor reacts when the scanner is used. We are going to scan the Network Security Toolkit web server that is on the network of the Snort sensor. To conduct the scan in the Kali Linux machine, open a terminal window and enter nikto -p 9943 -h <IP address of the Sensor>.
The ssl option would be used to force the check of Secure Sockets Layer (SSL), since in the default configuration, the Network Security Toolkit does not have a web server at port 80; only HTTPS port 9943 is accessible. When the scan has finished, you will notice that there are several findings. To review the findings, you will need to scroll back through and look for them. As with most tools, there is a better way, and we will explore this now.
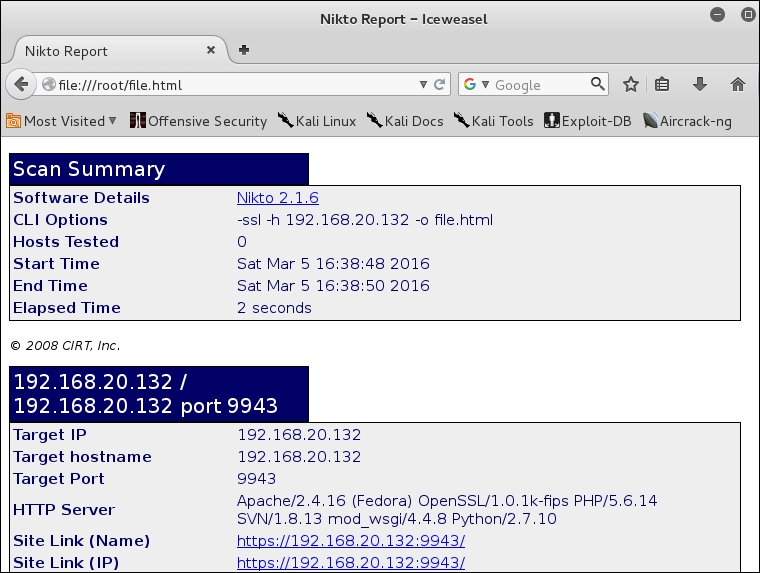
In the terminal window, we will use the output capability of the tool to write it to a file. Enter nikto -p 9943 -h <IP address of the Sensor> -o file.html.
This has taken the output from the tool findings and written it to an HTML file. Open Iceweasel in Kali by navigating to Favorites | Iceweasel.
When the browser opens, open the file that you have created and review the results. You will see the output is much easier to read, as shown in the following screenshot:
It is now time to return to our Snort sensor and BASE display to see whether we have any alerts. We have conducted a number of web scans and want to see what has been detected. Return to your Network Security Toolkit and refresh the BASE display and review the information. An example is shown in the following screenshot:
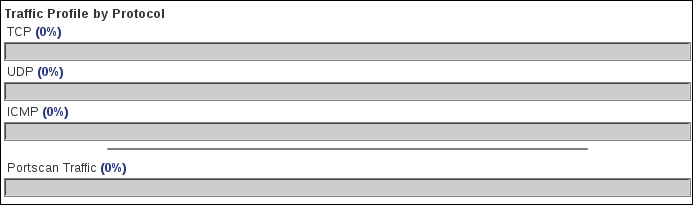
As the previous screenshot shows, we have no alerts! Why is this? Well, this is part of the process of trial and error. We know that specific rules were loaded when we configured the Snort sensor, because we had to enable some in the past. So, the process from here will be to try to enable more rules and see what happens. There is also a good chance that there is another problem, but as long as we send our illegal flag combination packets in, we get some sort of an alert, and this tells us the sensor is working. In this case, if you turn all of the rules on, there will still not be an alert. We will save the answer to this until we get to the section on evasion.