This chapter will provide us with an external attack architecture that will provide the capability to emulate a number of different testing environments. In the chapter, we will work through the process of configuring the range's core devices that are the connecting devices for the architectures such as the router, switches, and the firewall machine. Consequently, we can easily build a target machine or device and plug it into our architecture and begin testing it immediately.
In this chapter, we will build an external architecture that we will use as we progress through the different phases of attack. We will discuss how to configure firewall architectures and establish layered architectures.
Our intentions here are to provide a number of layers that we, as an externally located attacker, may have to penetrate to get to the target. This is the reality of external testing; many of the targets will have multiple protections in place between the attacker and the target. Fortunately, as these machines are required to allow access to services from the outside, they will also provide access to us as we conduct our testing.
We will build our network architecture to provide the layers that are shown in the following diagram:

As the diagram shows, we are using the OWASP Broken Web Application (BWA) machine for our target at the different layers. This can be any machine that you want to test; for now, we will use this one as an example. The research you have done up to this point will assist in what machines you need to configure within the architecture. Once you have the switches defined and the layers created, the rest is pretty straightforward.
As discussed in Chapter 4, Identifying Range Architectures, this is the power of our planned architecture; we just plug in machines wherever we want to test them. In the architecture shown in the previous diagram, we have our router device for our testing from a perimeter position. As we mentioned in Chapter 3, Planning a Range, we are using the Dynamips Cisco software emulator for the book, and we need to configure this to allow our services.
Tip
We now have a router in our architecture, and while we might encounter a router without filtering on it, more than likely we will not get that lucky; therefore, we will need to set up filtering on our router device. This is definitely something we want to add, but for now, we will build the network and make sure it works before we apply filtering. This is so we can troubleshoot as required and not have to deal with the filtering.
If you are using the iptables option, then you will have to configure that device to support the services of your architecture; furthermore, you can select any available software on the Internet to perform the role of your first perimeter device. You can search on the Internet for available software that can emulate a router. You also have the option of purchasing the physical device as well. You can find used Cisco routers on the eBay auction site, as well as other sites, for a fraction of what it costs to buy one new.
The first step is to boot up the router device in VMware Workstation. Once the machine has finished booting, log in with the username and password that you created during the installation of the software. Enter dynamips -H 7200 to start the router. Once it has started, you need to load the configuration file by opening another terminal window and entering dynagen config.net. Once the configuration loads, enter the R1 console and access the running router. At the router prompt, enter en to enter the privileged mode on the router.
At this point, we next enter show ip int brief to show the configuration of the router interfaces; your output should be similar to that shown in the following screenshot:

As the previous screenshot shows, we have our two interfaces in the router showing Status as up and Protocol also as up, and this is what we want. If your router screen does not show this, you will have to go back through the process we used in Chapter 4, Identifying Range Architectures, to see what went wrong. Hopefully, you will at least see the IP address information as correct. If this is the case, then it is probably just a matter of bringing up the interface, which is accomplished by entering no shut in the interface configuration menu. To bring up the interface, enter the following commands:
conf t
int <interface name eg: f0/0>
no shut
If you do not have the correct address information, then you might not have saved the configuration we created in Chapter 4, Identifying Range Architectures, and so you will have to return to that chapter and proceed through the steps to get the results shown in the previous screenshot.
We could continue and build more layers to our architecture, but a better design method is to test each layer before you move on to the next one. As we review the previous diagram, we have three machines that are the components of the first layer of our architecture. An example of this is shown in the following screenshot:

We now want to add these machines and conduct our testing. The router is up and running, so we have two machines to bring up. The next machine we will bring up is the attacker. As we did in Chapter 4, Identifying Range Architectures, we will use the Kali Linux distribution machine. The preferred machine is the one that we downloaded in the VM format. The configuration of the VM is shown in the following screenshot:
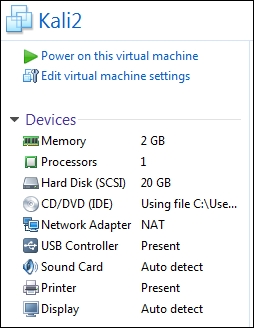
The example in the screenshot is just as a reference; your configuration specifics will be dependent on the hardware you have available on your machine.
The main thing that we want to ensure is that we have one of our network cards connected to the VMnet8 (NAT) switch, and in this case, we do have that. Once we have verified the network adapters, we can start up the virtual machine. Once the machine comes up, log in with a username and password that you have created, or the defaults if you have not changed the password. It is a good idea to update the distribution any time you start the Kali VM. However, before you do this, always take a snapshot in case something goes wrong during the update. Navigate to VM | Snapshot | Take snapshot. In the window that opens, enter a name for your snapshot and click on Take snapshot. After you have taken the snapshot, update the distribution by entering the following commands:
apt-get update
apt-get dist-upgrade
Once the upgrade has completed, the next thing to do is to test connectivity to the router. On Kali, enter ping 192.168.80.20 -c 5, and if all goes well, you should see a reply; if not, then it is time to troubleshoot, and this is when you learn.
Now that we have connectivity, we are ready to add our next machine, and this is our web server. As we mentioned in Chapter 4, Identifying Range Architectures, we have many choices when it comes to adding a web server, and it really is a matter of personal preference. As we know, we are going to deploy two web servers in the architecture; we can select a different web server for the other machines; it is a matter of personal preference, as long as we have the machines with the services on them, that is all that is required. For the first web server in the book, we are going to select Broken Web Application VM from the OWASP and Mandiant. As this is going to be connected to the DMZ switch, we only have to make sure the network adapter is connected to the VMnet2 switch.
Once the configuration has been verified, the next thing we will do is start the virtual machine. After the machine has started, you will note the IP address assigned to the VM. Now that we have the machine up and running, we want to verify that we can access it. We have a couple of choices; however, before we do that, there is one more thing we have to be careful of. This, again, is one of the challenges of virtualization: since we have created the VMnet2 switch on the host, we will be able to route traffic to the OWASP virtual machine via the switch on the host, and that is not what we want to be able to do when we are using different layers in the network. To avoid this, we want to disable the VMnet2 switch on the host. Once you have done that we can then test more accurately.
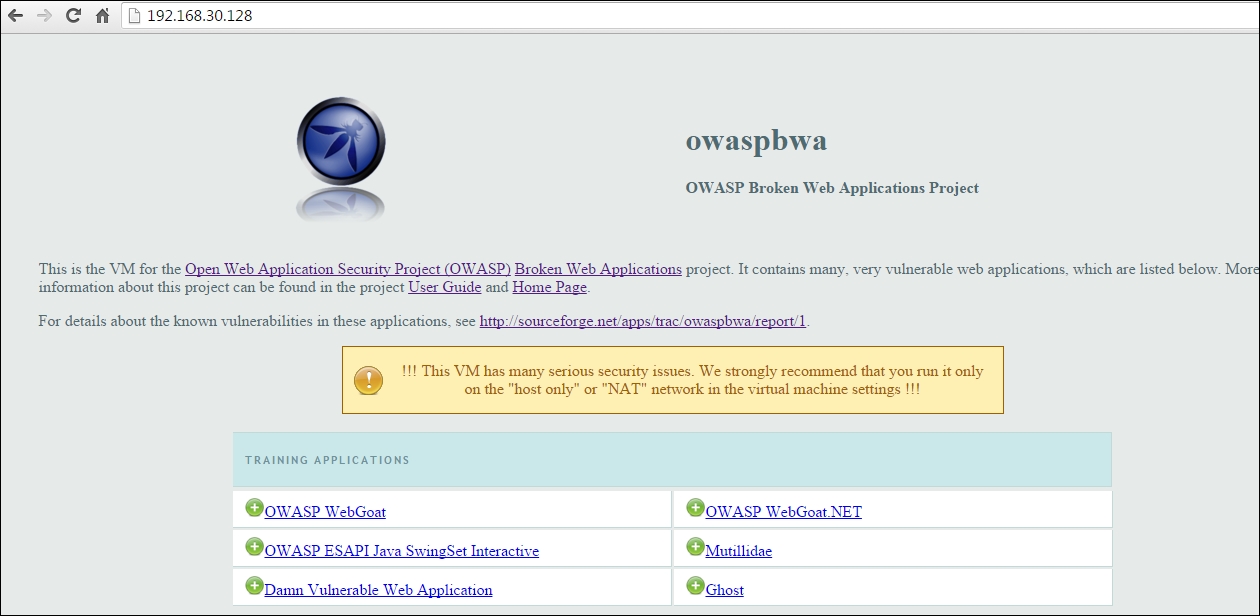
This testing has a number of different options. We can use a simple ping, or we can use the application layer and connect via the browser. For the purpose, here we will use the browser. At the time of writing this book, our OWASP machine was assigned the IP address of 192.168.20.128, so we open our browser to that IP address. An example of this is shown in the following screenshot:
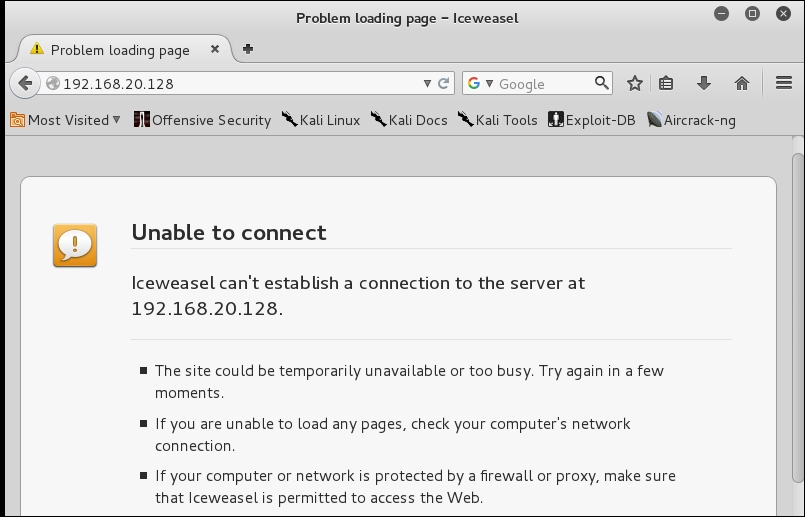
What happened? Why are we not able to connect? It is actually a quite common problem when you are building virtual environments, but before we reveal the reason, we will walk through a logical progression of steps. Next, we will attempt to ping it from the router. Select your Dynamips machine, and in the router window, enter the ping 192.168.20.128 -c 2 to verify that you can access the machine on the flat network. An example of this is shown in the following screenshot:

It is possible that your IP address will not be the same, and in such cases, you will use the IP address that is assigned. You will also notice in the screenshot that there is a packet that says DUP; this is from the router and the machine both responding to the packet, and again part of building virtual environments.
This shows we have the connectivity when it is flat, and we also know that we can ping the router external interface from our earlier test; so, what is the next step? We want to look at the path to the target. So, open a command prompt on your Kali machine and enter tracert 192.168.20.128.
An example of the output of this command is shown in the following screenshot:
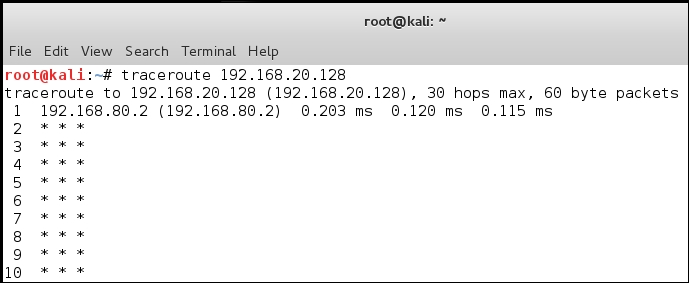
The key to the problem is that at the first hop, the gateway should be pointing to the router interface; however, it is currently pointing to the VMnet8 (NAT) host switch. This is very common when we build architectures; moreover, when we perform techniques such as pivoting we have to set the routing up so that we can access the target. We could change the default gateway, but this is the least attractive option as we use that to get the traffic out to the Internet from the NAT interface. Consequently, a better option is to manually add the route. This is required for all machines when we want to talk across networks. The syntax used to add the route will vary across the different operating systems. We will add the route in the host Windows machine first. Open an administrator command prompt, and in the command prompt, enter route add 192.168.20.0 netmask 255.255.255.0 192.168.80.20 metric 2, and then test it. An example is shown in the following screenshot:

Wait a minute! Why is it not working? This is part of the process of building environments; we like to say frustration is good because this is when you learn. Once you get stuck, take a step back and think about it and then try harder. In the previous image, we see that the traffic is going in the right direction, that is, toward the router interface; however, it does not report anything back after that hop. This is another common thing that you will have to keep in mind. We have added a route on the host, but we have not added the route on the target and this is required; we have to configure routes on both sides of the network session.
Select the broken web app VM, and log in to the machine. Once you have logged in, we will enter the command to add the route. You could enter man route and review the main page to determine the syntax required to add the route. Enter route add -net 192.168.80.0 netmask 255.255.255.0 dev eth0 and add the route to the machine. Return to your Kali machine and test the configuration.
An example after the test is shown in the following screenshot:

We now have the first layer of our defense baseline installed and more importantly, we have the network connectivity established and working. There is one concern with our configuration, and that is in the routing. We have not set the routing to survive a reboot. We have a number of options to do this, and we will not cover all of them. One option in Windows is to use a batch file with your route statements and then run it as required. There is another option in Windows that you can use and this is the -p option on the route command itself. This sets the route as a persistent route, and when you do this, it adds the route to the registry. The location of this route is inserted into the registry at the HKEY_LOCAL_MACHINESYSTEMCurrentControlSetServicesTcpip ParametersPersistentRoutes key. For our purposes, we do not need to make the routes persistent, but it is only an option and this is why we covered it.
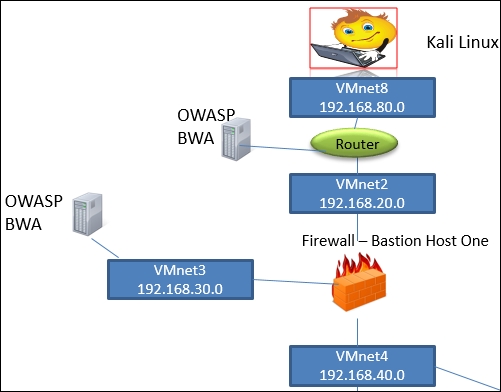
Next, we will configure our second layer; this requires us to connect a web server to the Orange or eth2 interface that we set up in Chapter 3, Planning a Range, on the Bastion Host. To further complete our second layer, we will have to add the routing once we connect the machine. An example of our second layer is shown in the following diagram:

As the screenshot shows, we have three switches, a firewall (Bastion Host One), and two web servers, one connected to VMnet3 and the Orange interface of Smoothwall, and the second web server connected to VMnet4, which is the Green interface in our Smoothwall configuration. As you might have guessed, for each of these machines, there will need to be a route to any network that they are not connected to, and there will also need to be a corresponding route in any machines trying to connect to these web servers not connected to the same switch, for example, the Kali machine.
We now have our machine set for the subnet; consequently, it is time to bring up all machines and test it! Once the machines start, you will test the connectivity; the easiest way is to test from the Bastion Host One virtual machine. For testing purposes, we will start up Kali, the router, Bastion Host One, and OWASP. We will note the IP address of our OWASP machines when they boot up. As we have set the VMnet3 and VMnet4 with a DHCP server, the address should be assigned automatically at boot; furthermore, the OWASP machine is set up to display the information about the virtual machines, as well as information on the IP address to connect to the machine. An example of this is shown in the next screenshot:

The next thing we want to do is to verify the access to the orange subnet from the attacker router. To do this, we need to test from the router to the web server. To accomplish this, we have to add a route in the router to our 192.168.30.0 subnet. As you may recall, we made the red interface of the Bastion Host virtual machine DHCP. This is one thing we might want to reconsider now that we have added another layer to our architecture. If you want, you can change the IP to static. For our purpose, we will just use the one that is assigned at the boot of the Bastion Host. To determine the IP address for this command, enter ifconfig eth0 in the Bastion Host and note the IP address on the interface. This will be the address that the external network will have to route to so it can continue into the machines within.
The IP address assigned on the eth0 interface is 192.168.20.XX; we will use this to add our route in the router. Switch to the router and enter show ip route in the router terminal window. The output of the command will show that we do not have a route to the 192.168.30.0 network; therefore, we have to add this so that we can access that subnet. In the router, enter conf t to enter the configuration mode. Once you are here, enter ip route 192.168.30.0 255.255.255.0 192.168.20.XX to add the route to the table. As you see from the command, we use the IP address from the eth0 interface to route traffic through. Once you have entered the command, return to the main prompt by entering
Ctrl
+
Z
. Enter ping 192.168.30.10 to ping the eth2 interface of the Bastion Host One. Next we will test connectivity to the web server machine. Enter ping 192.168.30.128; you will notice that this fails! Why is this? Well, you have to think about the architecture again. The Bastion Host One is serving as a firewall, and as we showed in Chapter 3, Planning a Range, the ingress filtering on the Smoothwall firewall is, by default, set to not allow anything inbound; therefore, we have to open the connection from the outside into the orange eth2 subnet.
We need to access the configuration of the Smoothwall firewall, and as you may recall from Chapter 3, Planning a Range, we can do this from a web browser. Open the web browser of your choice and access the configuration by entering https://192.168.40.10:441 to open the login page. Then, enter the username and password that you configured when you created the machine.
Once the configuration page comes up, navigate to Networking | incoming to open the configuration page for the incoming traffic. As you review the information that is available, you will notice that the capability to allow ICMP inbound is not an option; therefore, we can only allow UDP or TCP. Consequently, this is another reason why we like to use the Smoothwall firewall when we architect our ranges. We know that the OWASP BWA machine has a web server on it, so we will configure the firewall to allow access to the server.
We will configure the rule to meet the settings that are identified in the following screenshot:

We could make the rule more granular with specific IP blocks specified for the external source IP, but for our purpose, this will suffice; furthermore, you might want to make the IP address static in the web server to avoid the possibility of an IP address changing and then breaking our rule, but that is easy enough to do and it has been covered, so it will not be covered again here.
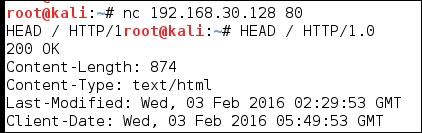
The next thing we will do is test our rule. We have already seen that we cannot access the machine from our router using a ping. So, we will now try to access the web server, which is the port 80 of the web server, as we have added it to our firewall rule set. In the router terminal window, enter telnet 192.168.30.128 80 and once the connection is completed, enter HEAD / http/1.0 and then press Enter twice. This will attempt to return the header from the home page from the web server and verify that you do have connectivity through the Bastion Host One to the web server. An example is shown in the following screenshot:
We now have to add a route and test it from our attacking machine; furthermore, we have to add a route in the Bastion Host back to the VMnet8 network. This is an area that is often overlooked. You have to maintain the routing of the network traffic for target ranges, as it is essential.
In the Kali and Bastion Host machines, add the route. In the Kali machine, enter route add 192.168.30.0 netmask 255.255.255.0 dev eth0 and enter route add 192.168.80.0 netmask 255.255.255.0 dev eth0 in the Bastion Host.
Once the routes are added, open a browser of your choice and connect to the web server located on the OWASP VM; alternatively, you can use the telnet method we used from the router. An example of what you should see is shown in the following screenshot:
Congratulations! You made it! We have built our external architecture! It takes some time to build it, but once it is built, we can perform any type of external testing that we may run into, and this is the power of virtualization.
You can create batch files as we discussed, and another way is to just keep the routing configurations in a text file and copy and paste them as required. Finally, if you really want to set the routing up on a more permanent basis, then you can set a cron job or place the route commands in the configuration file.
An example of our completed external architecture two layers of defense is shown in the following diagram:
We now have the first section of our two bastion host architecture completed; next, we want to complete the Bastion Host Two and corresponding segments. This two firewall architecture is very common across enterprise architectures today and that is why we are building it for our penetration testing range. It is recommended in most cases that you use a different vendor for the Bastion Host Two, but despite this being the best practice, and what should be done, the majority of sites continue to deploy the same vendor in the position of the Bastion Host Two. This is a good thing for us! We want the same vendor, then, when we get past the first one, it will be the same process to get past the second one.
An example of the next layer of our architecture is shown in the next screenshot:
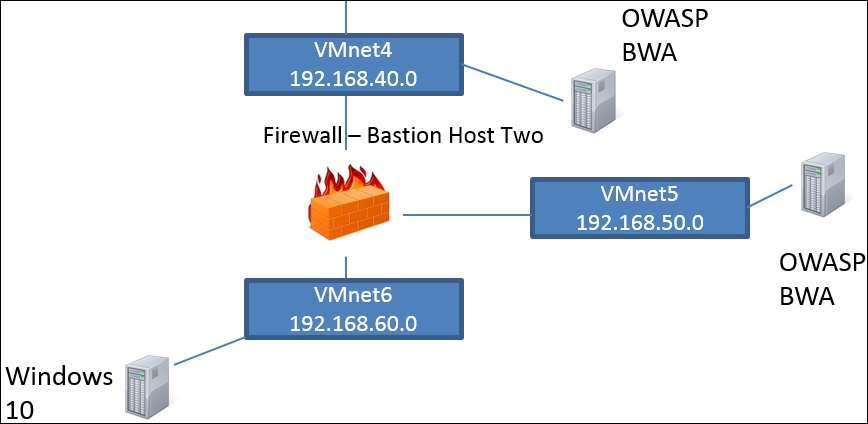
As the screenshot shows, we have three more interfaces on the Bastion Host Two, so it is the same concept as before; we have used the same web servers, since we have already built it we can easily clone and create another machine. In the actual development of the range, the servers you build will be dependent on what you discover during your research we have discussed throughout the book. Another thing to note here is that we have included a Windows 10 in the architecture; this VMnet6 switch is the connection point for our internal machines, and since the majority of the operating systems being used are Windows based, it is a good idea to include a Windows machine within your network.
The one challenge we do face is, what are we going to select for the Bastion Host Two? We could easily use a machine running iptables, but since we have mentioned the pfSense firewall, we will use it in the Bastion Host Two slot. You will need to download the ISO image; open a browser and go to http://www.pfsense.org. Download the version that matches your environment; once the software has downloaded, you will need to extract the ISO file from the compressed archive. Following this, we need to create a virtual machine. We will mount the ISO image and then do the installation.
In VMware Workstation, click on File | New Virtual Machine. When the New Virtual Machine Wizard opens, select the Installer disc image file (ISO) then browse to the location of the ISO image. An example of this is shown in the following screenshot:
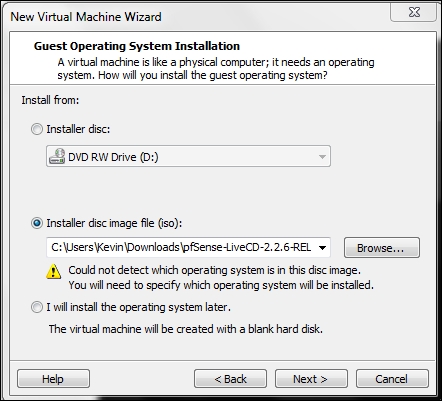
Once you have verified your settings, click on Next. In the Select a guest operating system, click on Other and select FreeBSD from the drop-down menu. Then click on Next. Enter a name of your choice, and click on Next. Accept the default settings for the disk image, and click Next.
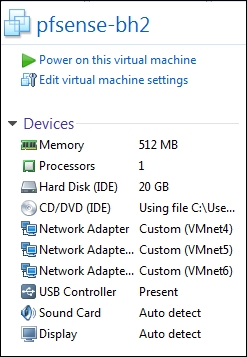
Before we create the virtual machine, we want to make some changes to the configuration, we want to increase the RAM to at least 512 MB, and create two additional network adapters, and connect all three as the diagram indicates above. An example of the completed configuration is shown in the following screenshot:
Once you have verified your settings, power on the virtual machine, and this will start the install wizard of pfSense. The system will boot to start the installation process. The first thing we want to do is install the software to the hard drive so we do not lose our configuration when we reboot. Enter option 99 to start the installation process; the first thing you will be prompted for is to configure the console, read the message and then accept the defaults. For an example of this, refer to the following screenshot:

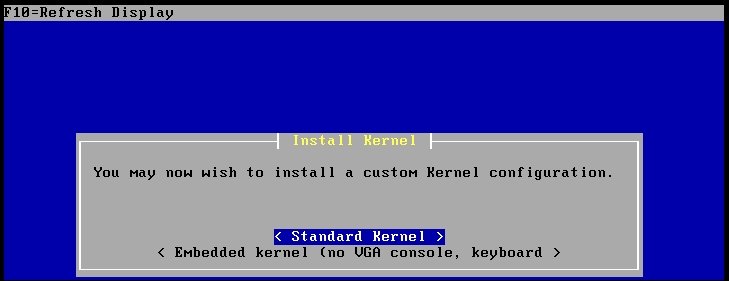
Press Enter to continue the installation. At the next screen, accept the default for the Quick/Easy Install and press Enter. Read the warning message, and since we are installing to a virtual hard disk, press Enter and let the installation begin. When the message comes up to install a custom kernel, ensure the default Standard Kernel is selected and press Enter, as shown in the following screenshot:
After the installation completes, you should see the Reboot message, as shown in the following screenshot:

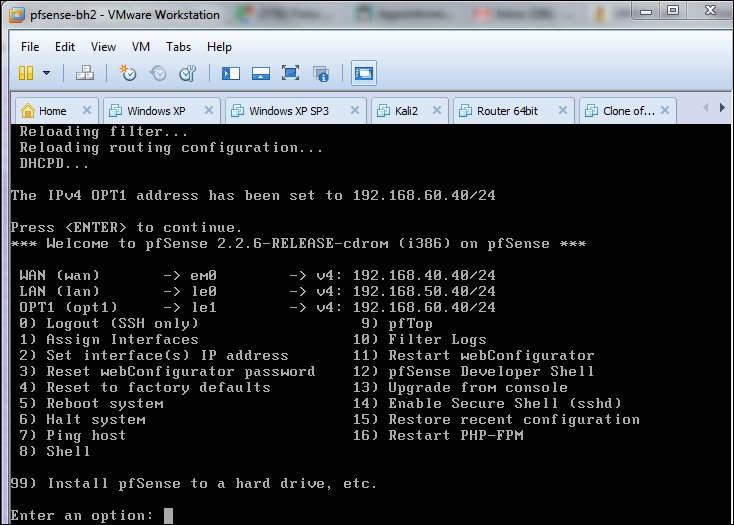
If all goes well, the machine will reboot and the main menu for the pfSense firewall will be displayed. An example of this is shown in the following screenshot:

As the previous screenshot shows, we do not have the correct addressing information for the network, we will correct this now. Enter option number 1.
When you get asked to setup VLANs, enter n. The installer will next ask you to enter the WAN interface name; in the example we are using in the book, we have three interfaces, named as follows:
- em0
- le0
- le1
Your interfaces might be named differently; in most cases the first interface is the WAN interface, so this is where, in our example, we will configure our network card with an address for the VMnet4 subnet. The three interfaces will be assigned as follows:
- WAN | em0 | VMnet4
- LAN | le0 | VMnet5
- Opt1 | le1 | VMnet6
From the main menu of pfSense, select option 2 to set the IP addresses of the interfaces.
Enter a WAN IP address of 192.168.40.40, for the LAN interfaces, and assign them the IP addresses as appropriate. For VMnet5, the address will be 192.168.50.40 and for VMnet6, assign the address 192.168.60.40. For each interface, do not configure the IPv6 addressing, and enter a default gateway for the WAN interface of 192.168.40.1. Also, for each netmask, enter the default for a class C of 24. When asked to default to HTTP for the web configurator, it is up to you if you want to say yes or no; if you say yes, then the configuration will be available from HTTP.
In a production environment we would not do this, but for our test range it is up to you. An example of the completed configuration to use as a reference is shown in the following screenshot:
Once you have verified your settings, you can ping the interfaces to test the networking if you want; however, you will not be able to ping from the opt1 interface. An example of the ping option 7 is shown in the following screenshot:

Now that the main addressing is set up, the rest of the configuration is easiest from the GUI, but before you do that, at the main menu, enter option 8, and this will open a shell. In the shell, enter ifconfig | more and verify your settings match those in the following screenshot:

Now that you have verified the settings, open a browser and enter http://192.168.50.40. This should bring up the login for the pfSense GUI. If you did not select the HTTP option when the configuration was being completed then you will have to enter HTTPS. An example of the login screen is shown in the following screenshot:

Enter a username of admin and a password of pfSense; the result of this should log you into the pfSense interface and launch the wizard. Read the message, and click on Next. This will bring up another message about subscribing. Read the information in the message and click Next. You should now be in the initial pfSense information page, and an example of this is shown in the following screenshot:
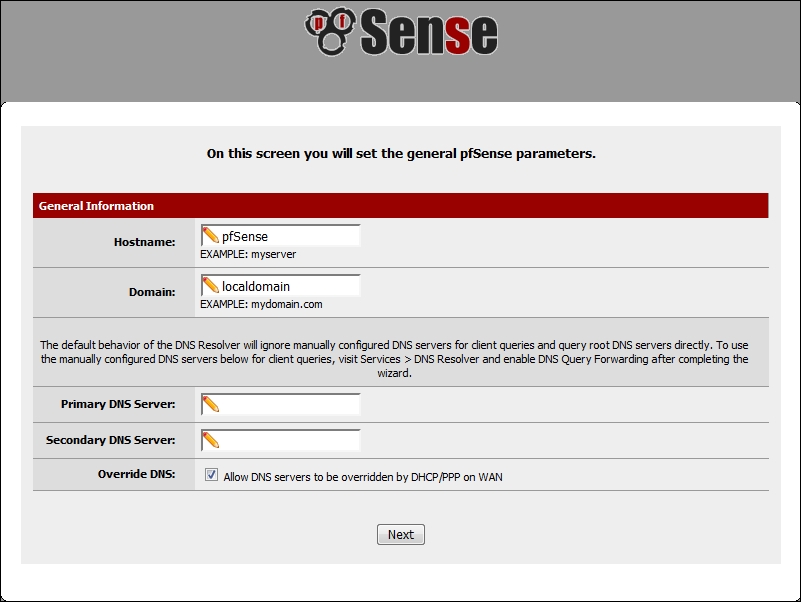
Once you have reviewed the information, click on Next. At the prompt to enter the time zone, select the appropriate time zone and click Next. At the next screen, you can review the information about the WAN interface; additionally, you have a number of things you can do, such as spoof the interface MAC. An example of this page is shown in the following screenshot:
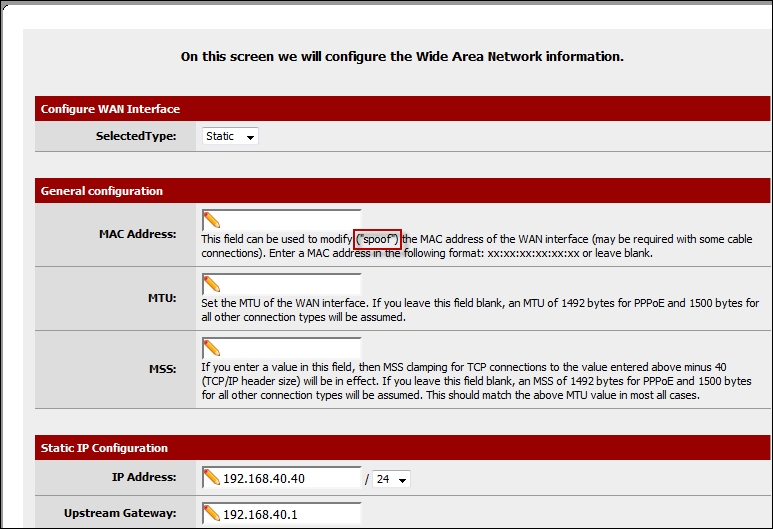
There is a great deal of information on this page; take a few minutes and review all of the different parameters you can set within pfSense. Once you have reviewed the information, click on Next. The next two screens will be for the configuration of the interfaces. Review the information and continue with the wizard when ready. After you have reviewed the information on the interfaces, you will see the screen to change the web configuration password from the default, and you should of course do this, and select a strong password for this, especially in a production environment; for our lab, the change of the password is optional. This is the last step of the wizard. Click on the Reload button to reload the configuration. When the message reports that the reload was successful, click on the link to runtime to the web configurator. An example of the dashboard for the web configurator is shown in the following screenshot:
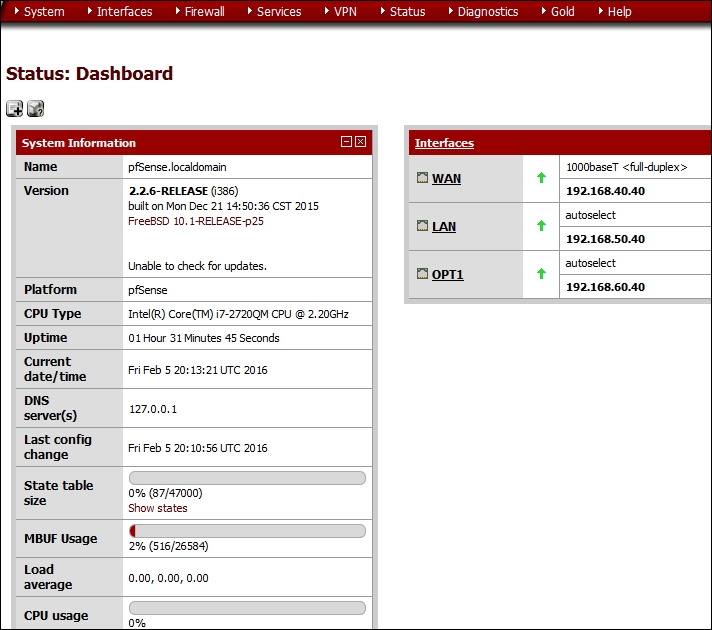
From here, it is a matter of reviewing the different menu options, and exploring the features of the pfSense firewall. We will explore a couple of these throughout the book, but to explore them all is beyond the scope. Having said that, you are encouraged to explore on your own. What we want to do now is create the machine to connect to our network. An example of the network diagram we are trying to create is shown in the following diagram:

As you may have noticed, the configuration is not much different than when we did the Smoothwall network; in fact, this is how the majority of networks are architected, so it makes it easier for us to design in our testing range; moreover, it makes planning the attack easier as well. Network designers are creatures of habit. As such, they share similar characteristics, and that makes it easier for us to plan an attack.
Before we get started creating the OWASP machine, and the corresponding rules for it, let's look at some of the options that we have in pfSense. Click on Services to display the options that we have there. An example of this is shown in the following screenshot:
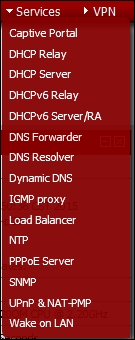
As the screenshot shows, there are a lot of options that we can experiment with in pfSense. For now, we will continue with the review of another feature; click on Diagnostics | Sockets. An example from the output of this is shown in the following screenshot:

We have explored enough for now, so let us turn our attention to creating a rule so we can access the OWASP machine like we did with the Smoothwall machine earlier; click on Firewall | Rules. This will open the rules configuration page. An example of this is shown in the following screenshot:

As the screenshot shows, the rules are represented by interface tabs, and just like the Smoothwall machine, there is nothing configured as open. We do have one problem though: by default, pfSense is blocking all RFC 1918 privatized addresses; since we are using these addresses in our architecture, we will have to disable this rule. The rule is there since in a production network, these addresses should not be received on the WAN interface. Click on the edit option, and when the window opens, remove the checkmark for the RFC 1918 addresses. An example of this is shown in the following screenshot:
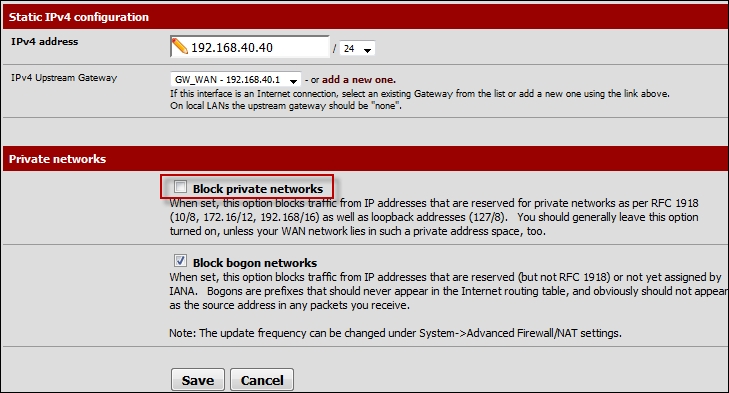
Once you have verified your settings, click on Save. Read the information message and click on Apply Changes.
Now that we have reviewed the default rules on the WAN interface, let's take a look at the LAN interface; click on Firewall | Rules | LAN. An example of the output from this is shown in the following screenshot:

As the previous screenshot shows, the pfSense firewall is not as restrictive as the Smoothwall machine was by default. As you look at the rules, you can see that the Source of LAN net can access any port; this is a common occurrence in these products, but with the proliferation of malware, this egress capability is too broad, but since we are hacking, we are okay with this!
The interface that is equivalent to the orange interface on Smoothwall is the OPT1 interface, so let us take a look at that now. Click on the OPT1 tab and open the default rules; an example of this is shown in the following screenshot:

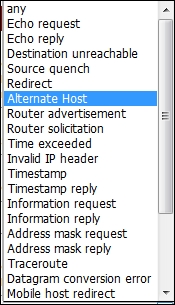
As we could have expected, there are no rules for traffic on this interface. Again, this is to be expected, because unlike the LAN interface, this interface is not trusted. We need to create a target to connect to the switch on this interface; we have a number of options for this, and it is important to note that this is the power of our network we have built. We can connect any machine that we want and carry out our testing. This will be based on what we have discovered during our research. For the example in this book, we will use the OWASP machine as our target. We can use the existing machine, or we can add another network card to it. Furthermore, we could clone a machine and connect it to the VMnet6 switch. Again, it does not matter how we do it, so we will leave that decision up to you the reader. Once the machine is connected to our switch, the next thing we have to do is create our rules for it. When you are creating a rule, you probably want to also create a rule for ICMP, so you can ping the machines for testing. This is one of the things that pfSense has a very good capability with and that is configuring what type of ICMP you want to allow.
An example of the different types that you can configure as a rule is shown in the following screenshot:
Let us get started and create our rules! Click on Firewall | Rules, then enter the information for the rules you want to create; we should probably create a rule for the following:
- HTTP
- HTTPS
- SSH
For the book, we are setting the source to any and the destination to the IP address to the one we configured on the machine. We will not repeat the steps here, since we have covered this a number of times. An example of the configuration is shown in the following screenshot:

The rules are now created. The next thing we want to do is test it; the best way to do this is to first test from the pfSense firewall then test from a machine such as Kali. To accomplish this, enter a ping then a telnet to the associated ports. An example of this is shown in the following screenshot:

Once we have established we have rules allowing the traffic, we next want to test through the firewall. To accomplish this, we have to set the route on the machine going through as well as the target machine. Once you have done this, you should be able to access the ports that are passed through the pfSense firewall. We have shown more than once how to create the routing, so we will not repeat the steps here.
An example of access to the OWASP machine through the pfSense firewall is shown in the following screenshot:

From this point forward you can create any type of machine that you need, so we have covered this to the level we need to for this chapter.
We now have the main components of our architecture built for the most part; therefore, it is time to discuss adding the monitoring capability to our testing range. There is one thing that is important to note: no matter what monitoring solution we select, we cannot predict how the site is going to configure it! This is the only thing we cannot overlook while testing. We can test and successfully evade the monitoring systems we have placed on the range, but as these systems are largely policy- and configuration-based, there is a chance that we will not experience the same success we did in the lab. In this section, we will discuss a sample of some of the types of monitoring system that are available and look at deploying one of them. We will discuss the concept further when we look at evasion later in the book.
When it comes to selecting an IDS for our architecture, there are a number of things we need to take into consideration, such as what product we want to set as our practice IDS. There are a number of products that are available, and this can become a daunting task, but as one of the most popular ones is Snort, we will concentrate on that. Another bonus of Snort is that it has a free as well as a commercial version.
We have a couple of choices when we deploy our Snort machine on the network, but before we address this, we need to discuss where we will deploy Snort sensors and how the traffic is going to get to the sensor in a virtual environment.
In an actual architecture, a switch is a unicast device that will only forward traffic to the port of the destination. Furthermore, the broadcast traffic is the only traffic that is sent on all ports. When it comes to deploying IDS network sensors, this can present a problem, and we have to either use a SPAN port or a tap. For more information and a comparison of these options, you can go to the following link:
Fortunately, we do not have this problem in a VMware switch. The switches are set so that we can see traffic across a switch, and this allows us to connect an IDS network sensor and not worry about configuring a SPAN port. To verify this, you can conduct a ping between two of your machines and run tcpdump on a third machine and check if you can see the traffic between the two other machines.
Once we have established that we can view the traffic across the switch, the next thing we want to discuss is the sensor placement. With network-based IDS, the normal configuration is to have a network sensor on each segment. Therefore, the only requirement is that all of the machines have to be connected to the same switch. Going forward, we will follow this approach when it comes to deploying and monitoring in our range.
Now that we have identified our sensor placement within our architecture, we will now discuss how we are going to achieve this in our virtual configuration. We could build another virtual machine to serve as IDS sensor, but then we could start to feel the strain of our existing RAM. Therefore, our preferred method is to have one machine and configure it with multiple network cards, and configure the Snort sensor on each existing card that is connected to the required switch.
Tip
To accomplish this, we need to build a machine to run Snort on. We could build one from scratch, but for the purposes of the book, we will look at other alternatives. However, building a machine from scratch is an interesting experience and it is left as homework for the reader. An excellent resource on how to do this for Snort, which also has guidance on a number of platforms, can be found at http://www.snort.org/docs. A note of caution about these study guides: they are not 100 percent accurate, and so your mileage may vary.
To create our Snort sensors, we are going to use a distribution that already has the Snort program installed and more importantly, all of the dependencies. The distribution we will use is the Network Security Toolkit. It contains 125 of the top security tools, and this is something that is worth adding to your architecture. What we like most about it is the ease of setting up Snort. You can download the ISO image from http://sourceforge.net/projects/nst/files/. Once you have downloaded the ISO image, you need to create a virtual machine. As we have covered this already, we will not do it again.
The thing you have to do is to mount the ISO image and boot it. Once the machine boots, you have the option to install it to the hard drive and it is recommended to do this, so you do not have to configure the settings again after a reboot. For our example here, the screenshots will be from the live image. We have shown a number of times the process to create virtual machines, so we will not repeat those here. Once you have created your virtual machine, we just need to configure the machine to connect to the switch that we want to monitor; an example of the diagram for this is shown in the following screenshot:

As the previous image shows, we are going to configure the Network Security Toolkit on the VMnet6 switch; this is to monitor the segment that we set up with the pfSense configuration earlier.
Once you boot the Network Security Toolkit, you will want to log in with the username and password you created, or if it is a live image boot, then your password is nst2003.
Once you have logged in, you will be at the main desktop; right-click on the desktop and select Open in a terminal. Enter su - to switch to root, enter ifconfig, and note the strange name that Fedora has assigned to your interface. We will need this when we configure the Snort sensor.
On the desktop, double-click the icon to set the NST system password; this is required to enable the services that we need to use. Enter a password of your choice; this should result in the services all starting and the password being updated. Once this has finished, click on the your favorite browser icon and start the browser. This will open the Web User Interface (WUI); you will be prompted to enter the username and password again. Click on Security | Intrusion Detection | Snort IDS.
Select the radio button for the interface and scroll down and click on the button Setup/Start Snort. As the message states, it will take some time for the sensor to start up; once it does, click on the Check Status.
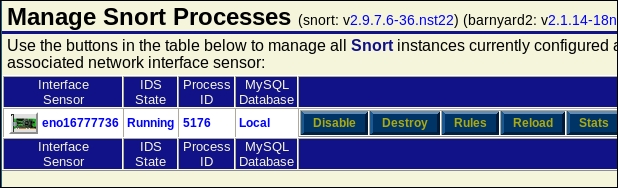
More than likely, you will have a Stopped condition on the sensor, so you have to go through the process again. Click on Enable; this is something that has been the case since the toolkit was released, so you have three clicks vice two to set up Snort. It is still one of the easiest ones to set up. After the second click on the Check Status button, you should have a running sensor; an example of this is shown in the following screenshot:
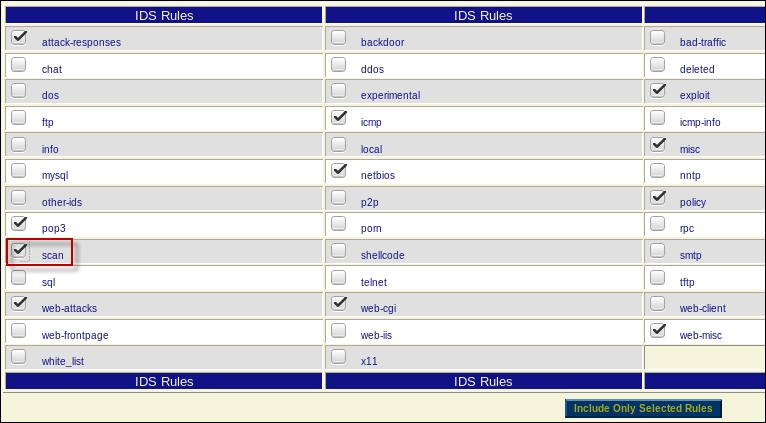
We will not go into the details of using the IDS here, because we will cover it in great detail when we show methods of evasion. For now, we want to at least look at a simple way to verify that your Snort installation is working. To the right of the sensor, there are a number of buttons; click on the Rules button for the interface eno. This will bring up the rules that you can configure on the interface; as you review the rules, you will see that this base installation does not have that many rules enabled; this is to help avoid false positives. It is common for sites to disable the scan rules, as it can result in a number of false positives and in actuality, scanning is such a common occurrence. We want to enable the scan rules for the interface by selecting it in the radio button. Once you have made the changes for the rules, you will be required to reload the interface. Click on Include Only Selected Rules. An example of this is shown in the following screenshot:
The next step is to reload the sensor to update the rules. Click on Manage Snort Processes to manage the Snort sensor, and click on the Reload button. We now need to put an IP address on your interface, so we can generate traffic on the network. This is just for our testing purposes; the best configuration is to not have an IP address on the interface of the sensor. Once you have entered an IP address, navigate to /var/nst/snort/logs. Once you are there, enter ls and notice that the interface has a directory for it, and this is where you will find the alerts of the sensor; but there is an easier way. Since you are in a terminal window, enter nmap -sX 192.168.60.40 -Pn. In the browser, scroll up to the top in the Snort window and click on BASE. You should see your scan alerts that the Snort sensor has reported; click on the percentage number and it will bring up the alerts. An example of this is shown in the following screenshot:

As you have seen, we have a very powerful network architecture that we have built; for now, we have done enough in this chapter. We will continue to expand on this and explore further in subsequent chapters.