
Whenever you find that your app is slow or choppy, chances are that something in your code is taking longer than it should. Especially if your memory usage appears to be within reasonable numbers. If your app uses less than 50MB, memory is not likely to be an issue for you so seeking the problem in your code makes a lot of sense.
To profile our code, we need to profile our app by either selecting Product | Profile in the toolbar or by pressing cmd + I. To figure out what our code is doing, we need to select the Time Profiler template. This template will measure how long certain blocks of code cumulatively run.
To record a profiling session of our app, make sure that a device is connected to your Mac and make sure that it's selected as the device that your app will run on by selecting your iOS device from the list of devices and simulators in the scheme toolbar menu. Launch Instruments, pick the Time Profiler template and hit record. Now use the app to navigate to a collection and begin scrolling until the app starts feeling choppy and scroll some more. After seeing the app stutter a couple of times, we should have enough data to start filtering out what's going on. Press the stop button to stop the session recording.
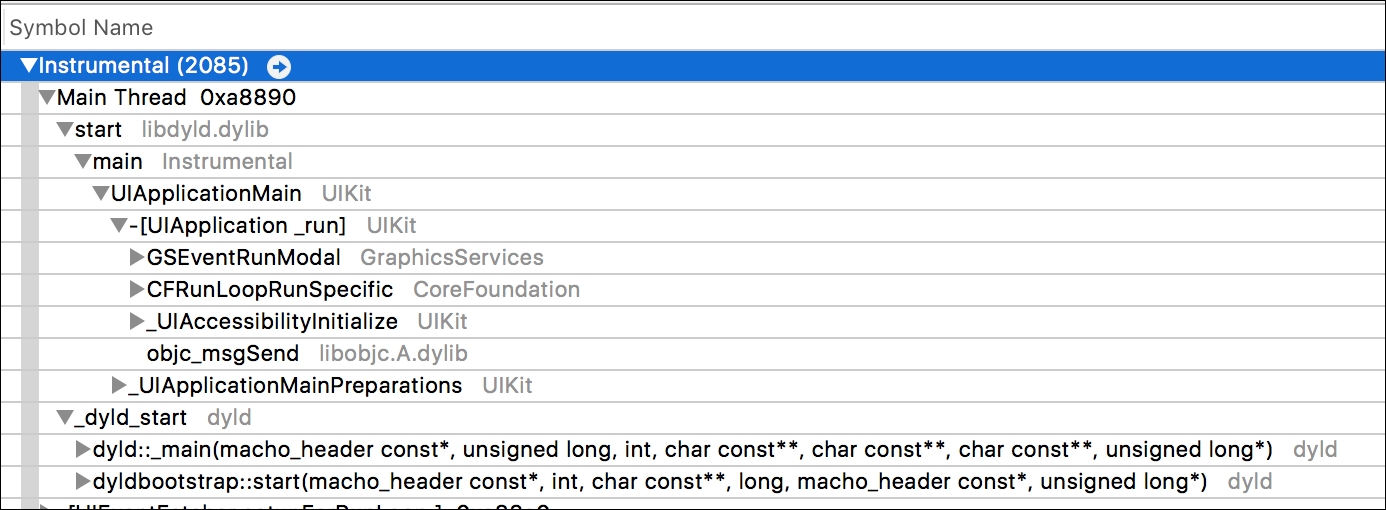
If you take a look at the data we've recorded, you'll notice a graph that has a bunch of peaks. This part of the timeline is marked CPU and if you hit cmd + a couple of times to zoom in on this timeline, you'll note that these spikes seem to last longer and longer as the scrolling becomes choppier and choppier. We must be on to something here, it looks like something is going on that makes these peaks last longer every time they occur.
In the bottom section of the window, you'll find an overview of the code in the app that has been executed. The code is separated by a thread and since we're seeing the user interface lagging, we can be pretty sure that something on the main thread is slow. If you drill down a couple of levels though, you won't find much useful information. It doesn't even look like most of the executed code is code that we wrote!
This is fine though. We should apply a couple of filtering options to clean up this list and it will soon become clear which part of our code is misbehaving.
If you select the display settings menu in the sidebar next to the detail area, you can invert the call tree and hide system libraries, in addition to separating code by thread.
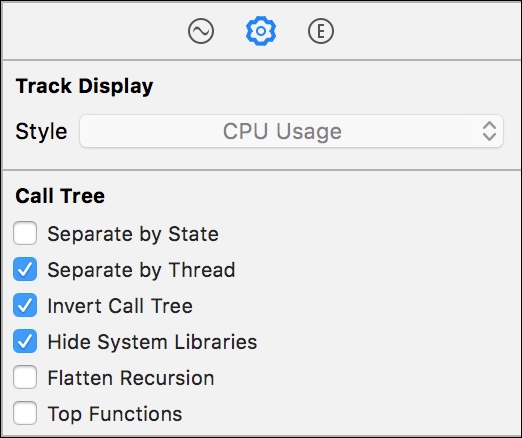
This means that we'll only see our own code and instead of drilling our way down from UIApplicationMain, we get to directly see the methods that have been tracked in our profiling session.
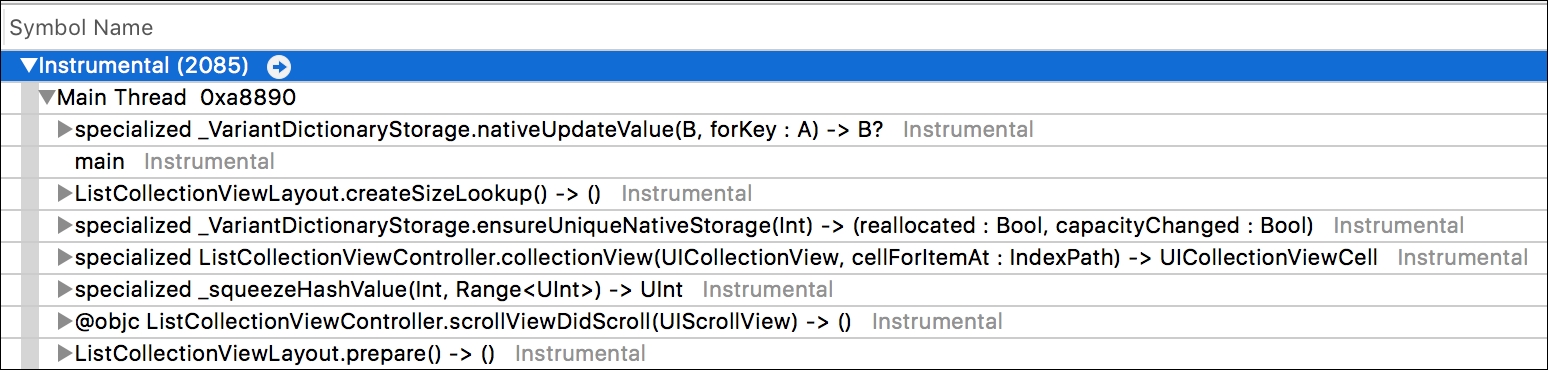
Upon examining this output, it's immediately clear that our issue is in the collection view layout. On the left side of the detail area, the percentage of time spent in a certain method is outlined and we can see that a huge percentage of time is spent in a method we don't know, nor did we write. It's got something to do with a dictionary but it's not entirely clear right away.
The first candidate that makes sense, because it's code that is actually written inside of the project, is ListCollectionViewLayout.createSizeLookup(). This method seems to be way too slow for our liking. Let's see if we can figure out why we're spending so much time in that specific method.
It's probably tempting to immediately point at the createSizeLookup() method and call it slow. It would be hard to blame you if you did, that method is a pretty rough one because we're actually computing an entire layout there. However, this layout is being computed pretty efficiently, unfortunately we can't really prove this with our current data in Instruments. If we could see the time each individual method call takes, we would be able to prove the claim that createSizeLookup() is not slow.
What we can prove, though, is that createSizeLookup() is called way more often than it should be called. If we add a print statement at the start of this method, you'll see that we get literally hundreds of prints as we scroll through the list. If we dig deeper and figure out when we call createSizeLookup, we'll find two places. In the prepare() method we call createSizeLookup and we call it again in rectForThumbAtIndex(_:). This is strange because rectForThumbAtIndex(_:) is called in a loop inside of the prepare method, after we've already generate the size lookup.
More importantly, as the number of items in our collection grows, the number of items we look over grows too. It's starting to look like we've found our bug. We should be able to safely remove the call to createSizeLookup() from rectForThumbAtIndex(_:) because the lookup is created before we loop over the items, so it's safe to assume that the lookup exists whenever we call rectForThumbsAtIndex(_:). Go ahead and remove the call to createSizeLookup() and run your app on the device. Much smoother now, right?
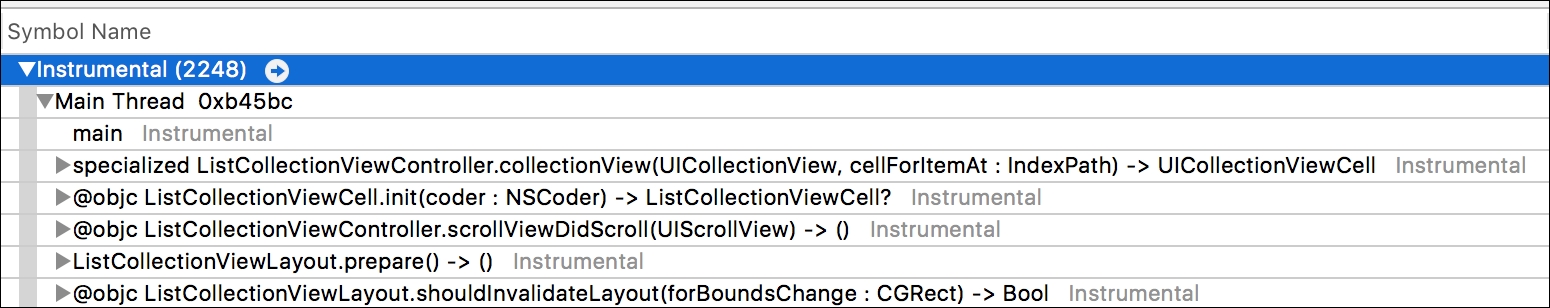
To make sure that everything is fixed, we should use Instruments again to see what our Time Profiler report looks like now. Start a new Time Profiler session in Instruments and repeat the steps you did before. Navigate to a collection and scroll down for a while so we load lots of new pages.
Looking at the result of our tests now, the percentage of time spent in createSizeLookup() has dramatically decreased. It has decreased so much even that it's not even visible as one of the heaviest methods anymore. Our app performs way better now and we have the measurements to back it up with.
Now that we've improved the visible performance of the app, we can navigate through it and everything is working smoothly, but looking at the memory usage in Instruments we can still see the memory usage rising constantly. This means that our app might have another problem in the form of a memory leak. Let's see how we can discover and fix this leak with Instruments.