
A proper understanding of the tools available to you will greatly benefit you and your apps. One of the tools that you'll want to learn sooner or later is the Instruments tool. The Instruments tool is really a collection of tools that help you profile and analyze your app in order to debug complex problems you might encounter in your apps. For example, Instruments can help you figure out if your app is suffering from memory leaks. Tracking a memory leak blindly is tedious and nearly impossible. A good tool like Instruments will help you track down several possible causes for a memory leak, saving you both time and your sanity.
In this chapter, we're going to look at an app called Instrumental. This app is a very plain app and it's not even close to feature complete but we're already encountering issues. The app is very slow in general and the longer it's used and the more the user interacts with the app, the worse the problems seem to become.
We're going to use Instruments to measure and analyze this app so we can make improvements where needed and, hopefully, we'll end up with an app that works great and smooth so the app has a solid foundation to build new features on.
This chapter is divided into the following sections:
- Exploring the Instruments suite
- Discovering slow code
- Closing memory leaks
By the end of this chapter you'll be able to deeply analyze your apps to find potential issues and solve them before they really become a problem. Let's get going, shall we?
In this book's git repository, you'll find a project called Instrumental. This app is very much an app that's in the early stages of development so there are plenty of loose ends, sub optimal implementations, and strange placeholders.
Regardless of its early stage, the app should work okay, especially performance-wise. This isn't really the case though so we're going to have to explore the app a bit, figure out what the problem could be, and finally fire up Instruments to see what we find.
If you dig through the source code, you'll immediately see that the app has three main screens. A table view, a collection view, and a detail view. The table displays a list of 50 items, each of them links to an infinitely scrolling collection view with a custom layout. The layout had to be custom because we needed to have exactly one pixel of spacing between items and this behavior had to be captured in a reusable layout that can be used in other collections or apps. Finally, the detail page just shows an image and a label on top of the image.
Based on our knowledge from earlier chapters, we should know that an app like this should be able to run smoothly on virtually any iOS device. Collection views and table views are optimized to display huge data sets so an endless scrolling collection view that keeps adding fifty new rows whenever we almost reach the end of the list should not pose too much of a problem. In other words, this app should be able to run at 60 frames per second with no trouble at all.
However, if you start scrolling through the collection view, move back and forth between screens, and then scroll more and more, you'll find that some collections will stop scrolling smoothly. They will randomly freeze for a little while and then continue scrolling. And the more we scroll through the collections, the bigger this issue seems to become.
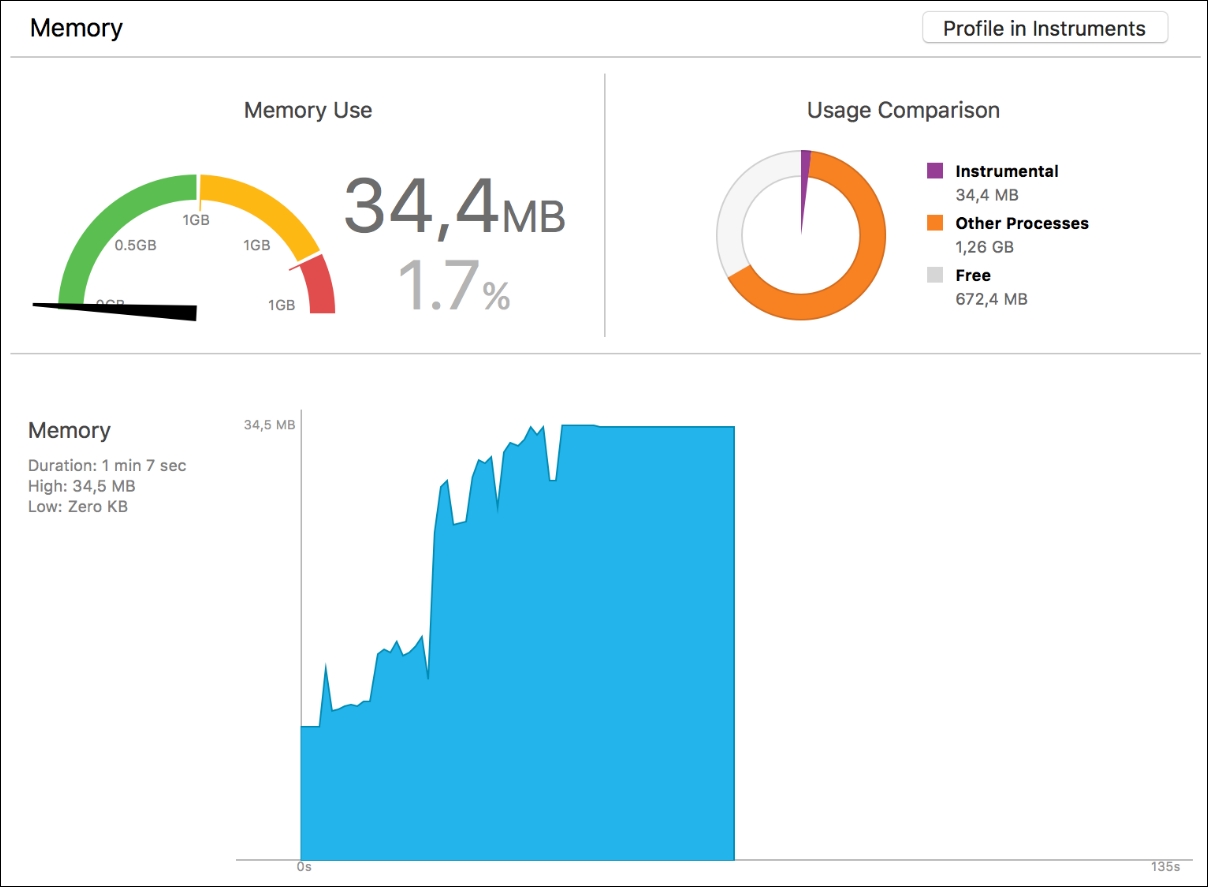
When we look at the memory usage in Xcode's Debug navigator (6th icon in the left sidebar), we can tell that something is amiss because memory usage just keeps on going up when we navigate through screens. This in itself is nothing to worry about, temporary memory spikes are normal. When the used memory never gets freed even though you might have expected it too, that's when you should start worrying.
Note
Whenever you're debugging performance issues or if you're trying to measure performance, make sure to measure on a real device. If you measure using the simulator, your app might run fine even though it might not run fine on a device. This is due to the way the simulator works. It mimics an iOS device but it's backed up by all the power your Mac has to offer. So, the processor and available memory are those of your Mac, resulting in performance that's often much better than it would be on a device.
For now, we'll make a mental note of our app's rising memory usage and shift our attention towards Instruments itself. To profile your app with Instruments, you can either select Product -> Profile from the toolbar or hit cmd + I on your keyboard. Xcode will then build your project and launch Instruments so we can select a profiling template.

There are many available templates and most of them are pretty specific. For instance, the Network template will measure network usage. This isn't very relevant if you're not trying to debug networking issues. There are also templates available to profile animations, database operations, or even layout or hard core Metal graphics performance.
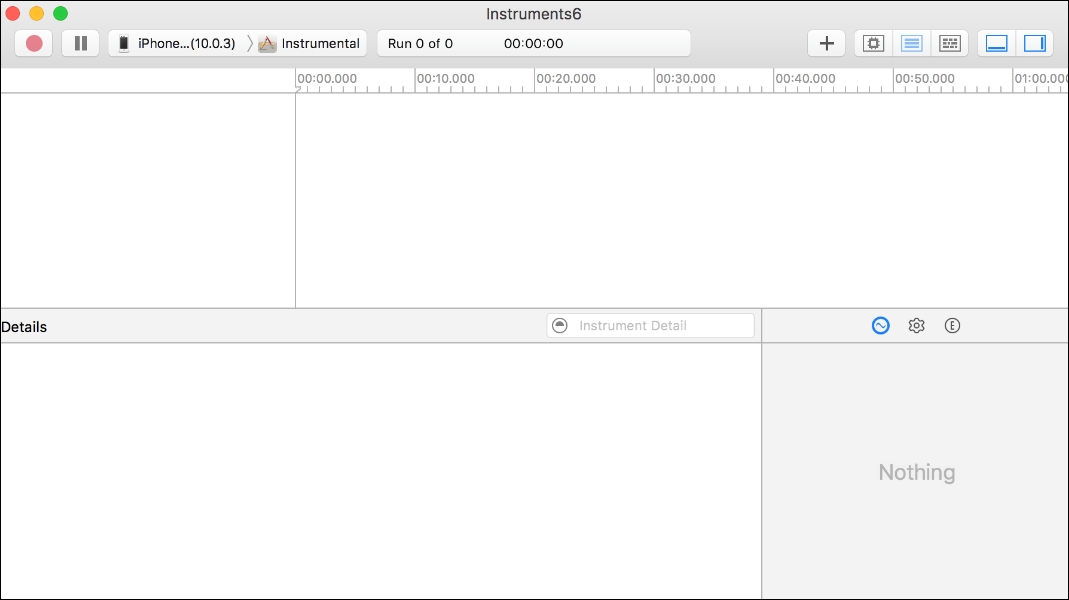
If you select a blank template, we're presented with the Instruments interface. The interface features a record button that we can use to start or stop profiling for our app. If you look further to the right side of the top toolbar, there's a plus icon. You can use this icon to add profiling for certain metrics yourself. You could use this to create a profiling suite that fits your needs without having to switch between the default templates all the time.
The center of the Instruments interface is the timeline. This is where graphs are drawn, depicting the measurements that were made for your app. The bottom section of the screen shows detail about the currently selected metric as we'll see soon:
Now that we've explored the Instrumental app a little bit and we've looked at Instruments, let's make a first attempt at profiling our app. The most annoying issue we have is the choppy scrolling. We know that we have a memory issue but choppy scrolling occurs even if Xcode tells us that we're using 30MB of memory, we know that the device is not nearly out of memory if we're using 30MB so let's see if we can figure out what's going on by profiling our app code first.