
Usually, if you navigate around your app, it's normal to see memory usage spike a little. More view controllers on a navigation controller's stack means that more memory will be consumed by your app. This makes sense. When you navigate back, popping the current view controller off the navigation controller's stack, you would expect the view controller to be deallocated and the memory to be freed up.
The scenario above is exactly how our app should work. It's okay if we use some more memory if we're deeper in the navigation stack, but we expect the memory to be freed back up after we've hit the back button.
In the Instrumental app, the memory just keeps growing. It doesn't really matter if you drill deep into the navigation stack, hit back or scroll a lot, once memory has been allocated it never seems to be deallocated. This is a problem and we can use Instruments to dig into our app to look for the issue. Before we do this though, let's have a deeper look at memory leaks, how they occur and what the common causes are.
When your app contains a memory leak, it means that it's using more memory than it should. More specifically, the app fails to release memory that is no longer needed. We can essentially differentiate between different scenarios where this could occur. Once you're aware of them, they should be rather easy to spot. If you haven't seen them before or have never even heard of them, it's easy to fall into the trap of having a memory leak in your app.
The first type of memory leak we can identify is one where an object is allowed to take up an infinite amount of memory without any restrictions. A common example for this is caching data. When you implement a cache that holds on to certain model objects, API responses, or other data that was expensive to obtain in the first place, it's easy to overlook the fact that you essentially just built yourself a memory leak.
If your user is using your app and your cache object just keeps on caching more and more data, the device will eventually run out of memory. This is a problem because if we don't free the memory in time, your app will be terminated by iOS to make sure that essential processes and other apps don't suffer because of your app's out of control memory usage.
Luckily, it's easy to solve issues like these. The operating system will notify your app through the NotificationCenter whenever it needs you to free up memory. Listening to this notification and purging any cached data you can recreate or reload will prevent your app from hogging memory and ultimately it prevents your app from being terminated for memory reasons.
A very simple example of an image cache class that purges its cache when memory is tight is shown in the following code:
class ImageCache: NSObject {
    var cache = [UIImage]()

    override init() {
        super.init()

        NotificationCenter.default.addObserver(self, selector: #selector(purgeCache), name: .UIApplicationDidReceiveMemoryWarning, object: nil)
    }

    deinit {
        NotificationCenter.default.removeObserver(self, name: .UIApplicationDidReceiveMemoryWarning, object: nil)
    }

    func purgeCache() {
        cache.removeAll()
    }
}
All you need to do is listen for the .UIApplicationDidReceiveMemoryWarning notification and purge any data that you can recreate when needed. Always make sure to unsubscribe from the notification when your class is deinitialized. If you don't do this correctly, chances are that you'll create a reference cycle, which is coincidentally the next type of memory leak that we'll discuss.
When your objects contain references to other objects, you should always be careful to avoid situations where both objects continuously hold a reference to each other. For example, a relationship between a table view and its delegate or data source could become a reference cycle if the relationship isn't managed properly. Objects can only be deallocated and the memory they use can only be freed if there are no objects referencing them anymore.
Another situation where a reference cycle could be created is in a closure. When you implicitly reference self in a closure, the complier complains that you must explicitly refer to self. Doing this creates a reference to self inside of the closure, potentially resulting in a reference cycle. Throughout this book, you've seen a bunch of closures and we always used a capture list when we referred to self inside of the closure:
api.fetchData { [weak self] in
    self?.tableView.reloadData()
}
The preceding example shows an example of using a capture list, it's the part right before the in keyword. The list captures a weak reference to self which means that we don't create a reference cycle between the closure and self. If our api object somehow stores the closure in a variable and we haven't used a weak reference to self, we potentially have a reference cycle on our hands. Especially if the api object itself is held onto by another object, we can be sure that a reference cycle is created.
Making the reference weak tells our app that the reference to self does not add up to the reference count of self. This means that if there are only weak references left to an object, it's okay to deallocate it and free the memory.
Memory management and more specifically reference counts aren't a simple subject. One way to think about this subject is that your app has an internal count of the number of objects that point to another object. For instance, if you create an instance of a UIView inside of a UIViewController, the reference count for the UIView is one. When the UIViewController is deallocated, the reference count for the UIView is zero. Meaning that it can be deallocated safely.
If the UIView has a reference to the UIViewController as well, both objects will keep each other around because the reference count for each instance won't ever reach zero. This is called a reference cycle. This cycle can be resolved by making at least one of the references involved a weak reference. Since weak references don't contribute to the reference count, they prevent reference cycles from happening.
An alternative to making a reference weak is marking it as unowned. Where weak is essentially a safe optional value, unowned makes the object implicitly unwrapped. It's often best to take the safe route and mark a captured reference as weak because your app won't crash if the weak referenced instance has been deallocated somehow.
Reference cycles aren't easy to grasp, especially if you consider weak references and reference counting, it's really easy to find yourself confused and frustrated. Luckily, the Instrumental app contains a couple of issues with references and retain cycles so we can try and understand them better by discovering them in our app.
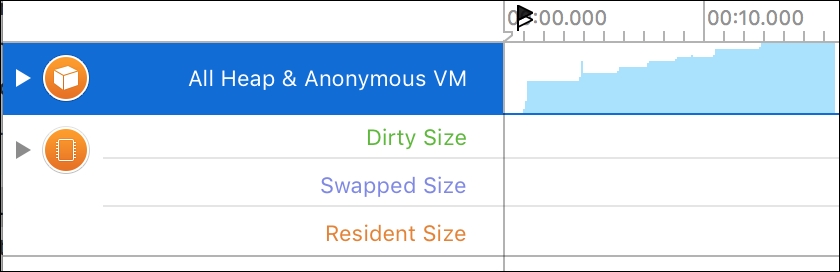
To figure out why the memory usage of our app is increasing every time we visit new screens in our app, we're going to profile our app using the Allocations template. When you've started a new Allocations profiling session, navigate through the app and you'll see the memory usage graph rise consistently. This behavior is typical for a memory leak so it's time to dig in deeper to figure out exactly what we're doing to cause this to happen.
If you look at the Detail area in Instruments, there is a lot of information that does not make a lot of sense. A lot of the objects that are created are not objects created or managed by us, which makes it really hard to figure out what's causing our problem. It's not very likely to be an issue with UIKit for instance, and even if it is, we can't really fix that. Luckily, you can use the search dialog in the top right corner of the Detail area to look for objects that do belong to us, giving us insight into what's happening with the objects we create.
If you look for the word Instrumental, you'll find a couple of objects and they should all look familiar to you. In the Detail area, you can now see the number of instances of a certain object that are in memory.

If you look closely, you'll find that there are way more collection view cells, collection view controllers, and collection view layouts present than we'd expect. We can only show one collection view at a time and when we navigate back to the list view controller, we expect the collection view controller to be deallocated since nothing should be referencing it anymore.
When we segue to one of the collection view controllers, it's added to the viewControllers array on the navigation controller. This means that the navigation controller is keeping a reference to the view controller, which means that it should not be deallocated; the reference count for the view controller is 1 at this point.
When we pop back to the list view controller, the navigation controller removes the collection view controller from its viewControllers array. The result of this is that the reference count for the collection view controller is now decremented since the navigation controller is not referencing it anymore. This puts the reference count at 0, meaning that the collection view controller should be deallocated and the memory should be freed up.
However, something is preventing this from happening, because the collection view controller remains allocated according to our observations in Instruments. Unfortunately, Instruments does not tell us much more than we just saw. Objects are sticking around for too long, which means that we've created a retain cycle somehow. This probably means that something is referencing the collection view controller and the collection view controller is referencing something else in turn.
To figure out what's going on, we should probably start looking in our collection view controller. The collection view controller has a delegate relationship with an object conforming to ListCollectionDelegate. It also acts as a delegate for the list collection view cells it displays and it's also a delegate for the detail view. All the delegate relationships are references to other objects. These delegates could very well be the source of our trouble.
Prior to Xcode 8, these issues would be pretty difficult to debug, but in Xcode 8 we can actually visualize all the objects in memory and see how they relate to each other. This means that we can capture our memory once we've seen a couple of collections and we can actually see which objects are holding references to other objects. This enables us to visually look for reference cycles instead of blindly guessing.
To visualize your app's memory usage, build and run the app and navigate to a couple of screens. Then open the memory view in the Debug navigator and finally click the Debug Memory Graph button in the bottom toolbar of the screen:

After clicking this button, Xcode will show you a visual representation of all memory that your app is using. In the tool bar on the left side of the screen, look for the list collection view cell and click it. Xcode will show you the relationship between the collection view cell and other objects. At first glance, nothing special is happening. We have a list view controller, which holds a reference to a collection view, then we have a couple of other objects and finally there's our collection view cell:

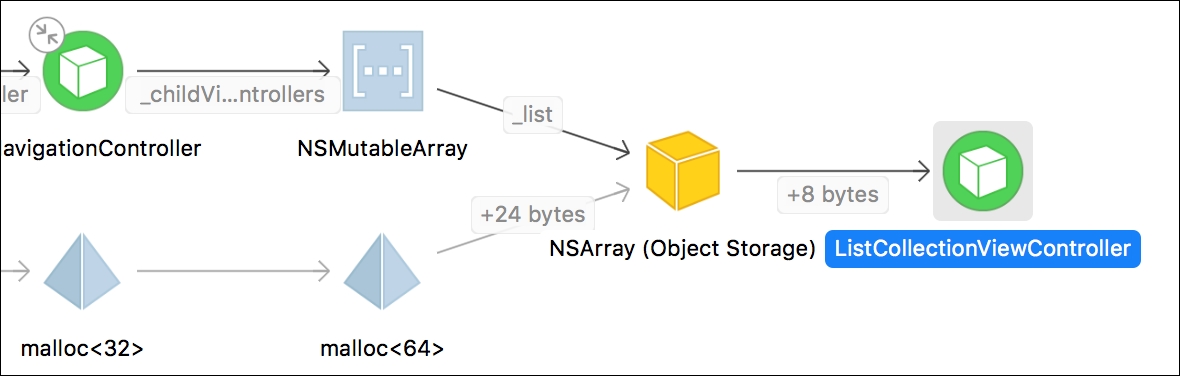
Next, click on the collection view controller. When you click this, a couple of different views could be shown to you. One shows that there's a navigation controller that points to an array which eventually points to the collection view controller. This is the graph you would expect to see, it's exactly the relationship between navigation controllers and view controllers that we've discussed before.
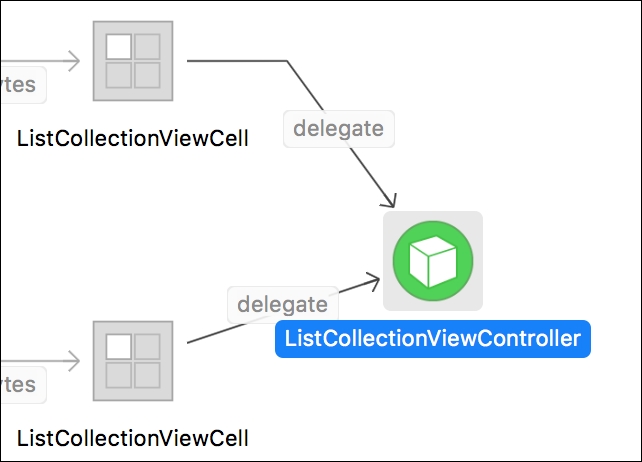
The other situations you might see are not like this at all. They show collection view cells that directly point to the collection view controller. If you compare this to what you've seen before, there is no way to make sense of it. The first collection view controller we looked at is the one that's currently displayed. That's why the navigation controller is there. The second one, however, is not tied to a navigation controller. It's not currently displayed and it seems that the only reason for it to stick around is the collection view cells pointing to it.
This is pretty typical for a reference cycle. Objects that should be long gone stick around because somewhere, somehow they are keeping references to each other. Now that we suspect that the delegate relationship between the collection view controller and the collection view cells is causing our problems, we can begin fixing them.
In this case, the fix is pretty simple. We need to make the delegate relationship between the cell and the controller weak. Do this by opening ListCollectionViewCell.swift and changing the delegate declaration as shown here:
weak var delegate: CollectionItemDelegate?
Marking the delegate as weak breaks the reference cycle because the references aren't strong anymore. This essentially tells our app that it's okay if the referenced object is deallocated. One final adjustment we must make is to limit the CollectionItemDelegate to class instances only. Due to the nature of value types like structs, we can't mark references to them as weak. And since a protocol can be adopted by both value and reference types, we must constrain the protocol to class instances only. Update the declaration for the CollectionItemDelegate protocol as shown here:
protocol CollectionItemDelegate: class
If you run the app now, you can safely navigate around and both the memory debugger and Instruments will prove that you no longer have any reference cycles in your app. It's possible that Instruments still tells you that your memory usage is growing. Don't worry about this too much, you did your job in making sure that your code is safe and that all the memory that you don't use anymore can be freed up.
The example of a reference cycle you just looked at is a very common one. A common way to avoid reference cycles through delegate is to try and make all of your delegates weak by default. This prevents you from making mistakes that you might not catch right away and it's often the safest route to go. Do note that there are many ways in which a reference cycle can occur and you should always use the appropriate tools to try and troubleshoot your memory issues.