The easiest way to view the data published by the device is by using boards and cards. If you keep the device script running when creating the card, it will get the values from the data structure published by the device.
- To create a card, access the IBM Watson IoT Platform console and select boards in the left menu:

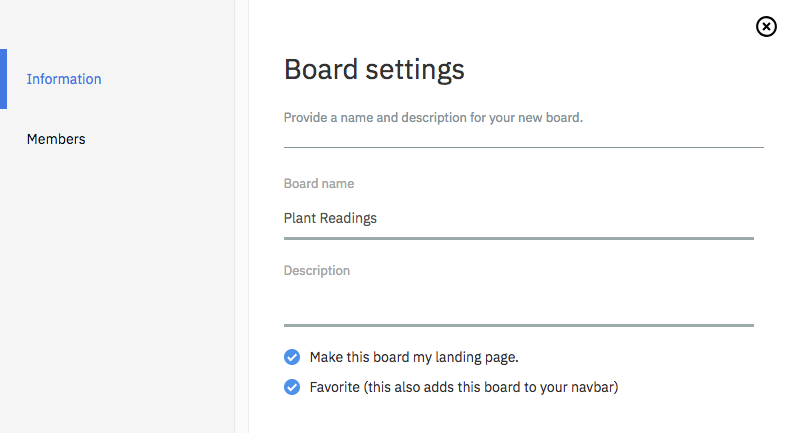
- At the top right of the page, select + Create New Board, complete the information required, and create the board. Most information that must be provided is miscellaneous, but make sure it is meaningful to the target user. The board created here is supposed to display the plants monitored readings:


A board is a set of related cards, and a card is a set of related values that were published by devices to the platform.
- Select the created board and create the card by selecting + Add New Card.
- Select the Line chart device visualization and the device created:

- After selecting Line chart card, you need to select a data source for the event. Select the device created as the data source for this card. The data source, as the name says, is the source of information that will be used to populate the chart with metrics collected from devices:

- After selecting the data source, it's necessary to select the metrics that will be plotted on the chart. If the device has already published some events to the IBM Watson IoT Platform, the metric names will be available to be selected. On the other hand, if the device code has never been run before, you will need to provide the metric names. It's recommended (not required) that you at least test the device code to avoid mistakes before creating the chart.
- In the solution that is being developed, we want the card to have both metrics plotted in the line chart and tracked. Add each metric with its corresponding unit and maximum and minimum possible values. For the soil moisture, we use percentage, so Unit should be % for the minimum and maximum values 0 and 100 respectively:

- For temperature, measured in degrees Celsius (°C), the minimum and maximum possible values are 0 and 100:

- Select the size of the card you prefer to display, name the card, and create it. You will now be able to visualize the published data:

It's possible to verify the measurements sent by the plant device, plotted in the timeline. It's also possible to change the time frame for the chart.
