
Testing the strength and stiffness of polymer matrix composites
Abstract:
The directional nature of fibre reinforced polymer matrix composites makes them a more formidable proposition than do isotropic materials such as metals and plastics when attempting to measure their true mechanical properties. It can be extremely difficult to ensure that a pure and uniform stress state is imposed on a significant volume of the material in order to extract the desired property data. If that is to be achieved, great care is required in the design of specimens and loading arrangements. Whatever the idealised designs for specimen and loading jig turn out to be, they still need to be transferred into reality, which means that equal care is required in creating both. Assuming this can be done satisfactorily, there are test method standards available that define how the test should be carried out. Some are better than others in achieving what they set out to do. This chapter attempts to guide the test practitioner through what can be something of a minefield.
6.1 Introduction
Fibre reinforced polymer matrix composites pose very real problems to the test method designer who aims to measure the ‘real’ mechanical property of the particular material in hand. So, what makes these composite materials such difficult subjects? Let us first consider what they are not. Generally speaking, in their basic form, they are not isotropic, nor are they homogeneous. This basically means that, unlike metals and plastics, composites do not have the same properties in all directions, nor from place to place. This is true not only on the micro-scale but, in many instances, also on the macro-scale, which opens up a wide range of implications for the design of structures from these materials, from the most simple element to more complex jointed arrangements.
The structural engineer ideally needs to know the full range of physical, chemical and mechanical properties of materials under consideration, but the basic mechanical properties required are the elastic moduli (often termed stiffnesses) and strengths in tension, compression and shear, together with the associated Poisson’s ratios. Where transverse isotropy can be assumed, it is only necessary to measure in-plane properties. In other circumstances, out-of-plane, biaxial or triaxial tests may be required. The mechanical properties are all defined using the usual mechanics of materials relationships and are generally determined by the testing of coupons. Tests are normally carried out in conjunction with a jig designed to impose a pure and uniform form of the stress state under study to a significant volume of the material. The coupons themselves need to be designed to take account of the specific fibrous and possibly laminated nature of the material. The value of any particular property determined is dependent on the coupon test arrangement relative to the fibre orientation(s) and the fibre volume fraction within the coupon.
So, where should one seek advice in order to get started? Fortunately there is now a fairly comprehensive standards capability worldwide. Most industrialised countries have their own standards institutions (ASTM, BSI, DIN, JIS, etc.), and over the past 30 years or so these organisations have invested a great deal of effort in addressing the specific test method standardisation needs of high performance fibre reinforced plastics. Somewhat more recently the International Standards Organisation (ISO) has attempted to distil the best practices from the national standards into their own specifications. Standards are essential reading but can often be pretty dry. It must also be emphasised that such standards are intended to standardise a test method so that, if it is followed, it should be possible to repeat the test in another laboratory, in another location, using different equipment, with a different operator with the expectation of obtaining very similar results. This is not, however, the same as achieving the desired or correct result.
Many companies have developed their own standard test methods, some of which have fed into new, or modified national and international standards. In addition, work in universities and other research organisations is undertaken into test method development. The results are normally published in technical reports, PhD theses, and/or academic journals, and often address cutting-edge aspects well ahead of standardisation, which, by its nature is a fairly unwieldy and time consuming system.
6.2 Key issues
6.2.1 Specimen preparation
Specimen preparation is not simply a key issue, it is a crucial issue and cannot be overstressed. Without due attention to specimen preparation details, any testing programme is potentially destined to abject failure.
The points relating to specimen preparation for a unidirectional (UD) laminate apply equally well to other composite material formats. The first problem is identifying the correct and precise fibre direction(s). Even in a fully UD panel, if the panel edge cannot be trusted to reflect fibre direction and there is no alternative and reliable means of locating a fibre direction datum, such as tracer fibres, there is little hope of machining specimens containing the correct fibre direction from the panel. With quasi-isotropic panels the position is probably more difficult. If it is possible to identify an initial datum cut from a panel with some accuracy, it is necessary to maintain that datum when machining the actual specimens. It has been reported by Manders and Kowalski (1987) that a misalignment of fibres by 1 ° relative to the specimen axis can reduce the measured tensile strength of a UD CFRP laminate by as much as 30%. On the other hand, a reduction of 11% in the compression strength of a UD CFRP laminate for a 1 ° fibre misalignment has been recorded by Hannah (2007).
Whilst laminates prepared from prepreg can be expected to have a fairly consistent thickness across a plate, composites manufactured by other means, for example, the resin infusion under flexible tooling (RIFT) approach, plate thickness can be quite variable. This variability will follow through to thickness variation in individual specimens and between different specimens, leading to a high coefficient of variation in the test results.
Diamond tooling should be used for machining, although water jet and laser systems can be used and are preferable for Kevlar composites. Wherever possible all edges of specimens should be ground to final dimensions. Grinding removes machining imperfections on the surfaces, micro-cracks caused by the machining process and the heat affected zone.
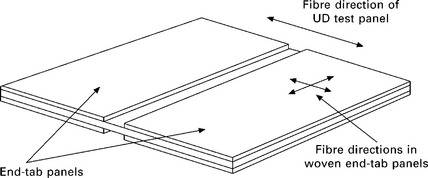
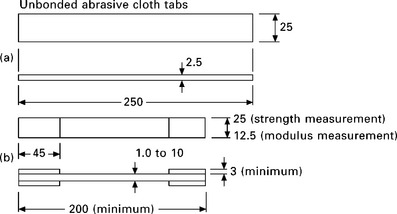
Where test specimens are likely to be damaged by grips or other types of loading arrangement, the specimen surfaces should be protected by end-tabbing material. Printed circuit board (PCB) makes an ideal end-tabbing material. Ideally, the end-tab laminate is bonded to a sub-laminate of the test material, as shown in Fig. 6.1. The use of PCB, or some other appropriate fibre reinforced plastic composite, for end tab material facilitates machining of the test specimens with integrated end-tabs. This is not possible when using aluminium or steel end-tabs, which need to be dealt with individually, which is rather tedious, messy and potentially inaccurate.
Care needs to be taken to ensure that the gauge section and other surfaces are not compromised when bonding. Potential problems are end-tab slippage, resulting in the gauge section being longer or shorter than it should be; end-tabs slipping to an angle with the test material; adhesive encroaching onto the gauge section or end-tab surfaces. End-tab slippage can be prevented by using a bonding jig similar to that described in Shaw and Sims (2005). Surface contamination of the gauge section and end-tab surfaces can be prevented by the application of thin adhesive tape to those areas requiring protection.
Thickness variations across the test material lead either to end tabs that are not parallel to one another, or variations in the thickness of the end-tab adhesive. Non-parallel end-tabs will lead to gripping problems and premature failure, whereas adhesive thickness variations risks failure within the adhesive. The only solution is to grind across the end-tabs.
6.2.2 Fibre volume fraction
The mechanical properties of a composite material are dependent upon the fibre volume faction which should be determined for all batches of specimens. There are several methods available but the preferred method is by acid digestion of the matrix, as found in ASTM D3171, if this is possible for the particular matrix.
6.2.3 Specimen conditioning
Aerospace quality composite materials are required to be tested for mechanical properties not only dry at room and low temperature (typically −50 °C) but also at several elevated temperatures (typically 70, 90, 100 and 120 °C) in the ‘hot/wet’ condition, where the test specimens have been conditioned at 70 °C and 85% relative humidity. Whilst most non-aerospace applications do not require such a comprehensive testing regime, a test programme that makes no attempt to ensure a specific specimen water content (or dry) and/or test temperature lacks a certain amount of credibility. Advice on specimen conditioning can be found in ASTM D5229M.
6.2.4 Stress state
In order to achieve relevant data, the correct stress needs to be applied in a pure and uniform state within a representative volume of the material. This can, however, be difficult to achieve in practice for some stress states, especially at failure. It is therefore crucial that every effort is made to ensure that the test coupon and any associated jig are designed appropriately.
6.2.5 Specimen alignment
The practicalities related to specimen alignment are dependent on the particular mode of testing under consideration and what jigs and/or gripping arrangements are in use. The effects are also likely to be different dependent on the loading mode. For example, in tension, relatively small misalignments may largely be alleviated by specimen compliance and selfalignment as the specimen settles in the grips. On the other hand, specimen misalignment in a compression test is likely to cause instability and early failure.
6.2.6 Strain measurement
Traditional methods for strain measurement are extensometers and strain gauges, both of which require physical contact between instrumentation and specimen, and are directional. Extensometers generally record a strain over a significant length of material, typically up to 25 mm, or greater. They are also available with a capability to measure strains in two axes, thus allowing Poisson’s ratio determination. Strain gauges are available in a wide range of gauge lengths, but tend to be used at the short end of the scale and therefore give a rather local strain reading; they are also not reusable once damaged. Strain gauge length must be considered carefully when the material under test has woven or braided construction, since it is important that the gauge covers a representative number of unit cells. Strain gauges can be bonded more or less anywhere, and in any direction, on a specimen or structure. Non-contacting strain measurement instrumentation includes video extensometry and digital image correlation (DIC) techniques. Some of these methods have a global strain capability, rather than being limited to directional measurement. The main disadvantages are their initial expense and potential limitations in use, as they are rather bulky.
What must be stressed here is that the use of deflection (e.g. machine crosshead displacement in a tensile test) cannot be used to calculate strain. There are a number of reasons why a ‘strain’ determined in this way will be in significant error. The machine stiffness, load chain contributions, deflection of the load cell and contact deflections all make their contributions. There are exceptions to this, however. For example, it is permissible to use specimen displacement in the determination of elastic modulus in a three-point flexural test, because the stiffness of the specimen is low compared to the stiffness of the test machine.
Special consideration must be given to strain measurement when there are likely to be temperature or humidity changes during the test. This is especially the case when strain gauges are used. ‘Dummy’ gauges, mounted on an identical piece of material to that under test and in the same atmosphere should be used in one arm of the Wheatstone bridge circuit to compensate for the humidity/temperature induced strains. Extensometers can be purchased that operate over a range of temperature and humidity conditions. Non-contacting strain measuring techniques do not, in themselves, suffer any problems. However, since they depend on an optical relationship with the specimen, the environmental chamber must include a suitable viewing window.
6.2.7 Pre-test records
Before starting any testing it is necessary to record details of the material being used, including the manufacturing related details, such as layup, cure cycle, resin and fibre types, fibre volume fraction and specimen pre-conditioning. Details should be recorded of the testing machine, grips, data acquisition system and strain measuring equipment. Specimen dimensions should also be recorded. These details normally include length, thickness and width, together with any other dimensions that are necessary for the measurement of the applied stress. Normally measuring equipment capable of reading to 0.02 mm is sufficient for this purpose.
6.2.8 Size effects
Whether there are specimen size effects that influence the stress-strain and/or failure response of composites remains a contested issue. Jackson et al. (1992) carried out scaled tensile and three-point flexure tests on carbon/epoxy composites and deduced that the elastic response was independent of size but that a significant scale effect existed in strength. Wisnom and Atkinson (1997) observed lower failure stresses and strains in tensile and four-point flexure tests carried out on E-glass/913 epoxy composites when dimensions were increased. On the other hand, Lavoie et al. (2000) found no significant effect in scaled tensile or three-point flexure tests carried out on carbon/epoxy composites, attributing any differences noted to test method effects. More recent work by Wisnom et al. (2008) appears to confirm that size effects do exist in the tensile failure of composite laminates. Work on compression behaviour of UD carbon/epoxy laminates by Soutis et al. (2002) and Lee and Soutis (2005) suggests that the apparent thickness effect on compressive strength does exist, but is due to such factors as increased void content and fibre waviness when thickness is increased. However, work by Cheung (2006) suggests that a well-designed specimen and jig combination allows thick compression specimens to give strengths equivalent to thin specimens. It does seem that, at least for some types of test, careful specimen and test jig design could eliminate the problem.
6.3 In-plane testing
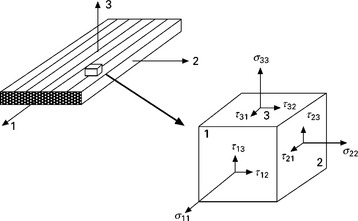
The purpose of in-plane mechanical testing is to provide the basic property data of a quality that can be used in the analysis and design of structures. For laminates, these properties are generally determined using a UD fibre arrangement. There are, however, some in-plane mechanical properties that can be measured with other layups. Figure 6.2 shows the principal directions and stress components for an orthotropic material. The properties of interest are the elastic moduli, strengths and Poisson’s ratios, measured in the 1 and 2 principal directions.
6.3.1 Tension
Grips and specimen alignment
The gripping faces of grips used for the tension testing of composite materials are normally finely serrated in order to minimise damage to the specimen. A suitably abrasive cloth placed between the grip face and the specimen serves well if only coarse or smooth faced grips are available.
Manual or hydraulically operated parallel clamping grips allow greater operator control over the gripping force than do wedge grips, which have faces sliding on inclined planes, so that the gripping force increases with the axial load on the specimen. Wedge grips have the advantage that at the start of the test the gripping force is low, allowing slight movement of the specimen to correct any initial misalignment. Whichever type of grip is used, sufficient clamping force must be applied to avoid specimen slippage within the grips.
Some grips are provided with a scribed scale indicating the centre of the grip, which can be aligned with the centre of the specimen. Where there is no indicator, care needs to be taken to consider the shape of the grip and how that relates to the axial load path of the testing machine and the shape of the specimen.
ASTM D3039M and BS EN ISO 527 give advice on checking the alignment of testing machines. A 25 mm wide specimen having two strain gauges bonded at the edges on one side and another at the centre of the other face, as shown in Fig. 6.3, is strained in tension. The three gauges will give the same reading if alignment is perfect. Any misalignment causes the specimen to bend, resulting in different readings from the strain gauges. The allowable limit on bending is that the sum of 4/3 the strain difference across one face plus the strain difference between that face and the mean strain should be less than 3% in ISO 527 or 5% in ASTM D3039M.
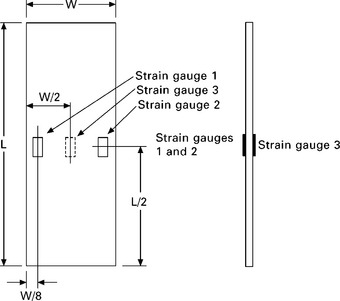
6.3 Specimen for checking testing machine alignment as recommended by ASTM D3039M and ISO 527.
Specimens
The detailed dimensions of specimens currently recommended by standards organisations depend on the fibre direction in the specimen. However, the overall shape is invariably constant rectangular cross-section and normally with end-tabs, as shown in Figs 6.4 and 6.5. End-tabs are not a specific requirement in either ASTM 3039M or ISO 527 but it is pointed out that the decision whether or not to use them depends on the testing outcome, that is, whether with or without end-tabs acceptable failure modes and location are achieved. Many material configurations can be successfully tested in tension without end-tabs; these include multidirectional laminates, fabric-based materials and randomly reinforced moulding compounds. However, tabs are considered to be more or less essential when testing UD materials (or materials that are strongly UD dominated) to failure in the fibre direction, and also to prevent gripping damage when testing specimens with UD transverse fibres.
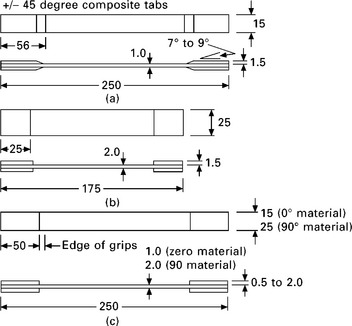
6.4 Tensile specimens for 0 ° and 90 ° aligned reinforcement: (a) ASTM D3039M (0 °); (b) ASTM D3039M (90 °); (c) ISO 527 (0 °). Dimensions in mm.
6.5 Tensile specimens for non-0 ° reinforcement: (a) ASTM D3039M; (b) ISO 527. Dimensions in mm.
A further consideration concerning end-tabs is whether the inner termination should be bevelled at a shallow angle or square-ended (90 ° bevel). In ASTM D3039M a bevel of between 7 ° and 10 ° is recommended when wedge grips are used but square-ended tabs are considered to be adequate for other types of grip. It is not clear what rationale is behind these recommendations since the standard admits that the use of the specified tabs does not guarantee success for every existing or future material system.
A final point to be taken into account with end-tabbed specimens is where the inner termination should lie in relation to the edge of the grip. The advice in the standards has changed over time, with some early versions recommending that 5 mm of the tab should protrude beyond the grip, whereas current versions of ISO 527 and ASTM D3039M agree that the end-tab should be wholly contained inside the grip.
The specimen needs to be sufficiently long to avoid end effects. Where the reinforcing fibres are woven or braided, the specimen must be wide enough to contain a representative number of unit cells of the reinforcement. Specimen thicknesses are generally between 1 and 2.5 mm, with the thinner dimension being used for axial UD material. The material needs to be thick enough to render any resin-rich surface effects insignificant and not so thick that the specimen strength proves to be greater than that of the adhesive joints between specimen and end-tabs.
The through-thickness machining of materials to reduce them to a suitable thickness may be necessary under some circumstances. For example, multidirectional materials tend to be thicker than UD and, for some applications, material thicknesses may be substantially greater than that normally recommended for tensile testing, which is 10 mm in ISO 527. If it is thought necessary to machine specimens to thickness, great caution should be exercised. When plates of fibre reinforced composites are machined through-thickness, there is the possibility of residual stresses being released, leading to distortion of the remaining plate material. There is also the likelihood that such machining would alter the effective layup of laminated materials, making the machined specimens unrepresentative of the laminate from which they came.
Strain measurement
For most laboratories the use of strain gauges or extensometers remains the method of choice, largely due to the relatively high initial cost of other techniques. In order to avoid damage to extensometers, they should be released from the specimen before failure, as the stored energy released is considerable. Measurement of longitudinal and transverse strains allows the determination of Poisson’s ratio.
Data reduction
Many tensile tests show a degree of nonlinearity at the start of the test, mainly due to the specimen ‘settling’ in the grips and specimen/grip slippage. Subsequently, as the load increases, there may be further nonlinearity, especially for materials containing non-UD fibres. There are three ways in which the elastic modulus can be calculated in those circumstances. The first is to take the modulus as the slope of the initial tangent to the curve; the second is to take the tangent to the curve at a specific strain; and the third is to construct a secant (or chord) between two points, typically at strain values of 0.05% and 0.25% strain for ISO 527 or 0.1% and 0.3% in ASTM D3039M. Poisson’s ratio should be calculated using the same upper and lower strain limits used for modulus determination.
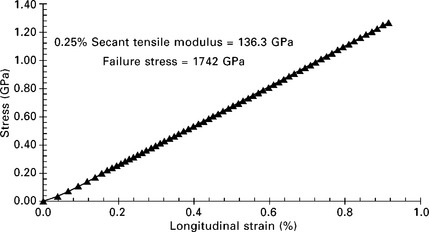
Figure 6.6 shows a stress–strain plot for an ISO 527 specimen with UD T300/914 CFRP (T300 is the type of carbon fibre and 914 is the epoxy resin), together with the derived elastic modulus and tensile strength. The relationship is precisely linear. Elastic modulus was determined between 0.1% and 0.3% strain. It will be noted that the data points terminate at just beyond 0.9% strain and at a stress close to 1300 MPa, when the strain gauges broke. The actual failure stress was recorded as 1742 MPa.
Failure
It is frequently the case that a batch of essentially identical specimens from the same material results in a variety of failure modes. It is also common to observe failure at more than one place in a particular specimen. It is therefore important that full details of failures should be reported. At the conclusion of the test the failure mode and location of failure should be observed and assessed. Failures inside the end-tab or within a specified distance of the tab are generally regarded as being influenced by the grips and are therefore invalid. If a large number of specimens in a batch fail in this way, the method of load introduction should be investigated, modifications made and the tests repeated until successful failures are obtained. ASTM D3039M includes a useful three-part code for the description of failures.
6.3.2 Compression
Types of test
There are three basic methods of introducing a compressive load into a specimen. These are illustrated in Fig. 6.7. Direct loading is not suitable for high-strength composites owing to their low transverse and interlaminar strengths. Such specimens fail by end crushing ‘brooming’ and/or longitudinal splitting.
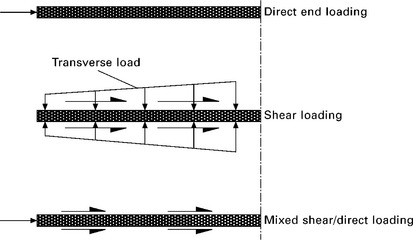
6.7 Load introduction methods for compression tests. From Matthews (2000).
Shear loading is normally introduced via end-tabs and is the most common method specified by standards organisations. The first jig developed using this principle is the Celanese fixture, adopted by ASTM D3410M and ISO 14126. The specimen is clamped in conical wedge grips accommodated in tapered sleeves, with an outer cylinder maintaining alignment. When loaded, the sleeves transmit shear loading to the specimen via the grips. A schematic of the arrangement is shown in Fig. 6.8(a), with Fig. 6.9(d) and Fig. 6.10(a) showing the assembled and disassembled jig, respectively. The Celanese fixture requires careful adjustment to the thickness of the specimen to avoid distortion of the sleeves and friction with the outer cylinder. If specimen thickness is not precise, the conical wedges form a line of contact with the outer sleeves, resulting in jig/specimen instability and lower bound strength values.
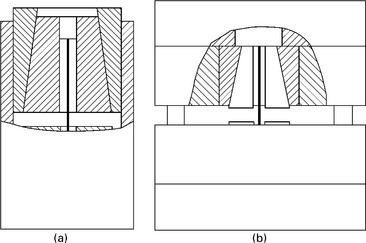
6.8 Schematic of (a) Celanese, (b) IITRI jigs. Not to scale. From Matthews (2000).
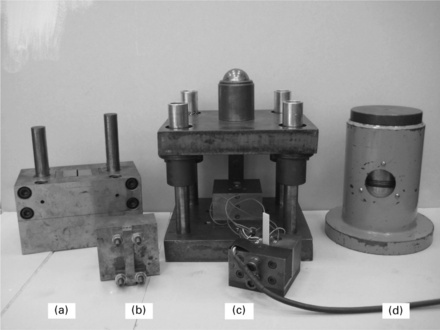
6.9 Various compression jigs to the same scale: (a) lower part of IITRI, (b) ASTM D695, (c) ICSTM, (d) Celanese.
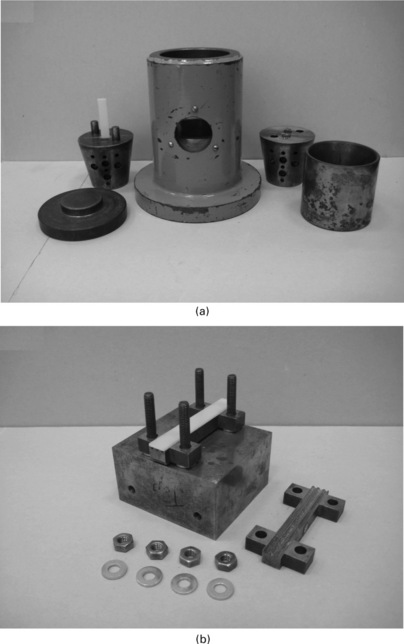
6.10 Disassembled compression jigs, not to the same scale: (a) ASTM D3410 Celanese, (b) ASTM D695.
The Illinois Institute of Technology Research Institute (IITRI) jig is also adopted by both ASTM D3410M and ISO 14126. With this jig, flat-sided tapered grips fit into matching pockets in massive steel blocks, so that specimens of different thicknesses are more easily accommodated. The steel blocks are aligned by pillar guides and linear bearings. A schematic of the IITRI jig is shown in Fig. 6.8(b) and the lower half of the fixture is shown in Fig. 6.9(a). The weight of this fixture, at approximately 250 N, reduces the ease of use significantly.
The ASTM D695 jig applies mixed shear and end loading, with some of the load being introduced to the specimen by shear through the end-tabs. The jig, shown assembled in Fig. 6.9(b) and disassembled in Fig. 6.10(b), is simple and relatively small. With end-loaded specimens, it is especially important that the specimen ends are parallel.
The ICSTM jig developed by Häberle and Matthews (1990) and shown in Fig. 6.9(c) also applies mixed direct and shear loading. The end-tabbed specimen is clamped through the thickness inside end block fixtures, which are placed in a four-pillar die set, ensuring good alignment and stability.
The combined loading compression (CLC) jig, shown in Fig. 6.11, is adopted in ASTM D6641M. The test method aims to determine the compression strength and modulus of balanced and symmetric laminates that contain at least one 0 ° ply. Loading is by combined end and shear loading. The specimen used with this jig is basically the same general shape as that recommended for the IITRI jig in ASTM D3410M but is untabbed and limited to 50% 0 ° plies. Specimens with greater proportions of 0 ° plies lead to high fixture clamping forces being required to prevent end crushing, causing low strength results owing to the stress concentration generated at the end of the gauge section.
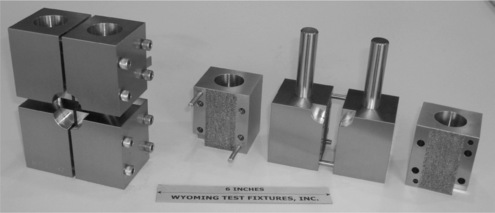
6.11 Assembled and disassembled Wyoming CLC jig adopted in ASTM D6641M for testing MD specimens. Photograph kindly supplied by Wyoming Test Fixtures Inc.
Specimen configurations
There are basically two types of specimen used in compression testing, depending on whether the gauge length is supported or unsupported. Methods which propose the use of short unsupported specimens are generally appropriate for the measurement of the properties of UD materials, although they can be used for testing other laminate layups or material types.
The specimen shapes proposed in ASTM D3410M (Celanese and IITRI), ASTM D695 and for the ICSTM fixture are shown in Fig. 6.12. All are rectangular, of constant cross-section, but there are variations in specimen length, width, thickness, gauge length and tab thickness. Understandably, the overall length of the specimens loaded in shear only is greater than for those loaded by direct and shear loading. All, with the exception of the Celanese specimen, have a width of 10 mm, the 6 mm width proposed for the Celanese specimen probably being historical (i.e. not requiring the jig to be altered and allowing database continuation). The proposed end-tab thicknesses are actually quite similar, with end-tabs not being an absolute requirement. The specimen thickness range given in ASTM D3410M is in order to accommodate the possibility of using different gauge lengths for materials with high/low modulus or high/low strength and avoiding Euler buckling failure. Basically, the recommendation for testing parallel-sided UD composite specimens is to limit the thickness to 2 mm, as greater thicknesses give reduced strength results as shown by Cheung (2006).
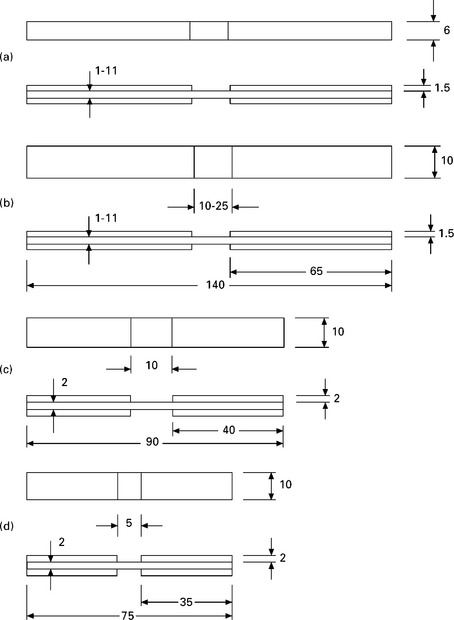
6.12 Specimen configurations for: (a) ASTM D3410M (Celanese); (b) ASTM D3410M (IITRI); (c) ICSTM; (d) ASTM D695. Dimensions in mm.
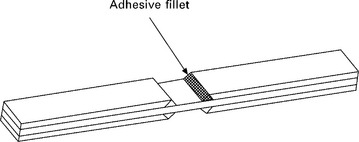
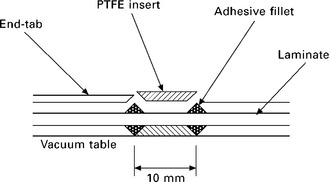
Experimental and theoretical evidence in Shaw and Sims (2005) concludes that the stress concentration at the junction between the gauge section and end-tab can be relieved to some extent by the introduction of an adhesive fillet. Such a specimen, referred to as the ‘reverse chamfer specimen’ is shown in Fig. 6.13, with the method of manufacturing the fillet being demonstrated in Fig. 6.14. The end-tab material is machined at a reverse 45 ° angle along the edges adjacent to the gauge area. A polytetrafluoroethylene (PTFE) insert, also machined with 45 ° angles, is used during end-tab bonding to form an adhesive fillet.
Strain measurement
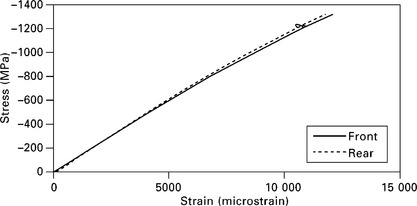
Extensometers and other strain measuring techniques can be used in the testing of compression specimens, but most laboratories make use of strain gauges. In compression testing there is the possibility of Euler buckling failure and related bending of the specimen being evident even at low strain levels. Bending of the specimen can also be caused by jig/specimen misalignment problems and these effects cannot be detected by visual inspection. It is, therefore, highly recommended that strain gauges be fixed ‘back-to-back’ on the gauge section, along the axis of the specimen, in order to detect any bending, which is manifested by diverging strain readings as the specimen is loaded. Fig. 6.15 shows a compressive stress–strain curve for a UD CFRP specimen with back-to-back strain gauges. As can be seen the two strains remain virtually the same up to failure, suggesting no specimen bending. The detection of specimen bending is somewhat more difficult to achieve with other strain measurement techniques.
Failure
A wide variety of failure modes can be experienced for UD compression specimens, several of which invalidate the results. Failure should occur within the gauge section and not inside the end-tabs. Failures frequently initiate close to the end-tab and propagate into the gauge section. Such failures are considered as valid, unless there is evidence of failure elsewhere in the end-tab region. ASTM D3410M includes advice on what constitutes acceptable or unacceptable failure modes.
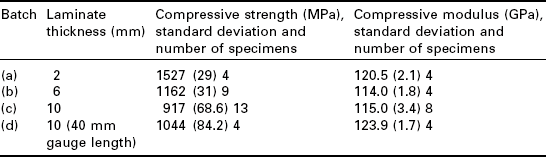
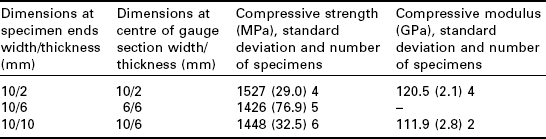
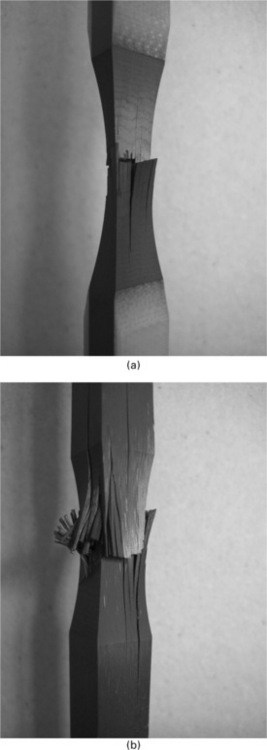
Parallel-sided specimens from UD CFRP laminates of thicknesses greater than 2 mm have been tested by Cheung (2006) and Hannah (2007). Failure was by transverse, through-thickness cracks initiating within the end-tabbed region as shown in Fig. 6.16. The failure stresses were well below that achieved with 2 mm thick, parallel-sided specimens, as shown in Table 6.1. Extending the gauge length from 10 mm to 40 mm failed to produce an acceptable failure mode and continued to give lower than expected failure stresses. The elastic moduli recorded for all of these batches of specimens were within the range expected for the particular CFRP under test (T300/914 from Hexcel).
Table 6.1
Compression results for T300/914 CFRP on 2 mm, 6 mm and 10 mm thick, parallel-sided specimens. Specimens in batches (a) to (c) were nominally 90 mm long, with a 10 mm gauge length; specimens in batch (d) were nominally 120 mm long with a 40 mm gauge length. All batches were manufactured with reverse chamfer end-tabs
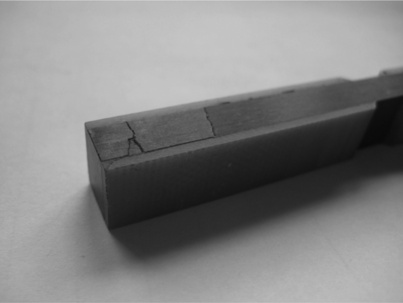
6.16 10 mm wide, parallel-sided compression specimen from a 6 mm thick laminate, showing transverse crack failures within the end-tab region.
Numerous attempts, documented by Camponeschi (1991) and Daniel et al. (1995), to design compression jigs capable of delivering failure stresses for UD specimens from thicker laminates, equivalent to that for 2 mm thick specimens, achieved little success. This fundamental inability to achieve satisfactory failure stresses in specimens from thick laminates has resulted in the 2 mm thick specimen becoming the de facto standardised specimen, since it gives an optimised result which is not very different (albeit lower) from that achieved in tension.
Relatively recent research programmes by Shaw and Sims (2005), Lee and Soutis (2007) and Cheung (2006) have revisited the concept of ‘waisting’ the gauge section of thick UD CFRP specimens tested in compression. Waisting here means the machining of material from the specimen gauge section with the intention of forcing failure in the central region where the dimensions are reduced. All of the above mentioned research groups used the ICSTM compression jig. The results presented by Shaw and Sims (2005) on UD glass/epoxy and Lee and Soutis (2007) on UD IM7/8552 CFRP were for specimens waisted either across the width only, or through the thickness only, respectively. Their results showed poor correlation with those for standard 2 mm thick, parallel-sided specimens. However, Cheung (2006) carried out similar experiments on T300/914 UD CFRP specimens waisted either across the width or through the thickness and the results for elastic modulus and strength are recorded in Table 6.2. As can be seen, the compression strengths obtained for these waisted specimens was approximately 94% of that achieved with 2 mm thick, parallel-sided specimens. The elastic modulus for the waisted batch is slightly lower than that for the parallel-sided batch since the strain gauges were bonded to the curved surface.
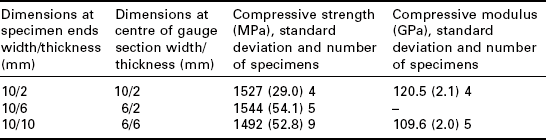
Table 6.2
Compression results for T300/914 CFRP on 2 mm thick, parallel-sided specimens and batches waisted either across the width or through the thickness
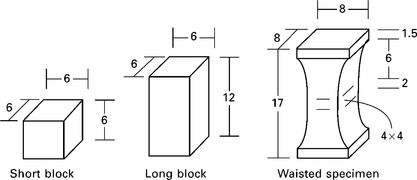
Cheung (2006) also waisted all four faces for batches of specimens with different cross-sectional dimensions. The specimens were 120 mm long with a circular waisted gauge section of approximately 40 mm in length. Respective width and thickness dimensions outside the gauge section were either 10 × 6 mm or 10 × 10 mm with the dimensions at the centre of the gauge section being ground to 6 × 2 mm and 6 × 6 mm, respectively, using a 150 mm diameter grinding wheel. The compressive stress-strain curve for one of these specimens is shown in Fig. 6.17. Strains were measured on all four faces and show that there was no bending involved as the load increased.
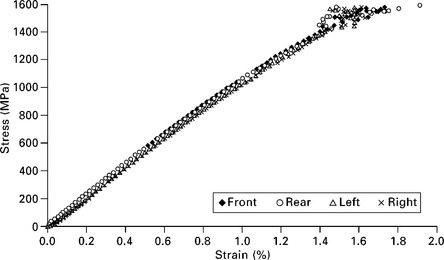
6.17 Stress-strain curve for a T300/914 CFRP specimen waisted on all four faces. Strains recorded on all faces.
The results for these tests are shown in Table 6.3. It can be seen that the compression strengths for the batches of specimens with waisted cross-sections are almost identical to that for the 2 mm thick, parallel-sided batch. These results strongly suggest that the waisting technique is capable of delivering compression strength results for specimens from thick laminates that are equivalent to those obtainable from the standard 2 mm thick laminates. Typical examples of failed specimens from these tests are shown in Fig. 6.18. It can be seen that the failures occur at the centre of the gauge length and appear to be acceptable.
6.3.3 Shear
There are a range of test methods available for the determination of shear properties in composite materials:
• torsion of a thin-walled tube
• uniaxial tension of a ±45 ° laminate
• uniaxial tension of a 10 ° off-axis laminate
Torsion of a thin-walled tube
A thin-walled, circumferentially wound cylindrical tube, subjected to a pure torque around its longitudinal axis, develops a stress state close to pure shear, uniformly distributed around the circumference and along the tube length. Since the wall thickness is small relative to the diameter, the through-thickness shear gradient is negligible.
The tube should have a gauge length-to-diameter (L/D) ratio greater than 1, and a wall thickness-to-diameter (h/D) ratio less than 0.02. These dimensions help to generate a uniform shear stress at the mid-length, whilst preventing local and global shear buckling. Such a specimen is shown in Fig. 6.19. The tube ends are overwound with additional material and tapered to promote failure within the gauge section. The tubes are bonded to close fitting concentric fixtures inserted at each end, mounted concentrically in the test machine, and loaded at a constant torque speed, typically 2 ° min−1. Any axial stresses, caused by the shear deformation of the specimen, are prevented by allowing free axial displacement.
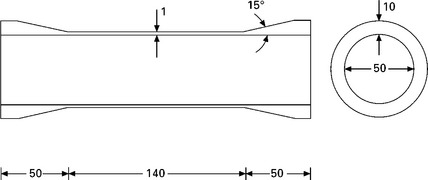
6.19 A hoop-wound thin-walled cylindrical specimen. Dimensions in mm. Adapted from Broughton (2000).
Shear strain is measured by two diametrically opposite triaxial (0 °/45 °/90 °) strain gauges bonded at the centre of the gauge section. Monitoring longitudinal and transverse strains ensures that minimal bending loads are applied during specimen setup and test.
The in-plane shear stress, τxy, and shear modulus, Gxy, are calculated from:
where T is the applied torque, Ro and Ri are the outer and inner radii of the tube, with ε45 and ε−45 being the measured strains. Failure should initiate at the outer radius.
The test method is standardised as ASTM D5448M but the cost and difficulty associated with the fabrication and testing of tubular specimens normally proves to be excessive for many organisations, which has limited the use of the method.
Uniaxial tension of a ±45 ° laminate
When a ±45 ° laminate is loaded in uniaxial tension, as shown in Fig. 6.20, a biaxial stress is generated within each +45 ° and −45 ° layer. The shear stress, τ12, is given by:
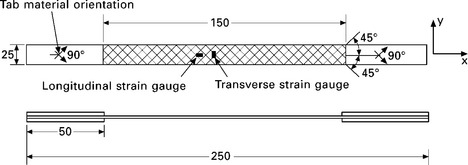
6.20 Schematic of the ±45 ° tensile specimen. Dimensions in mm. Adapted from Broughton (2000).
where σxx is the applied tensile stress, with b and h being the width and thickness of the specimen, respectively. The in-plane shear modulus, G12, is given by:
and can be obtained from the slope of the shear stress–strain curve, τ12 versus γ12, over the strain range 0.1 to 0.5, as shown in Fig. 6.21.
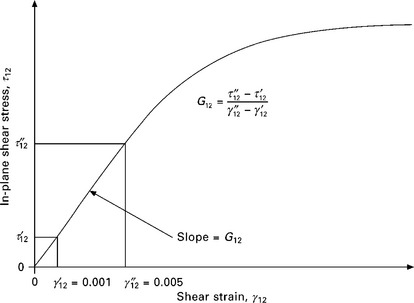
6.21 Typical shear stress–strain curve for the ±45 ° specimen. From Broughton (2000).
So long as failures occur outside the grips, specimens can be tested with or without end-tabs. If end-tabs are used, they should be manufactured from a ±45 ° glass fibre/fabric, such as PCB, with a tab angle of 90 °, as with normal tensile specimens.
Strain measurement is generally by the use of strain gauges, although other methods can be used. The strains required are longitudinal and transverse, εxx and εyy, taken near the centre of the gauge length.
Despite this test method having been adopted by ASTM D3518M and ISO 14129, and widely used throughout industry, there are a number of problems with it. The gauge section of the specimen is not actually in a state of pure in-plane shear stress, since an in-plane normal stress component exists and there is a complex stress field close to the free edges of the specimen. The stress component normal to the fibre direction is present in all plies but its effect is minimised by neighbouring plies, making the thickness of individual plies an important parameter influencing the shear stress–strain response and ultimate failure load. Whilst an interior ply is constrained by plies on each side, surface plies are only constrained by a single ply, making surface plies the weak link. During loading, first ply failures consist primarily of normal stress, or mixed mode, failures, rather than pure shear failures, so that the actual material shear strength cannot be obtained from this test.
Since the average applied load is used to calculate the shear stress, this does not necessarily correspond to the stress in the vicinity of the measured shear strain, unless the axial stress is uniform throughout the volume of the material. It follows that the greater the degree of material inhomogeneity, such as with coarsely woven fabrics or materials with significant resin-rich regions, the greater the potential for inaccuracies in the measured response.
Significant fibre scissoring can occur when ductile matrices, weak fibre/matrix interfaces or thick specimens with a large number of repeat plies are present. Kellas et al. (1993) suggest that a fibre rotation of 1 ° takes place for every 2% of axial strain. Fibre scissoring potentially leads to a violation of the assumption of a nominal ±45 ° laminate and is the main reason for terminating the test at a large strain level, even if load is still increasing. The standards recommend that the stress at 5% shear strain should be used as the failure stress, limiting fibre scissoring to about 1.5 °, which is about the limit for foil strain gauges, and beyond strain levels generally acceptable in engineering practice.
Uniaxial tension of a 10 ° off-axis laminate
This test is carried out in tension on a specimen reinforced with UD fibres oriented at 10 ° to the loading axis, as shown in Fig. 6.22, inducing a biaxial stress state in the material principal coordinate system. The choice of a 10 ° angle minimises the effects of the longitudinal and transverse stress components, σ11 and σ22. At an angle of 10 ° the shear strain approaches a maximum value.
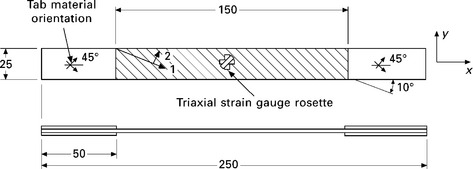
6.22 Schematic of the 10 ° off-axis specimen. Dimensions in mm. Adapted from Broughton (2000).
The magnitudes of the stresses, σ11, σ22 and τ12, on the 10 ° plane are given by (Broughton, 2000):
where σxx = P/bh.
A triaxial rosette measuring the longitudinal (ε1), transverse (ε2) and 45 ° (ε3) strains, relative to the specimen axis, allows the in-plane strain (γ12) along the 10 ° plane to be determined (Broughton, 2000):
This test method is not standardised by either ASTM or ISO. However, it would be reasonable to follow advice for specimen preparation and dimensions given for the ±45 ° tension specimen. Whilst tab material for both types of specimen could be ±45 ° PCB, it has been demonstrated by Pierron and Vautrin (1996a, 1996b) that tabs with an oblique fibre angle might be preferred for the 10 ° off-axis specimen.
The in-plane shear modulus is obtained from the initial slope of the shear stress–strain curve over the strain range 0.05% to 0.25%. Relatively small orientation errors in machining the correct angle and strain gauge orientation can result in large errors in shear measurements.
Failure occurs by a combination of transverse tensile and shear stresses, the onset of failure being catastrophic, with a crack propagating across the gauge section at the 10 ° angle.
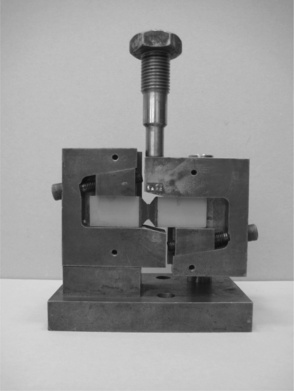
V-notched beam (Iosipescu) shear test method
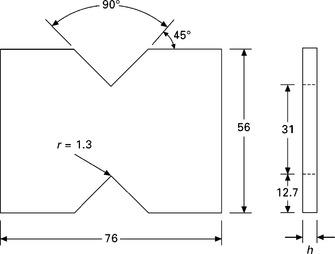
Standardised in ASTM D5379M, the specimen is a flat rectangle with overall dimensions 76 mm by 20 mm, incorporating opposing V-notches at the centres of the long sides, as indicated in Fig. 6.23, with the loading jig shown in Fig. 6.24. The 90 ° notches have a tip radius of 1.3 mm and are machined to a depth of 4 mm. The recommended specimen thickness is between 3 and 4 mm, although thicker materials can be tested, as can thinner materials if end-tabs are used. The use of end-tabs helps to prevent out-of-plane bending and twisting of the specimen and local crushing under the inner loading areas.
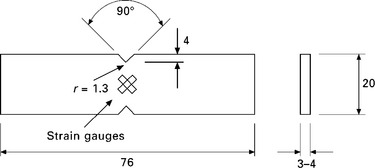
The shear strain is measured by biaxial strain gauge rosettes on each face of the specimen between the notches and oriented at ±45 ° to the long axis of the specimen. In theory the test induces a state of pure shear at specimen mid-length by the application of two force couples. However, several groups of researchers, including Broughton et al. (1990), have shown that the shear stress distribution in the test section is not uniform. The shear and normal stress distributions are also highly dependent on orthotropy ratio, Exx/Eyy, notch geometry and loading boundary conditions.
The shear strength, Sxy, and shear modulus, Gxy, are calculated from:
and
where Pmax is the failure load, w the distance between the notch roots and h the specimen thickness. ΔP, ∆ε45 and ∆ε−45 are the changes in applied load and the +45 ° and −45 ° normal strains in the initial linear portion of the shear stress–strain curve. The strain data used for determining shear modulus should be the average of the strains from both sides of the specimen, to minimise the effects of out-of-plane movement or twisting of the specimen.
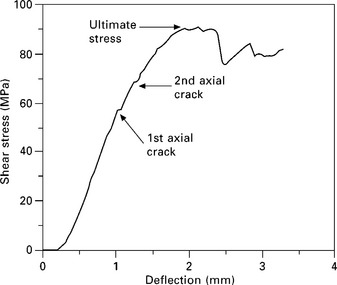
Numerous failure modes may occur, as shown in Fig. 6.25, dependent on the type of material under test. For a UD specimen with the fibres along the specimen axis, shown in Fig. 6.25(c), cracks initiate due to the shear stress concentration at the notch roots, the cracks propagate parallel to the fibres on opposite sides of the inner loading points. Continued loading causes these cracks to arrest and several interfacial cracks may appear in the gauge section. The formation of these cracks causes final failure and the peak load is used in the calculation of shear strength. A typical stress versus displacement curve for this type of specimen is shown in Fig. 6.26.
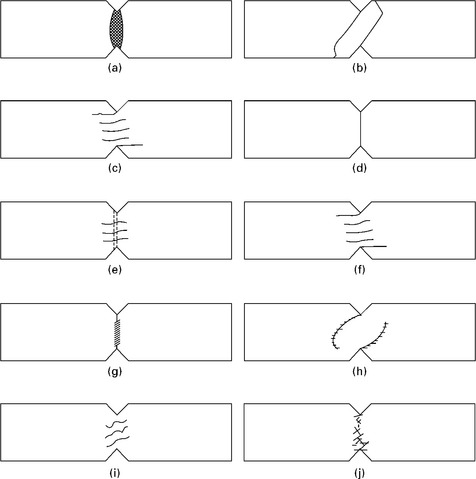
6.25 Typical failure modes for the V-notched beam test: (a) unreinforced thermoplastic showing shear yielding; (b) unreinforced thermoset showing brittle tensile failure (unacceptable); (c) 0 ° continuous UD; (d) 90 ° continuous UD (unacceptable); (e) woven fabric showing intralaminar failure; (f) woven fabric showing interlaminar failure; (g) long fibre thermoplastic showing shear yielding; (h) long fibre thermoplastic showing brittle tensile failure (unacceptable); (i) sheet moulding compound; (j) chopped strand mat. From Broughton (2000).
The shear stress state in UD fibre reinforced specimens with the fibres at 90 ° to the axis of the specimen is more ideal in principle, being a minimum at the notch root, increasing along the notch-root axis and maximising at the centre of the specimen. Unfortunately, failure occurs prematurely, as indicated in Fig. 6.25(d), with crack initiation caused by a combination of shear and transverse tensile stresses at the notch roots. These cracks propagate in an unstable manner through the matrix along the notch-root axis with the specimen failing at a relatively low stress, making these specimens unsuitable for the measurement of shear strength.
The fixture suffers from a number of deficiencies and several groups of researchers, including Conant and Odom (1995), Pierron and Vautrin (1997) and Pierron (1998), have introduced modifications. However, none of these modifications has been adopted by ASTM. Undoubtedly the main problem with the fixture is the reliance on load application by the moving part of the jig, which is supported by a single off-set post and bearing. This arrangement allows rotation about the post of the moving part relative to the fixed part and assumes no deflection in the bearing assembly.
Two- and three-rail shear tests
The rail shear test is standardised in ASTM D4255M for the measurement of the in-plane shear properties of continuous and discontinuous aligned materials (0 ° and 90 ° orientations), symmetric laminates and randomly oriented fibre reinforced plates. The tests impose shear loads on a plate of material using either a two-rail, or three-rail fixture, as shown in Figs 6.27 and 6.28, respectively.
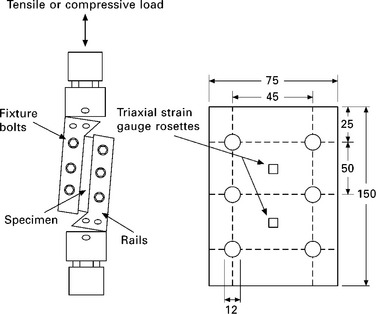
6.27 The two-rail shear jig and specimen. Dimensions in mm. Adapted from Broughton (2000).
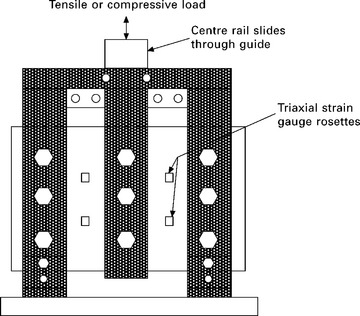
6.28 The three-rail shear jig and specimen. Adapted from Broughton (2000).
The two-rail shear test consists of a rectangular plate specimen, clamped with bolts along its long sides between two pairs of steel loading rails. A force applied to the rails induces a shear load on the specimen. The ASTM standard recommends the use of triaxial strain gauges but biaxial gauges are sufficient to measure shear strain. The shear strength, Sxy, and shear modulus, Gxy, are calculated from:
and
where Pmax is the failure load, L the length of the specimen along the rails and h the plate thickness. ∆P and ∆ε45 are the change in applied load and strain (for the +45 ° or −45 ° strain gauge) in the initial linear region of the stress–strain curve.
The three-rail shear test develops a closer approximation to pure shear and consists of three pairs of rails clamped to the plate specimen. Two outer pairs of rails are attached to a base plate, which is attached to the test machine, the third, inner, pair of rails pass through a slot in the top of the base fixture. When the centre rails are loaded, a shear loading is induced in the specimen. Triaxial strain gauges measure the shear strain. The shear strength, Sxy, and shear modulus, Gxy, are determined from, respectively:
and
There are a variety of problems with these rail shear methods. Thin plates tend to buckle and shear strengths of thick plates may exceed the rail clamping capability. Machining to the required tolerances can be difficult, leading to bearing contact initiating premature failure along the bolt line. Hole drilling can introduce delaminations which act as stress raisers, leading to premature failure. Free edge effects cause the local stress state to be impure and nonuniform. Stress singularities exist near the loaded corners and transverse stresses are also present. Large transverse tensile stresses generated near the corners of the specimen cause premature failure in UD laminates with fibres parallel to the rails. Specimens with UD fibres perpendicular to the rails and cross-ply (0 °/90 °) fail at relatively high strains, with multi-ply cracking.
V-notched rail shear
As the title of this test method suggests, it is a hybrid development of the Iosipescu and rail shear test methods that attempts to incorporate the best elements of each. Standardised as ASTM D7078M, the method claims to be competent for the measurement of shear modulus and strength of high performance and lower performing composites by clamping the ends of a V-notched specimen between two pairs of loading rails. When loaded in tension, the rails introduce shear forces into the specimen through the specimen faces. The specimen, shown in Fig. 6.29, has a larger gauge section and deeper V-notches than those used for the specimen in ASTM D5379M. In contrast to the specimen in ASTM D4255M, the loading of the specimen here relies only on friction gripping between the rails and specimen, rather than drilled holes.
Theoretically, as with the Iosipescu test, material properties may be obtained in the six possible planes by appropriate orientation of the testing plane with the material plane. However, the same practical limitations apply, such as the need in some cases for thick plates of material to manufacture the specimens. The standard admits that the shear modulus obtained from highly orthotropic materials is not as accurate as that from 0 °/90 ° and ±45 ° laminates. In addition, buckling of the specimen and twisting in the fixture are potential problems and true failure stress may not be recorded for a range of laminate layups.
6.3.4 Flexure
The simplicity of flexural tests on beams makes them attractive throughout industry and in materials research programmes. The jigs and instrumentation need not be expensive and the data required to determine elastic modulus and strength can be limited to measurement of specimen dimensions, load and displacement. Data derived from flexure tests should not be relied upon for design purposes, except where flexure is the loading regime in the particular application.
The specimens are normally simply supported flat rectangular beams of constant cross-section. The beam is supported close to its ends and either centrally loaded in three-point bending, as shown in Fig. 6.30, or by two loads placed symmetrically between the supports, giving the four-point bending configuration shown in Fig. 6.31. Also shown in Figs 6.30 and 6.31 are the shear force and bending moment diagrams.
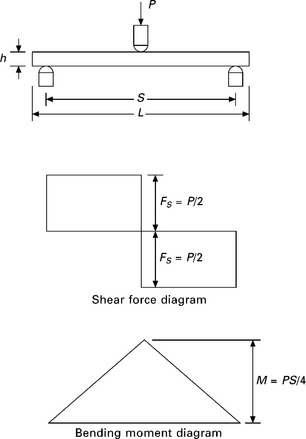
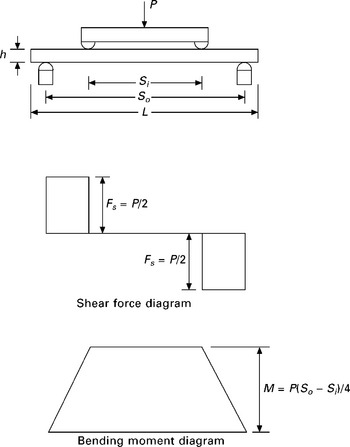
Stress concentrations clearly exist at the loading points but in the four-point loading arrangement, there is a constant bending moment between the inner loading points. Figure 6.32 shows the variations in normal and shear stresses, caused by bending moment and shear force respectively, assuming a rectangular specimen cross-section. The material properties are assumed to be uniform through the thickness of the beam specimen. Under these circumstances, the normal stress varies linearly from a maximum in compression on the upper surface to an equal maximum in tension on the lower surface, passing through zero at the mid-plane (the neutral axis). The distribution of shear stress is parabolic, with a maximum at the neutral axis and zero at the outer surfaces of the beam.
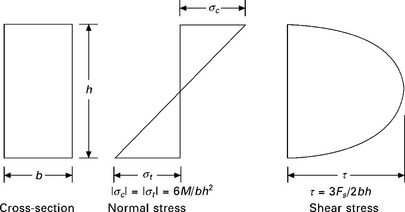
The flexural response of the beam is obtained by recording the load applied and the resulting strain. The strain can be measured by bonding a strain gauge to the tensile surface of the beam, or by measuring the displacement at the centre of the beam and assuming that beam theory (Morley, 1940) applies. Stresses can be calculated as indicated in Fig. 6.32.
Clearly the stress states in specimens subjected to three- or four-point bending tests are different and may lead to differences in the results obtained. From the point of view of the stress state, the four-point test is preferable but the three-point test is easier to carry out.
The flexural strength is the stress on the outer surface of the specimen at failure, which should be accompanied by fibre fracture, rather than interlaminar shear. The strength is calculated using the maximum bending moment, corresponding to the failure load and assuming a linear stress–strain relationship up to failure. Flexural failure is encouraged by the use of a large span-to-specimen thickness ratio, since a large span gives a higher bending moment, which promotes longitudinal failure. Unfortunately large span-to-thickness ratios result in large beam deflections under load. These large deflections make it necessary to take account of horizontal forces which develop at the supports when calculating the appropriate bending moment.
Specimen dimensions and testing arrangement
ASTM D790M, ASTM D6272M, ASTM D7264M, ISO 178 and ISO 14125 all address the flexural testing of fibre reinforced plastics. ASTM D790M is limited to relatively low performing materials and three-point flexure, as is ISO 178. Both ASTM D6272M and ASTM D7264M are appropriate for high-performance composites, but the former is limited to four-point flexure, whereas the latter addresses three- and four-point flexure, as does ISO 14125. Whilst there are differences in the detail between the standards, there is fair agreement when the testing conditions for particular materials are discussed. Tables 6.4 and 6.5 encapsulate this overall agreement as defined in ISO 14125. Undoubtedly the most significant parameter influencing the recorded flexural modulus and strength is the span-to-thickness ratio (see Hodgkinson, 2000).
Table 6.4
Recommended specimen dimensions for different classes of material for three-point flexure in ISO 14125.
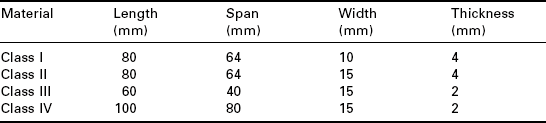
Table 6.5
Recommended specimen dimensions for different classes of material for four-point flexure in ISO 14125.
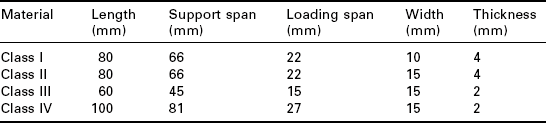
The different classes of material defined in Tables 6.4 and 6.5 are:
• Class I: discontinuous fibre-reinforced thermoplastics.
• Class II: mat, continuous mat, fabric and mixed format reinforced plastic. DMC (dough moulding compound), BMC (bulk moulding compound) and SMC (sheet moulding compound).
• Class III: Transverse (90 °) UD composites, UD (0 °) and multidirectional composites with 5 < E11/G13 ≤ 15 (e.g. glass fibre systems).
• Class IV: UD (0 °) and multidirectional composites with 15 < E11/G13 ≤ 50 (e.g. carbon fibre systems).
Failure modes
There are a number of possible failure modes that might occur under flexural loading, dependent on the test method used and the type of material or layup under test. These failure modes are broadly similar for three- and four-point flexure tests. Typical failure modes are shown in Fig. 6.33, not all of which are regarded as acceptable flexural failures, those including evidence of interlaminar shear being particularly suspect.
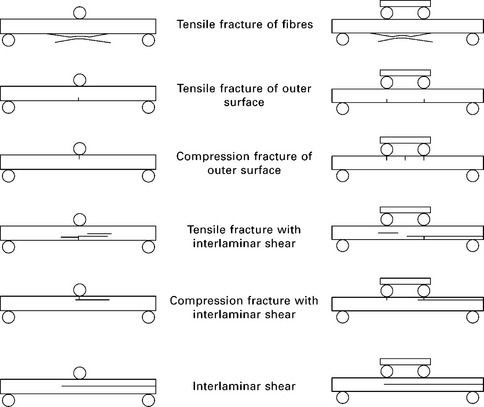
The failure mode and recorded strength are also influenced by the type of material used for the support and loading roller(s). Even large diameter steel rollers introduce a formidable stress concentration. A means of mitigating this effect is to line the rollers with a soft plastic or rubbery material, or to use plastic rollers. This makes the specimen effectively useless for the measurement of flexural modulus, unless a strain gauge is used, because there is a significant contact deflection of the relatively soft roller material when load is applied. However, the approach does introduce the possibility of a more ‘realistic’ flexural failure as recorded by Grothaus et al. (1995).
6.4 Out-of-plane testing
6.4.1 Tension and compression testing
Axial loading
Historically, the drawback for the general use of axially loaded waisted specimens has been the relatively complicated manufacturing process, but the increased availability of CNC machining capability has reduced this as a major problem. Perhaps more importantly, the specimens have to be manufactured from very thick laminates, which potentially have a different microstructure and fibre volume fraction than thin laminates, or they have to be formed by bonding together a large number of thin laminates. With that manufacturing method the bond lines are likely to have a different strength to the laminates themselves, causing artificially induced stress variations in the specimen.
Specimens with waisted gauge section profiles designed using FEA have been manufactured from thick laminates by Ferguson et al. (1998) and Mespoulet et al. (2000). Both groups investigated tension and compression loading, with Ferguson et al. carrying out tests on a wide range of fibre composites, including UD carbon/epoxy prepreg, glass/epoxy manufactured by filament winding, press forming and RTM, and short glass fibre systems in various resins, whilst Mespoulet et al. concentrated their efforts on a UD carbon/epoxy system.
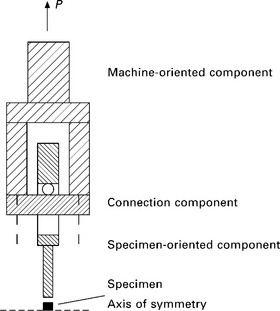
The specimens developed by Mespoulet et al. (2000) for both tension and compression are shown in Fig. 6.34. Compression tests were carried out between hardened steel plates in a four-pillar die set, but tensile tests required a specially designed loading jig, shown in Figure 6.35, in order to ensure perfect alignment of the specimen with the load line. It was found that the elastic constants could be determined using the square block designs but that determination of the true failure stress required the use of the waisted design, which was also suitable for measurement of the elastic constants.
A similar approach to tensile through-thickness property measurement to that used by Ferguson et al. (1998) and Mespoulet et al. (2000) has been adopted as ASTM D7291M. The main difference in the ASTM standard is that the specimens are of circular cross-section, rather than square.
Flexural loading
Flexural loading of curved shapes, as shown in Fig. 6.36, to obtain an interlaminar tensile stress is discussed by Kedward et al. (1989). Jackson and Martin (1993) developed an interlaminar test using tensile loading of the L-shaped coupon, shown in Fig. 6.37(a). Subsequently Jackson and Ifju (1996) published details of a four-point flexure version of the test. This is standardised as ASTM D6415M and shown in Fig. 6.37(b). Unfortunately, the interlaminar tensile strength measured is highly dependent on laminate quality, ply thickness, void content and geometrical factors such as the overall thickness and radius of curvature of the L-bend.
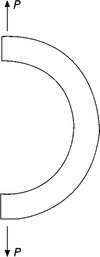
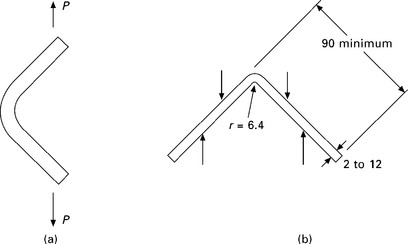
6.37 Interlaminar tensile tests: (a) Jackson and Martin (1993); (b) Jackson and Ifju (1996). Dimensions in mm.
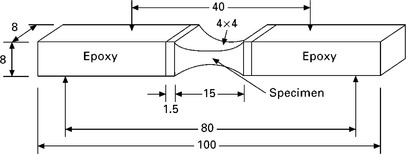
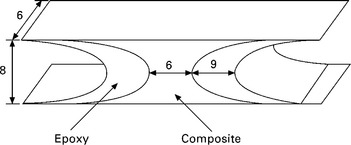
Mespoulet (1998) developed a flexural specimen consisting of a central region of composite machined from a 160-ply, 20 mm thick UD laminate of CFRP bonded to epoxy resin ‘arms’, as shown in Fig. 6.38. The orientation of the fibres when under test could be in the transverse or through-thickness directions, dependent upon how the specimen is oriented with respect to the loading jig. Specimens were tested in four-point flexure with an outer span of 80 mm and an inner span of 40 mm to determine the through-thickness (1–3) failure stress.
6.4.2 Shear testing
A range of test methods can be used to determine interlaminar shear strength:
• Iosipescu (ASTM D5379M)
• short beam shear (ASTM D2344M)
The Iosipescu test
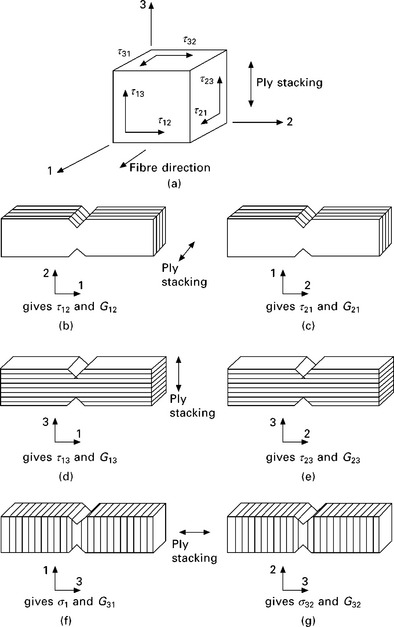
The dimensions of the Iosipescu specimen mean that laminate out-of-plane properties, indicated in Fig. 6.39, can only be investigated by manufacturing very thick laminates or by bonding several thin laminates on top of each other. Examples of such work include Matthews et al. (1992), Hodgkinson et al. (1993), Zhou et al. (1995) and Oh et al. (1999). Matthews et al. (1992) and Hodgkinson et al. (1993) investigated in-plane and out-of-plane shear properties of thick woven glass-epoxy laminates and stacked UD CFRP laminates, respectively. Zhou et al. (1995) used bonded dummy layers of woven glass/epoxy prepreg to investigate the out-of-plane shear properties of a carbon/epoxy laminate, whilst Oh et al. (1999) carried out their investigation using thick carbon/epoxy laminates.
The short beam shear test
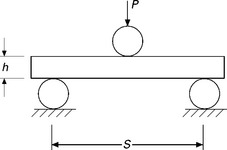
The short beam shear test is a three-point flexure test, as shown in Fig. 6.40, with a span-to-thickness ratio of four. The test gives only a qualitative measure of the interlaminar shear strength but remains popular either for quality control or for investigating matrix and interface dominated behaviour. Under load, a complex stress state exists in the specimen, involving interlaminar shear stresses, contact stresses at the loading points and flexural stresses. Consequently failure is frequently by invalid modes due to local contact crushing or flexural failure, rather than interlaminar failure. Data reduction is based on peak load and specimen cross-sectional dimensions:
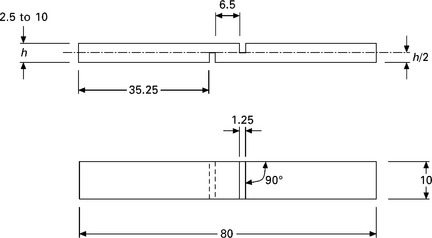
Double notch compression (DNC) test
Shaw and Sims (2003) reported a ‘round-robin’ exercise on a double notch compression specimen, shown in Fig. 6.41, which has flat-bottomed notches machined on each side, to precisely half-way through the thickness. The method used was similar to that in ASTM D3846-94, the specimen being tested in compression using a version of the ASTM D695 jig. Failure is ideally by interlaminar fracture between the two notches. However, their results showed that failure loads and modes are very dependent on specimen manufacture, particularly on the accurate machining of the notches. The high stress concentrations generated at the notches mean that the measured interlaminar shear strength is severely underestimated for most UD fibre composites.
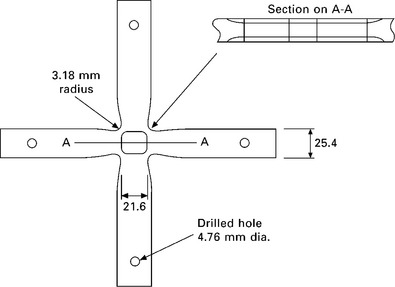
The inclined waisted shear specimen (IWS)
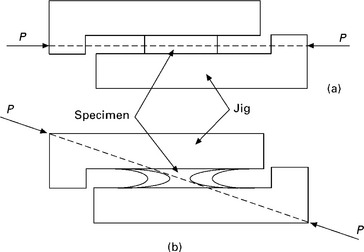
The IWS was developed by Mespoulet et al. (2000), using finite element analysis. Two specimens were proposed: one, a parallel-sided block for shear modulus measurements only, whilst the IWS was developed for shear strength determination. The specimen, shown in Fig. 6.42, had a cross-section of 6 × 8 mm and a waisted 6 mm gauge section surrounded by epoxy resin, which was also waisted to minimise shear stress concentrations and transverse tensile stresses. Fibres within the laminate specimens could be arranged so that in-plane, G21, τ21 and through-thickness G31, G32, τ31, τ32 shear properties were accessible. The specimens were bonded to steel rails, as shown in Fig. 6.43, which were loaded in compressive mode within a four pillar die set. The parallel-sided specimen was loaded in direct compression, as in Fig. 6.43(a), whilst the IWS was loaded so as to apply a closing force, normal to the specimen longitudinal axis, as indicated in Fig. 6.43(b).
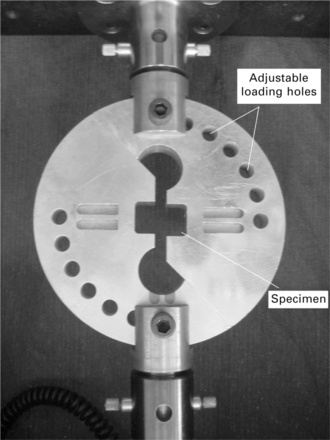
Arcan jig
The Arcan jig, developed by Arcan et al. (1978) for shear testing of polymers, was subsequently applied to fibre reinforced composite materials (Voloshin and Arcan, 1980). Figure 6.44 shows the jig which has several adjustable loading holes, the extremes of which allow tension and shear to be applied to the specimen. When loaded as shown, the specimen is loaded in pure shear, but when the jig is rotated through 90 °, a tensile load is applied.
6.5 Biaxial in-plane testing
6.5.1 Tubular specimens
Tubes, as described in ASTM D5448M and shown in Fig. 6.19, are an obvious choice of test piece for composites which are used as cylindrical components. The complexities of the manufacturing process and difficulties in controlling quality are serious issues which tend to mitigate against their general use in biaxial testing. However, UD 90 ° ply cylindrical specimens under combined torsion and axial tension or compression were used by Swanson et al. (1987) to examine matrix controlled biaxial failure. Arbitrary biaxial in-plane loading of laminates can be obtained by internal pressurisation of tubular specimens under combined torsion and axial tension or compression. A review of this work has been presented by Swanson and Qian (1992) and additional work using a similar approach has been presented by Cohen (2002).
The analysis of internally pressurised tubes normally assumes that plane stress applies. For thin walled tubes, this assumption is correct when comparing the out-of-plane (radial) stress with the average in-plane stress over the thickness. However, in multi-directional laminates the local inplane ply stresses transverse to the fibres are significantly lower than the average in-plane stress, so that the stress state of the inner plies is more or less three-dimensional, with the outer plies in plane stress. It is probable that the out-of-plane compressive stress delays failure of the inner plies, so that failure initiates at the outside of the tube.
6.5.2 Cruciform specimens
Cruciform specimens allow testing under arbitrary biaxial (in-plane) loads. The design and application of such specimens have been discussed by Welsh and Adams (2002) and Smits et al. (2006). Major advantages of cruciform specimens are their relative ease of manufacture and that they are representative of the material in flat laminates. Complicating factors are the need for machining a reduced thickness in the gauge section and corner fillets, as shown in Fig. 6.45, which are required to prevent premature failure outside the gauge section.
6.45 Typical cruciform specimen with thickness reduction of the gauge section. Dimensions in mm. Adapted from Welsh and Adams (2002).
6.5.3 Off-axis specimens
Biaxial stress states can be achieved by the axial loading of UD coupons with the fibres at an angle to the loading direction. Loading at off-axis angles between 30 ° and 90 ° allows arbitrary combinations of shear strain and transverse normal strain, with negligible strain in the fibre direction. At an off-axis angle of about 8 ° for CFRP and 15 ° for GFRP, the transverse normal strain is zero, but the shear strain is three to four times that in the fibre direction. Hence the interest in 10 ° off-axis specimens for testing inplane shear strength (Chamis and Sinclair, 1977; Pierron and Vautrin, 1996a, 1996b). A major problem with off-axis specimens is premature failure at the loading clamps. It has been shown that the use of end-tabs, cut at an oblique angle, can help resolve the problem (Sun and Chung, 1993).
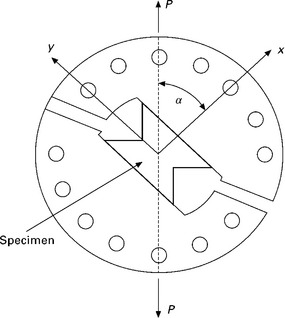
6.5.4 Biaxial in-plane Arcan test
By the addition of a series of loading holes to the Arcan jig, arbitrary combinations of shear and tension transverse to the fibres can be obtained (Voloshin and Arcan, 1980), as indicated in Fig. 6.46.
6.6 Triaxial testing
The main problem in triaxial testing is obtaining a uniform stress state, making the study of failure difficult.
6.6.1 Cruciform specimens
Welsh and Adams (2000, 2001) attempted to test cruciform specimens under triaxial loading by adding load actuators in the specimen thickness direction. They reported that the out-of-plane compressive strength was virtually insensitive to in-plane loading, possibly due to the constraint on the in-plane strains offered by the cross-ply layup used. Attempts to measure the out-ofplane tensile strength in the presence of in-plane loads were unsuccessful, due to failure of the bond between the out-of-plane load attachments and the gauge section.
6.6.2 Constrained out-of-plane compression
A uniform triaxial stress state can be obtained by the constrained compression of a rectangular block of orthotropic material, as shown in Fig. 6.47. A transversely isotropic material loaded in the plane of symmetry but allowed to expand in the axial direction, neglecting friction, produces biaxial stresses with a ratio of 3:1 in the 2–3 plane. Constraining expansion in the axial direction gives a triaxial stress state. Collings (1974), performing these tests on unidirectional CFRP, observed a transition from a failure plane parallel to the fibres in unconstrained specimens to a failure plane fracturing the fibres in the constrained specimen, resulting in an order of magnitude increase in compressive strength. Similar effects were observed by Henriksson (1990) in out-of-plane compression of cross-ply CFRP laminates.
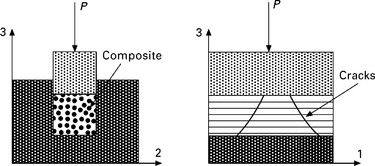
6.47 Out-of-plane compression of a constrained specimen. Adapted from Olsson (2011).
6.7 Concluding comments
Whilst there are numerous pitfalls related to the mechanical testing of composite materials, there is now a great deal of advice available within the various testing standards to inform testing personnel of what is considered to be best practice. This does not mean that there is no room for improvement. For example, some of the standardised test methods do not meet, in practice, the specific requirements of a pure and uniform stress field in the test section. It is as well to be wary; simply following a standard may produce results but not deliver what is expected.
There is also ample evidence in the results from various ‘round-robin’ trials conducted over the years that the human element involved in most testing environments is a major weakness in the system. In these trials it is typical for a number of different laboratories to be supplied with material/specimens for mechanical tests to be carried out to the same testing standard. It is quite remarkable how wide the disparity turns out to be in the results from different laboratories, whilst frequently being consistently close within any particular laboratory. This suggests a number of possibilities: that different laboratories interpret the details of the test method differently; that different laboratories have developed local rules relating to test methods; that the person responsible for carrying out the tests in any particular laboratory has in some way influenced the results; that a systematic error has been introduced. Variations may possibly result from a combination of all these.
Most current test method development programmes make use of finite element analysis to model the specimen and test jig. This approach allows the detailed design of the test method to be refined in a systematic way, ensuring, for example, that unwanted stress concentrations are avoided and a pure and uniform stress field exists over a significant portion of the test section.
There is also increasing interest in what is generally referred to as ‘virtual testing’. Here the finite element analysis approach is taken a step further, allowing computer simulated mechanical tests to be carried out. Such a development has enormous cost and time saving implications compared to conducting practical tests. Although still in its relative infancy, virtual testing is predicted to replace a large proportion of the current mechanical testing effort at some stage in the future. This is hardly surprising when it is estimated that in the development of the typical large airframe, some 104 coupon-type tests are carried out, together with tests on components and complete structures such as tails, wing boxes and fuselages, in order to achieve certification. Any virtual model is, however, only an approximation of reality. It is, therefore, always necessary to ensure that the results from computer models compare well with real-world behaviour. It appears to be safe to say that real-life testing will continue for the foreseeable future, if only to provide validating data for computer simulations.
6.8 References
Arcan, M., Hashin, Z., Voloshin, A. A method to produce uniform plane-stress states with applications to fiber-reinforced materials. Experimental Mechanics. 1978; 18:141–146.
ASTM D695Standard test method for compressive properties of rigid plastics. 100 Barr Harbor Drive, West Conshohocken, PA 19428, USA: American Society for Testing and Materials, 2010. [Vol. 08.01].
ASTM D790MStandard test methods for flexural properties of unreinforced and reinforced plastics and electrical insulating materials. 100 Barr Harbor Drive, West Conshohocken, PA 19428, USA: American Society for Testing and Materials, 2010. [Vol. 08.01].
ASTM D2344MStandard test method for short-beam strength of polymer matrix composite materials and their laminates. 100 Barr Harbor Drive, West Conshohocken, PA 19428, USA: American Society for Testing and Materials, 2006. [Vol. 15.03].
ASTM D3039MStandard test method for tensile properties of polymer matrix composite materials. 100 Barr Harbor Drive, West Conshohocken, PA 19428, USA: American Society for Testing and Materials, 2008. [Vol. 15.03].
ASTM D3171Standard test methods for constituent content of composite materials. 100 Barr Harbor Drive, West Conshohocken, PA 19428, USA: American Society for Testing and Materials, 2006. [Vol. 15.03].
ASTM D3410MStandard test method for compressive properties of polymer matrix composite materials with unsupported gage section by shear loading. West Conshohocken, PA 19428, USA: American Society for Testing and Materials, 2008. [100 Barr Harbor Drive, Vol. 15.03].
ASTM D3518MStandard test method for in-plane shear response of polymer matrix composite materials by tensile test of a ±45 ° laminate. West Conshohocken, PA 19428, USA: American Society for Testing and Materials, 2007. [100 Barr Harbor Drive, Vol. 15.03].
ASTM D3846Standard test method for in-plane shear strength of reinforced plastics. West Conshohocken, PA 19428, USA: American Society for Testing and Materials, 2008. [100 Barr Harbor Drive, Vol. 08.02].
ASTM D4255MStandard test method for in-plane shear properties of polymer matrix composite materials by the rail shear method. West Conshohocken, PA 19428, USA: American Society for Testing and Materials, 2007. [100 Barr Harbor Drive, Vol. 15.03].
ASTM D5229MStandard test method for moisture absorption properties and equilibrium conditioning of polymer matrix composite materials. West Conshohocken, PA 19428, USA: American Society for Testing and Materials, 2010. [100 Barr Harbor Drive, Vol. 15.03].
ASTM D5379MStandard test method for shear properties of composite materials by the V-notched beam method. West Conshohocken, PA 19428, USA: American Society for Testing and Materials, 2005. [100 Barr Harbor Drive, Vol. 15.03].
ASTM D5448MStandard test method for in-plane shear properties of hoop wound polymer matrix composite cylinders. West Conshohocken, PA 19428, USA: American Society for Testing and Materials, 2006. [100 Barr Harbor Drive, Vol. 15.03].
ASTM D6272MStandard test method for flexural properties of unreinforced and reinforced plastics and electrical insulating materials by four-point bending. West Conshohocken, PA 19428, USA: American Society for Testing and Materials, 2010. [100 Barr Harbor Drive, Vol. 15.03].
ASTM D6415MStandard test method for measuring the curved beam strength of a fiber-reinforced polymer-matrix composite. West Conshohocken, PA 19428, USA: American Society for Testing and Materials, 2006. [100 Barr Harbor Drive, Vol. 15.03].
ASTM D6641MStandard test method for compressive properties of polymer matrix composite materials using a combined loading compression (CLC) test fixture. West Conshohocken, PA, 19428, USA: American Society for Testing and Materials, 2009. [100 Barr Harbor Drive, Vol. 15.03].
ASTM D7078MStandard test method for shear properties of composite materials by v-notched rail shear method. West Conshohocken, PA 19428, USA: American Society for Testing and Materials, 2005. [100 Barr Harbor Drive, Vol. 15.03].
ASTM D7264MStandard test method for flexural properties of polymer matrix composite materials. West Conshohocken, PA 19428, USA: American Society for Testing and Materials, 2007. [100 Barr Harbor Drive, Vol. 15.03].
ASTM D7291MStandard test method for through-thickness ‘flatwise’ tensile strength and elastic modulus of a fiber reinforced polymer matrix composite material. West Conshohocken, PA 19428, USA: American Society for Testing and Materials, 2007. [100 Barr Harbor Drive, Vol. 15.03].
Broughton, W.R. Shear. In: Hodgkinson J.M., ed. Mechanical Testing of Advanced Fibre Composites. Cambridge: Woodhead; 2000:100–123.
Broughton, W.R., Kumosa, M., Hull, D. Analysis of the Iosipescu shear test as applied to unidirectional carbon-fibre reinforced composites. Composites Science and Technology. 1990; 38:299–325.
Camponeschi, E.T. Compression of composite materials: a review. In: O’Brien T., ed. Composite Materials: Fatigue and Fracture. ASTM STP1110, Philadelphia: American Society for Testing and Materials; 1991:550–578.
Chamis, C.C., Sinclair, J.H. 10-deg off-axis test for shear properties in fiber composites. Experimental Mechanics. 1977; 17(9):339–346.
Cheung, N.-H.H.The Compression Behaviour of Thick Composite Laminates. London: Department of Aeronautics, Imperial College, 2006. [MEng Project Report].
Cohen, D. Multi-axial tube test method. In: Zureick A., Nettles A.T., eds. Composite Materials: Testing, Design, and Acceptance Criteria. ASTM STP1416, Philadelphia: American Society for Testing and Materials; 2002:17–29.
Collings, T.A. Transverse compressive behaviour of unidirectional carbon fibre reinforced plastics. Composites. 1974; 5(3):108–116.
Conant, N.R., Odom, E.M. An improved Iosipescu shear test fixture. Journal of Composites Technology and Research. 1995; 17(1):50–55.
Daniel, I.M., Hsiao, H.M., Wooh, S.C. A new composite test method for thick composites. Journal of Composite Materials. 1995; 29(13):1789–1806.
Ferguson, R.F., Hinton, M.J., Hiley, M.J. Determining the through-thickness properties of FRP materials. Composites Science and Technology. 1998; 58(9):14111420.
Grothaus, R., Hodgkinson, J.M., Kocker, K. Interpretation of flexural tests using Weibull strength theory. Proc 3rd International Conference on Deformation and Fracture of Composites, Guildford, UK, 1995:269–276.
Häberle, J.G., Matthews, F.L. Studies on compressive failure in unidirectional CFRP using an improved test method. Proc European Conference on Composite Materials-4, Stuttgart, 1990:517–523.
Hannah, S.L.Compression Strength of Thick Composite Laminates. London: Department of Aeronautics, Imperial College, 2007. [MEng Project Report].
Henriksson, A.Transverse Compressive Behaviour of Carbon-Epoxy Laminates and its Influence of Contact Laws, FFA TN 1990-26. Bromma: The Aeronautical Research Institute of Sweden (FFA), 1990.
Hodgkinson, J.M., FlexureHodgkinson J.M., ed. The Mechanical Testing of Advanced Fibre Composites, 2000:124–142. [Cambridge, Woodhead].
Hodgkinson, J.M., Bertholet, H., Keunings, R. Out-of-plane shear property measurements on CFRP laminates. Proc 2nd International Conference on Deformation and Fracture of Composites, 1993:19.1–19.10. [Manchester, UK].
ISO 178:2010, ‘Plastics – Determination of flexural properties’, International Organisation for Standardisation.
ISO 527-5:2009, ‘Plastics – Determination of tensile properties: Test conditions for unidirectional fibre-reinforced plastic composites’, International Organisation for standardisation.
ISO 14125:1998, ‘Fibre-reinforced plastic composites. Determination of flexural properties’, International organisation for standardisation.
ISO 14126:1999, ‘Fibre-reinforced plastic composites. Determination of compressive properties in the in-plane direction’, international organisation for standardisation.
ISO 14129:1997, ‘Fibre-reinforced plastic composites. Determination of the in-plane shear stress/shear strain response, including the in-plane shear modulus and strength, by the plus or minus degree tension test method’, International Organisation for Standardisation.
Jackson, K.E., Kellas, S., Morton, J. Scale effects in the response and failure of laminates loaded in tension and in flexure. Journal of Composite Materials. 1992; 26(18):2674–2705.
Jackson, W.J., Ifju, P.G. Through-the-thickness tensile strength of textile composites. In: Deo R.B., Saff C.R., eds. Composite Materials and Design. ASTM STP1274, Philadelphia: American Society for Testing and Materials; 1996:218–238.
Jackson, W.J., Martin, R.H. An interlaminar tensile strength specimen. In: Composite Materials and Design. ASTM STP1206, Philadelphia: American Society for Testing and Materials; 1993:333–354.
Kedward, K.T., Wilson, R.S., McLean, S.K. Flexure of simply curved composite shapes. Composites. 1989; 20(6):527–536.
Kellas, S., Morton, J., Jackson, K.E. Damage and failure mechanisms in scaled angled-ply laminates. In: Stinchcomb W., Ashbaugh N.E., eds. Fourth Composites Symposium on Fatigue and Fracture. ASTM STP 1156, Philadelphia: American Society for Testing and Materials; 1993:257–280.
Lavoie, J.A., Soutis, C., Morton, J. Apparent strength scaling in continuous fibre composite laminates. Composites Science and Technology. 2000; 60(2):283–299.
Lee, J., Soutis, C. Thickness effect on the compressive strength of T800/924C carbon fibre-epoxy laminates. Composites Part A: Science and Manufacturing. 2005; 36:213–227.
Lee, J., Soutis, C. A study on the compressive strength of thick carbon fibre-epoxy laminates. Composites Science and Technology. 2007; 67:2015–2026.
Manders, P.W., Kowalski, I.M. The effect of small angular fiber misalignments and tabbing techniques on the tensile strength of carbon fiber composites. 32nd International SAMPE Symposium, Anaheim, CA, 1987:985–1007.
Matthews, F.L. Compression. In: Hodgkinson J.M., ed. Mechanical Testing of Advanced Fibre Composites. Cambridge: Woodhead; 2000:75–99.
Matthews, F.L., Hodgkinson, J.M., Ayache, S. In-plane and out-of-plane property measurements on thick woven glass/polyester laminated composites. Proc Composites Testing and Standardisation, Amsterdam, 1992:277–286.
Mespoulet, S. Design, development and implementation of test methods for determination of through-thickness properties of laminated composites, 1998. [PhD thesis, Imperial College London].
Mespoulet, S., Hodgkinson, J.M., Matthews, F.L., Hitchings, D., Robinson, P. Design, development and implementation of test methods for determination of through thickness properties of laminated composites. Plastics, Rubber and Composites. 2000; 29(9):496–502.
Morley, A. Strength of Materials, 9th. London: Longmans, 1940.
Oh, J.H., Kim, J.K., Lee, D.G., Jeong, K.S. Interlaminar shear behavior of thick carbon/epoxy composite materials. Journal of Composite Materials. 1999; 33(22):2080–2115.
Olsson, R. A survey of test methods for multiaxial and out-of-plane strength of composite laminates. Composites Science and Technology. 2011; 71(6):773–783.
Pierron, F. Saint-Venant effects in the Iosipescu specimen. Journal of Composite Materials. 1998; 32(22):1986–2015.
Pierron, F., Vautrin, A. The 10 ° off-axis tensile test: a critical approach. Composites Science and Technology. 1996; 56:483–488.
Pierron, F., Vautrin, A. A new methodology for composite shear strength measurement using the 10 ° off-axis tensile test. Proc European Conference on Composite Materials-7, London, 1996:119–124.
Pierron, F., Vautrin. Measurement of the in-plane shear strengths of unidirectional composites with the Iosipescu test. Composites Science and Technology. 1997; 57(12):1653–1660.
Shaw, R.M., Sims, G.D.Round-robin validation exercise for the determination of through-thickness shear strength in compression. National Physical Laboratory, 2003. [Measurement Note, MATC (MN) 48].
Shaw, R.M., Sims, G.D.Understanding compression testing of thick polymer matrix composites. National Physical Laboratory, 2005. [Measurement Note, DEPC-MN 019].
Smits, A., Van Hemelrijck, D., Philippidis, T.P., Cardon, A. Design of a cruciform specimen for biaxial testing of fibre reinforced composite laminates. Composites Science and Technology. 2006; 66(7–8):964–975.
Soutis, C., Lee, J., Kong, C. Size effects on compressive strength of T300/924C carbon fibre-epoxy laminates. Plastics Rubber and Composites. 2002; 3(8):364–370.
Sun, C.T., Chung, I. An oblique end-tab design for testing off-axis composite specimens. Composites. 1993; 24(8):619–623.
Swanson, S.R., Qian, Y. Multiaxial characterization of T800/3900-2 carbon/epoxy composites. Composites Science and Technology. 1992; 43(2):107–203.
Swanson, S.R., Messick, M.J., Tian, Z. Failure of carbon/epoxy lamina under combined stress. Journal of Composite Materials. 1987; 21(7):619–630.
Voloshin, A., Arcan, M. Failure of unidirectional fiber-reinforced materials – new methodology and results. Experimental Mechanics. 1980; 29(8):280–284.
Welsh, J.S., Adams, D.F. Development of an electromechanical triaxial test facility for composite materials. Experimental Mechanics. 2000; 40(3):312–320.
Welsh, J.S., Adams, D.F. Biaxial and triaxial failure strengths of 6061-T6 aluminium and AS4/3501-6 carbon/epoxy laminates obtained by testing thickness tapered cruciform specimens. Journal of Composites Technology Research. 2001; 23(2):111–121.
Welsh, J.S., Adams, D.F. An experimental investigation of the biaxial strength of IM6/3501-6 carbon/epoxy cross-ply laminates using cruciform specimens. Composites Part A: Science and Manufacturing. 2002; 33(6):829–839.
Wisnom, M.R., Atkinson, J.A. Reduction in tensile and flexural strength of unidirectional glass fibre-epoxy with increasing specimen size. Composite Structures. 1997; 38:405–412.
Wisnom, M.R., Khan, B., Hallett, R. Size effects in unnotched tensile strength of unidirectional and quasi-isotropic carbon/epoxy composites. Composite Structures. 2008; 84(1):21–28.
Zhou, G., Green, E.R., Morrison, C. In-plane and interlaminar shear properties of carbon/epoxy laminates. Composites Science and Technology. 1995; 55(2):187–193.