Testing the toughness of polymer matrix composites
Abstract:
This chapter presents an overview of experimental methods of fracture toughness determination for the interlaminar and in-plane modes of failure of laminated composites. All relevant information regarding specimen configurations, testing procedures and data reduction is covered. Interlaminar fracture toughness testing is discussed with reference to the most commonly used standardised testing procedures. Methods of fracture toughness measurement for intralaminar matrix failure and translaminar fibre failure are relatively immature when compared to the interlaminar field. The most relevant sources of information available in the literature are used to review these areas where there is a lack of standardised test methods.
5.1 Introduction
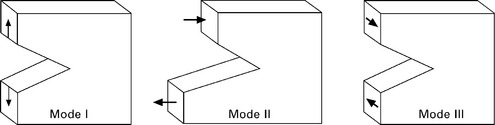
In order to quantify the damage tolerance of a composite structure, it is necessary to be able to predict the conditions under which a defect or crack in the structure starts to propagate and subsequently lead to failure. Fracture toughness testing addresses this problem by providing material properties in the form of critical stress intensity factors, describing the local stress state close to a crack tip, and critical strain energy release rates, giving a global description of the fracture process. To fully characterise a material, these properties need to be obtained for all three (and combinations) of the fracture modes shown in Fig. 5.1.
Considering the internal architecture of a laminated continuous fibre reinforced composite, the ply-level fracture characteristics can be divided into the three categories shown in Fig. 5.2:
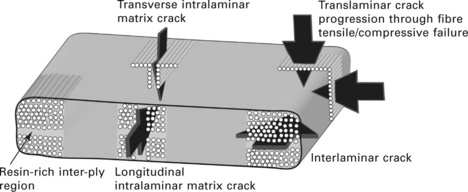
1. Interlaminar fracture. It is well known that composites offer exceptional in-plane strengths. However, the laminated nature of these materials means they suffer from relatively poor out-of-plane properties and a subsequent tendency to delaminate.
2. Intralaminar fracture. Matrix cracks can propagate between the fibres through the thickness of the laminate, rather than between the plies. A feature of longitudinal intralaminar fracture is large-scale bridging. When this happens the resistance curve, or the R-curve, which characterises the fracture toughness of the material as a function of crack length, is no longer a material property.
3. Translaminar fracture. Fibre-breaking cracks are the mechanisms resulting in the highest amounts of energy dissipation within a composite laminate. The fracture toughnesses of these modes of failure are typically several orders of magnitude larger than that of the interlaminar and intralaminar failure modes.
This chapter presents an overview of testing methods commonly used to characterise the fracture toughness associated with these failure modes in laminated composites.
5.2 Interlaminar fracture toughness testing
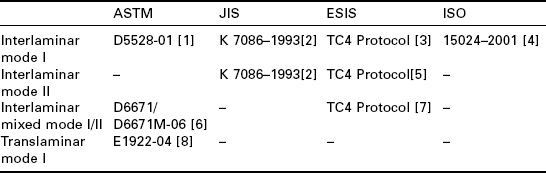
Relative to the intralaminar and translaminar modes of failure, interlaminar fracture toughness testing methods are well established. The most widely used tests, with information regarding data reduction are presented in the following sections. This data is summarized in Table 5.1. For more detailed information regarding specimen dimensions or specific experimental procedures, the reader is referred to the appropriate testing standard.
5.2.1 Mode I testing
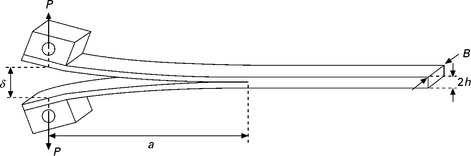
Double cantilever beam
The double cantilever beam (DCB) specimen, shown in Fig. 5.3, is the most widely used specimen for the measurement of mode I interlaminar fracture toughness. A thin non-stick film is placed between the central plies during curing to introduce a pre-crack, and before the test the sides of the specimen are usually marked with a millimetre scale to quantitatively track crack growth during testing. The specimen is then loaded via the end-blocks shown in the figure. Alternatively, piano hinges can be used for this purpose. The ASTM D5528 [1] standard gives three methods of data reduction that were evaluated by a round-robin test [2].
The methods of calculating the strain energy release rate, G, for the DCB specimen are all based on the following equation:
where P is the applied load, B is the specimen width, C is the specimen compliance (the ratio of specimen displacement to applied load, δ/P) and a is the crack length.
Using beam theory to determine C for the DCB specimen, considering the arms of the specimen to be clamped at the delamination front, gives:
where P and δ are the values associated with crack growth. In reality, the arms of the specimen are not perfectly built in and rotations may occur at the crack tip. This is accounted for by using the modified beam theory method of data reduction, in which the DCB specimen is treated as if it had a longer crack length:
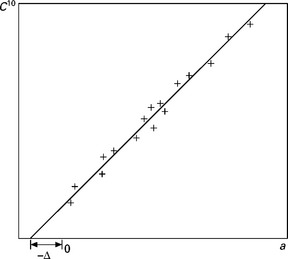
The correction factor Δ can be determined by plotting the cube root of the experimentally determined compliance, C1/3, as a function of measured crack length as shown in Fig. 5.4.
The compliance calibration method, also known as Berry’s method [3], assumes that the specimen compliance, C, is proportional to an. By constructing a plot of log(C) versus log(a), the exponent n can be determined from the gradient of a least squares linear fit of this data, and the mode I interlaminar fracture toughness is calculated from:
The critical energy release rates, GIc, determined by modified beam theory and the compliance calibration method are usually with a few percent of each other [2].
A modified compliance method can also be used whereby the equation for G does not explicitly involve crack length. The cube root of compliance, C1/3, is assumed to be directly proportional to the crack length, a. The constant of proportionality is determined from a compliance calibration plot, as shown in Fig. 5.5, where the crack length, a, is normalised by specimen thickness, h. The critical strain energy release rate is then calculated as:
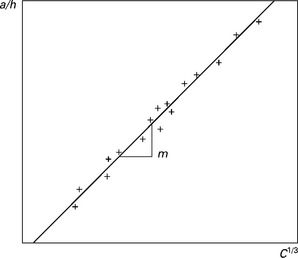
5.5 Determination of m for Equation [5.5].
Correction factors have been developed to account for stiffening of the specimen arms due to the end-blocks used to apply load, shown in Fig. 5.3, rotation of the end-blocks, and shortening of the moment arm at large displacements during testing. The parameter N has been derived to account for the corrected displacement, such that:
and a parameter F has been derived to correct the crack length measured during testing:
5.2.2 Mode II testing
End-loaded split
The end-loaded split (ELS) specimen configuration, used for the measurement of mode II interlaminar fracture toughness, is essentially the same as for the DCB; however, the load is introduced via a single end-block as shown in Fig. 5.6. Values of mode II critical energy release rate, GIIc, can be calculated using either expressions derived from beam theory or by compliance calibration. Similarly to the mode I tests, a value of the correction factor Δ must again be calculated for the modified beam theory method. The mode II interlaminar fracture toughness is given by:

where E1f is the flexural modulus of the composite obtained from a three-point bend test. There seems to be no best answer as to what Δ should be. It has been thought that multiplying the value used for mode I tests (in Equation [5.3]) by 0.42 gives a good approximation [2], or if no data is available then Δ is set equal to zero.
Similarly to the DCB test, a correction factor F can be used for correction of large displacements and end-block effects:
Another approach to calculating GIIc is by using experimental compliance calibration. The measured experimental compliance is plotted against a3; the gradient m of this plot is then used in the following expression:
Four-point end-notched flexure
The four-point end-notched flexure (4ENF) configuration is shown in Fig. 5.7. Specimen preparation is much the same as for the DCB and ELS; however, no end-blocks are applied. The specimen is subjected to four-point loading, and values of GIIc are calculated using the following expression:
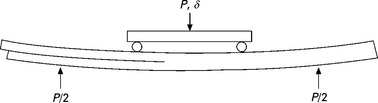
where m is the slope of the compliance versus crack length plot.
5.2.3 Mixed mode I/II testing
Mixed mode bending (MMB)
The mixed mode bending test requires a specialised fixture and the use of a DCB type specimen, as detailed in Fig. 5.8. The fixture is loaded as shown, and introduces both mode I and mode II loading into the specimen. The desired mode mixture is achieved by adjusting the distance, c, in accordance with:
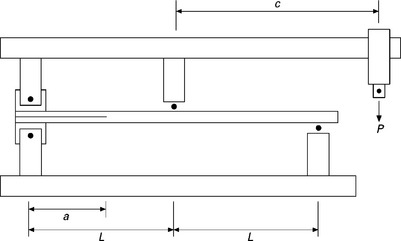
The expression for c determined by mode-mixture can become less accurate at low mode II contributions owing to crack-tip rotation [2]. The mixed mode fracture toughnesses are then calculated using the following equations [2]:
where I is the second moment of area for one half of the specimen and L is the half-span length of the MMB fixture. Similarly to the ELS, the flexural modulus, E1f, is required, and in this case the correction Δ is calculated using the following expressions:
where E11 and E22 are the longitudinal and transverse elastic moduli and G13 is the out-of-plane shear modulus.
5.3 Translaminar fracture toughness testing
As the name suggests, translaminar fracture is the propagation of damage through all of the plies in a laminate such that the measured toughness of the composite is the result of constituent plies failing in any one or a combination of the individual in-plane failure modes discussed in the introduction to this chapter. Thus the measured property in this case in not a material property, but is lay-up dependent.
5.3.1 Mode I
Measurements of translaminar fracture toughness have been made using several specimen configurations: compact tension [4–12], centre-cracked tension [5, 7, 8, 10, 13–15], three-point bend [7, 8, 16], four-point bend [12], singleedge-notched tension [10, 17] and double-edge-notched tension [12].
Problems encountered with some specimen configurations during round-robin testing, namely arm failure of compact tension specimens and damage beneath the central loading point on the three-point bend specimens, led to the adoption of the eccentrically loaded, single-edge-notch tension, ESE(T), specimen shown in Fig. 5.9 [18]. Work performed since its original inception [19] extended the scope of materials accepted to include FRP pultrusions.
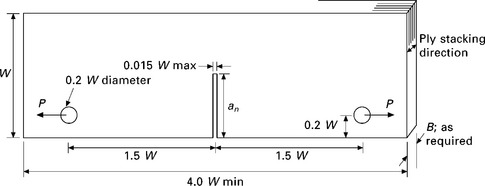
5.9 ECT recommended specimen dimensions [20].
Eccentrically loaded single-edge-notch tension
The ASTM E1922 [20] is the only standardised test for measurement of translaminar fracture toughness of laminated composites and recommends the use of the ESE(T) specimen; however, it is stated that other specimen configurations may be used.
The recommended specimen dimensions are shown in Fig. 5.9. The width W is recommended to be between 25 and 50 mm, the specimen thickness, B, can be as low as 2 mm, and the notch length, an, can be between 0.5 and 0.6 W (made by any process that produces a narrow slit; a diamond impregnated copper slitting saw and jeweller’s saw are both recommended for this purpose; it is stated that the profile of the notch tip is unimportant) [20].
The standard recommends calculation of the critical stress intensity factor from:
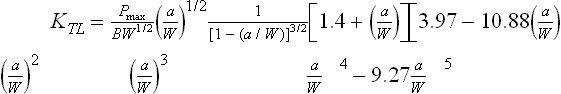
where Pmax is the maximum load achieved by the specimen during the test and B, W and a are defined in Fig. 5.9. All specimens must meet a validity criterion to ensure that the size of the damage zone around the initial notch tip is not too large when P = Pmax, the measured KTL is deemed to give an accurate measurement of laminate fracture toughness if the following relationship is satisfied:
where Δdn and dn−0 are defined in the representative load displacement curve shown in Fig. 5.10. If the criterion outlined in Equation [5.17] is not satisfied, the damage zone around the notch may be too large to obtain a valid measure of KTL [20].
The standard is limited in the sense that it only covers fracture toughness determination for the peak load measured during testing. This is a useful parameter for materials selection, or as the standard states, for quantifying effects of fibre and matrix variables and stacking sequence. However, R-curve effects have been measured from testing of composite laminates [21–23] and successfully used to numerically reproduce experimentally obtained results [24]. Given the usefulness of these properties, it is thought that the scope of the E1922 procedure may need extension in the future to cover propagation measurements of fracture toughness.
5.4 Ply-Level Fracture Toughness Testing
As discussed in Section 5.3, when a composite laminate undergoes translaminar fracture, energy is dissipated in one or more of the individual ply-level failure modes illustrated in Fig. 5.2: transverse and longitudinal matrix failure and fibre tensile/compressive failure. Advances in numerical modelling techniques have created a need for measurements of toughness for each of these individual ply failure modes but currently there are no standardised testing procedures to obtain them. This section aims to summarise the approaches commonly used in the literature to obtain these properties.
5.4.1 Matrix dominated failure modes
Matrix cracks may propagate along the fibres either longitudinally or transversely, as shown in Fig. 5.2. Typically transverse matrix cracks have a higher toughness [16, 25] than their longitudinal counterparts. Work in this area is lacking, perhaps because these failure modes are not seen to be as problematic as the interlaminar fracture. Nevertheless, these modes of damage are perennially present during translaminar fracture of laminates and impact type problems, thus the toughnesses associated with intralaminar matrix cracking are both important material parameters for modelling and useful in the materials selection process.
Mode I longitudinal intralaminar matrix failure
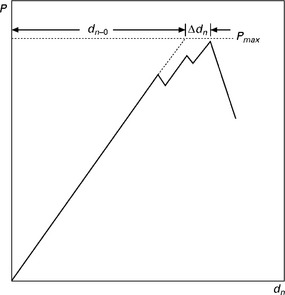
When an intralaminar crack propagates parallel to the fibres in a composite, significant fibre bridging occurs; depending on the size of the bridging zone, this can account for a major part of the energy dissipated as the fracture progresses. When the size of the fibre-bridging zone is comparable to the specimen size, as shown in Fig. 5.11, large-scale bridging (LSB) occurs. In this case, the initiation and steady state propagation energy release rates will be intrinsic material properties, but the R-curve is no longer valid. The morphology of the R-curve under LSB conditions is dependent on the steady state length of the bridging zone, which is in turn dependent on specimen stiffness. This has been demonstrated for UD composites using wedge loaded [26] and pure moment DCB specimens [27]. Given this feature of LSB, it is more appropriate to characterise the relationship between crack mouth opening displacement and stresses bridging the faces of the crack by measuring the bridging law.
DCB loaded with pure moments
Under large-scale bridging conditions, most test specimens require a priori knowledge of the bridging law (which is yet to be measured) in order to calculate the strain energy release rate [28]. One exception to this is the DCB specimen loaded with pure moments, shown in Fig. 5.11, where the critical strain energy release rate is given by:
where M is the applied moment that causes crack growth and B and h are defined in Fig. 5.11.
Under large-scale bridging conditions, the total critical strain energy release rate is made up of two components:
The first term, G0, represents the crack tip toughness: the energy dissipated due to matrix cracking at the crack tip. The second term represents the energy dissipated due to fibre bridging in the wake of the crack tip where δ* is the displacement between the crack faces at the initial notch tip. Differentiating Equation [5.19] with respect to δ gives:
Thus the bridging law can be obtained provided that the applied moment, M, can be determined as a function of the displacement at the initial notch tip, δ*.
Mode I transverse intralaminar matrix failure
The fracture toughness associated with transverse matrix cracking has been measured to be up to three times larger than that of the longitudinal failure mode [29]. Both three-[16, 25, 29] and four-point [30] bending specimens have been used for this purpose.
Perhaps the main difficulty in performing this test successfully is the manufacture of specimens with sharp and straight pre-cracks. In order to achieve this, the laminates must be cured with the pre-cracks already in place, similarly to interlaminar fracture toughness test. Several methods have been tried and a suggested procedure is outlined in [30].
Four-point bend
The critical stress intensity factor for the four-point bend (4PB) specimen, shown in Fig. 5.12, is given by:
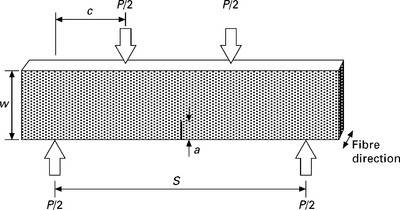
where
The finite width correction factor, f(a/h), assumes the specimen to be transversely isotropic which is appropriate in this case. The results obtained using this method give consistent toughness values with low scatter.
5.4.2 Fibre dominated failure modes
Mode I fibre tensile failure
The fracture toughness associated with mode I fibre tensile failure corresponds to the in-situ fracture toughness of the 0 ° plies in a laminate. The measured critical strain energy release rate encompasses energy dissipation due to fibre–matrix debonding, fibre fracture and fibre pull-out.
It is not possible to propagate a crack through UD specimens such that fracture toughness can be measured, thus the toughness for the fibre tensile failure mode is obtained from translaminar fracture toughness measurements of cross-ply laminates. Besides, the toughness for this failure mode has been found to be dependent on the thickness of the 0 ° plies [23], so even if measurements from purely UD specimens were possible, a material property would not be measured.
Compact tension
The compact tension specimen, as shown in Fig. 5.13, has typically been used [21–23, 31] for this purpose owing to the ability to characterise the full R-curve behaviour from toughness measurements for both fracture initiation and propagation. The ESE(T) specimen recommended by the ASTM E1922 is equally as applicable, however, its adoption was due to problems with fracture propagating perpendicular to the notch in CT specimens of certain lay-ups [18]. In order to measure the toughness associated with the fibre tensile failure mode, this problem can be avoided by controlling the relative proportion of 0 ° and 90 ° plies within the laminate [23]. Thus, at approximately half the size of the ESE(T), the CT specimen makes much more efficient use of material.
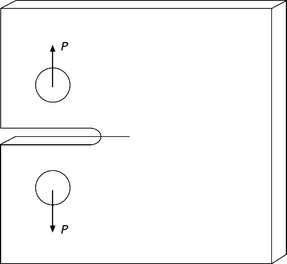
Several data reduction schemes are available for the CT specimen [22], though a modified compliance calibration method is considered to be most appropriate; it does not explicitly rely on the use of finite element analysis (FEA) or an optically measured crack length (other data reduction schemes are found to be sensitive to errors in its measurement). In this case, the elastic compliances of CT specimens are measured for various machined cracks of known length. These measurements are taken across the whole of the potential crack growth range in order to capture the full compliance versus crack length response. Note that a compliance calibration curve can also be obtained by using FEA.
The calibrated C vs. a data is plotted and fitted with a function of the form [24]:
where a, β, and χ are calculated to best fit the experimental data. By differentiating Equation [5.23] and substituting into Equation [5.1], the critical strain energy release rate of the laminate can be obtained from:
For plotting an R-curve, an effective crack length, aeff, can be determined using the elastic compliance measured from the load displacement curves of the test specimens, by rearranging Equation [5.23]:
The tensile toughness of the 0 ° degrees plies, ![]() , can then be obtained using a rule of mixtures type approach to account for the fracture energy in the 90 ° plies such that:
, can then be obtained using a rule of mixtures type approach to account for the fracture energy in the 90 ° plies such that:
where tlam is the specimen thickness, and t0 and t90 are the total thicknesses of 0 ° and 90 ° plies within the laminate respectively. ![]() is the critical energy release rate for the laminate and
is the critical energy release rate for the laminate and ![]() represents the mode I matrix cracking intralaminar fracture toughness. It should, however, be noted that due to the relative magnitudes of the fracture toughnesses in Equation [5.26], the final term can be omitted without any significant loss of accuracy provided that a suitable ratio of 0 ° to 90 ° plies is used.
represents the mode I matrix cracking intralaminar fracture toughness. It should, however, be noted that due to the relative magnitudes of the fracture toughnesses in Equation [5.26], the final term can be omitted without any significant loss of accuracy provided that a suitable ratio of 0 ° to 90 ° plies is used.
Mode I fibre compressive failure
Measurements of toughness corresponding to initiation of fibre shear failure and fibre kinking have been obtained through testing of compact compression [21, 32, 33] and 4PB [34] specimens. So far, only meaningful values of fracture toughness for initiation have been obtained: due to the compressive nature of the fracture, it is difficult to account for the complex processes occurring in the wake of the crack, though this is the subject of continuing efforts.
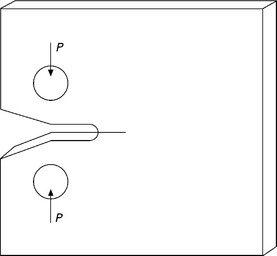
Compact compression
The compact compression specimen (CC), shown in Fig. 5.14, is essentially a CT specimen with extra material removed to avoid contact of the notch faces. Difficulty has arisen in achieving compressive failure of UD laminates (e.g. [35]), so as in the tensile case, cross-ply specimens have been adopted.
Measurements of fracture toughness are taken from the critical load measured during the test. Data reduction for this specimen involves the use of FE to find energy release rates from the J-integral or VCCT methods. A specimen with thickness, t, and applied load, P, is modelled, and the strain energy release rates are obtained for the initial notch lengths, a, used during testing. A normalised energy release rate f(a) can then be defined as [21]:
where GI is the laminate mode I energy release rate obtained from FEA. for convenience the specimen is usually modelled with a unit thickness and unit applied load. The function f(a) can be approximated by a polynomial. Finally, for a critical load of Pc the critical strain energy release rate of the laminate can be obtained from:
where ts is the thickness of the specimen being tested. Note that the data reduction method discussed above for the CT specimen is equally applicable for this case (and vice-versa). However, these tests can provide initiation values of toughness only; no meaningful data can be extracted after initiation. As the initial notch length can be accurately measured, there is no need to eliminate its use in the data reduction process as in the case of Equation [5.24]. The toughness of the ply failure mode can be obtained from Equation [5.26], where the ![]() term is approximated by using the mode II interlaminar fracture toughness of the material being tested.
term is approximated by using the mode II interlaminar fracture toughness of the material being tested.
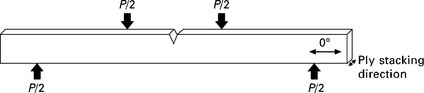
Four-point bend
The use of the four-point bend specimen, shown in Fig. 5.15, as a means of measuring the compressive fracture toughness of fibres was motivated by the desire to obtain compressive failure of unidirectional specimens and thus avoid the process of accounting for energy dissipation in non-zero degree plies as in the case of the CC. The area around the notch tip of the specimen is polished before testing so that failure initiation can be observed through a magnifying lens. This procedure is necessary to obtain the correct initiation load as compressive failure initiates well before there are any obvious signs on the load–displacement curve. Toughness measurements can be obtained from measured values of Pc by modelling a 4PB specimen with FE and proceeding as described by Equations [5.27] and [5.28].
5.5 Conclusions
Several standardised testing procedures are available for the measurement of fracture toughness in composites, as outlined in Table 5.1. The problem of interlaminar fracture toughness measurement has been well addressed, resulting in procedures for mode I, mode II and mixed mode I/II. Translaminar fracture toughness measurement has also been covered by ASTM. However, the standard only covers fracture toughness measurement for damage initiation – as R-curve effects have been observed in some laminates, the standard, in future may need modification in order to cover measurement of toughnesses for damage propagation.
In contrast, procedures for toughness measurement of the individual ply failure modes, that is for longitudinal and transverse matrix failure, and for fibre tensile/compressive failure, are not as well established. Measurements of mode I toughnesses for each of these failure modes have been made by several researchers and as no standard procedures are available for these tests, readers are referred to the appropriate referenced articles. As far as the author is aware, mode II and mixed mode I/II fracture toughness tests for these modes of failure are yet to be addressed.
The development of any test is motivated by the requirements of the measured property. As fracture mechanics based models become increasingly used to model translaminar failure and to make predictions of damage tolerance for composite structures, it is envisaged that there will be an increasing demand for the properties discussed in Section 5.4, as well as mode II and mixed mode toughnesses of these ply-level matrix and fibre dominated failure modes.
5.6 References
[1] ASTM D5528. Standard test method for mode I interlaminar fracture toughness of unidirectional fiber-reinforced polymer matrix composites, 2007.
[2] Hodgkinson, J.M.Mechanical Testing of Advanced Fibre Composites. Cambridge: Woodhead, 2000.
[3] Berry, J.P. Determination of fracture surface energies by the cleavage technique. Journal of Applied Physics. 1963; 34:62–68.
[4] Slepetz, J.M., Carlson, L. Fracture of composite compact tension specimens. Fracture Mechanics of Composites. 1975; 593:143–162. [ASTM STP].
[5] Prewo, K.M. The effect of ply lay-up sequence on the fracture toughness of boron aluminum. Journal of Composite Materials. 1978; 12(1):40–52.
[6] Sun, C.T., Prewo, K.M. The fracture toughness of boron aluminum composites. Journal of Composite Materials. 1977; 11(2):164–175.
[7] Harris, C.E., Morris, D.H. Fracture behaviour of thick, laminated graphite/epoxy composites. NASA Contractor Report; 3784, 1984.
[8] Harris, C.E., Morris, D.H. A comparison of the fracture behaviour of thick laminated composites utilizing compact tension, three-point bend, and center-cracked tension specimens. Fracture Mechanics: Seventeenth Volume. 1986; 905:124–135. [ASTM STP].
[9] Underwood, J.H., Burch, I.A., Bandyopadyay, S. Effects of notch geometry and moisture on fracture strength of carbon/epoxy and carbon/bismaleimide laminates. Composite Materials: Fatigue and Fracture (Third Volume). 1991; 1110:667–685. [ASTM STP].
[10] Masters, J.E. Translaminar fracture toughness of a composite wing skin made of stitched warp-knit fabric. NASA Contractor Report; 201728, 1997.
[11] Reber, R., De Haan, J., Mayer, J., Petitmermet, M., Wintermatnel, E. Intralaminar fracture of weft-knitted carbon fiber reinforced PEEK. Fracture of Polymers, Composites and Adehsives. 2000; 27:123–133. [ESIS Publication].
[12] Donadon, M.V., Falzon, B.G., Iannucci, L., Hodgkinson, J.M. Intralaminar toughness characterisation of unbalanced hybrid plain weave laminates. Composites Part A, Applied Science and Manufacturing. 2007; 38(6):1597–1611.
[13] Morris, D.H., Hahn, H.T. Fracture resistance characterization of graphite/epoxy composites. Composite Materials: Testing and Design (Fourth Conference), 1977:5–17.
[14] Yeow, Y.T., Morris, D.H., Brinson, H.F. A correlative study between analysis and experiment on the fracture behavior of graphite/epoxy composites. Journal of Testing and Evaluation. 1979; 7:117–125.
[15] Poe, C.C., Sova, J.A. Fracture toughness of boron/aluminium laminates with various proportions of 0 ° and ±45 ° plies, 1980. [NASA TP1707, November].
[16] Leach, D.C., Moore, D.R. Toughness of aromatic polymer composites reinforced with carbon fibres. Fibre Science and Technology. 1985; 23(2):131–161.
[17] Toygar, M.E., Toparli, M., Uyulgan, B. An investigation of fracture toughness of carbon/epoxy composites. Journal of Reinforced Plastics and Composites. 2006; 25(18):1887–1895.
[18] Underwood, J.H., Kortschot, M.T., Lloyd, W.R., Eidinoff, H.L., Wilson, D.A., Ashbaugh, N. Translaminar fracture toughness test methods and results from interlaboratory tests of carbon/epoxy laminates. Fracture Mechanics: 26th Volume, ASTM STP 1256, 1995.
[19] El-Hajjar, R., Haj-Ali, R. Mode-I fracture toughness testing of thick section FRP composites using the ESE(T) specimen. Engineering Fracture Mechanics. 2005; 72(4):631–643.
[20] ASTM E1922-04. Standard test method for translaminar fracture toughness of laminated polymer matrix composite materials, 2004.
[21] Pinho, S.T., Robinson, P., Iannucci, L. Fracture toughness of the tensile and compressive fibre failure modes in laminated composites. Composites Science and Technology. 2006; 66(13):2069–2079.
[22] Laffan, M.J., Pinho, S.T., Robinson, P., Iannucci, L. Measurement of the in situ ply fracture toughness associated with mode I fibre tensile failure in FRP. Part I: Data reduction. Composites Science and Technology. 2010; 70(4):606–613.
[23] Laffan, M.J., Pinho, S.T., Robinson, P., Iannucci, L. Measurement of the in situ ply fracture toughness associated with mode I fibre tensile failure in FRP. Part II: Size and lay-up effects. Composites Science and Technology. 2010; 70(4):614–621.
[24] Dávila, C., Rose, C., Camanho, P. A procedure for superposing linear cohesive laws to represent multiple damage mechanisms in the fracture of composites. International Journal of Fracture. 2009; 158(2):211–223.
[25] Moore, D.R., Seferis, J.C. Toughness characterization of carbon fibre/polyether ether ketone (CF/PEEK) laminates. Pure and Applied Chemistry. 1991; 63:1609.
[26] Spearing, S.M., Evans, A.G. The role of fiber bridging in the delamination resistance of fiber-reinforced composites. Acta Metallurgica et Materialia. 1992; 40(9):2191–2199.
[27] Sørensen, B.F., Jacobsen, T.K. Large-scale bridging in composites: R-curves and bridging laws. Composites Part A. 1998; 29A:1443–1451.
[28] Bao, G., Suo, Z. Remarks on crack-bridging concepts. Applied Mechanics Reviews. 1992; 45(8):355–366.
[29] Hansen, U., Gillespie, J.W. Dependence of intralaminar fracture toughness on direction of crack propagation in unidirectional composites. Journal of Composites Technology Research. 1998; 20(2):89–99.
[30] Pinho, S.T., Robinson, P., Iannucci, L. Developing a four point bend specimen to measure the mode I intralaminar fracture toughness of unidirectional laminated composites. Composites Science and Technology. 2009; 69:1303–1309.
[31] Laffan, M.J., Pinho, S.T., Robinson, P., McMillan, P.J. Translaminar fracture toughness: The critical notch tip radius of 0 ° plies in CFRP. Composites Science and Technology. 2011. [doi: 10.106/j.compscitech.2011.10.006].
[32] Ratcliffe, J. Compression strength prediction of impact-damaged composite sandwich panels. American Helicopter Society Annual Forum Proceedings. 2004; 60(1):656–672.
[33] Jackson, W., Ratcliffe, J.Measurement of fracture energy for kink-band growth in sandwich specimens. CompTest. Bristol: University of Bristol, 2004.
[34] Laffan, M.J., Pinho, S.T., Robinson, P., Iannucci, L., McMillan, A.J. Measurement of the fracture toughness associated with model fibre compressive failure. 14th European Conference on Composite Materials, Budapest, 2010.
[35] Soutis, C., Curtis, P.T., Fleck, N.A. Compressive failure of notched carbon fibre composites. Proceedings of the Royal Society. 1993; 440:241–256.