
Chapter 8. Debugging applications
- Debugging bundles using jdb
- Debugging bundles using Eclipse
- Understanding and solving class-loading issues
- Tracking down memory leaks and dangling service references
You just learned how to test individual bundles and application deployments in OSGi, but what should you do when an integration test unexpectedly fails with a class-loading exception or a load test runs out of memory? If you were working on a classic Java application, you’d break out the debugger, start adding or enabling instrumentation, and capture various diagnostic dumps. Well, an OSGi application is still a Java application, so you can continue to use many of your well-honed debugging techniques. The key area to watch out for is usually related to class loading, but that’s not the only pitfall.
OSGi applications can have multiple versions of the same class running at the same time, requiring greater awareness of versioning; missing imports can lead to groups of classes that are incompatible with other groups; and dangling services can lead to unexpected memory leaks when updating bundles. In this chapter, we’ll show you examples of how to debug all these problems and suggest best practices based on our collective experience of working with real-world OSGi applications in the field.
Let’s kick off with something simple. Say you have an application composed of many working bundles and one misbehaving bundle: how do you find the bad bundle and debug it?
8.1. Debugging bundles
Applications continue to grow over time—more features get built on top of existing functionality, and each code change can introduce errors, expose latent bugs, or break original assumptions. In a properly modularized OSGi application, this should only lead to a few misbehaving bundles rather than a completely broken application. If you can identify these bundles, you can decide whether to remove or replace them, potentially fixing the application without having to restart it. But first, you need to find out which bundles are broken!
Take the paint example you’ve worked on in previous chapters. Imagine that you get a request to allow users to pick the colors of shapes. Your first step might be to add a setColor() method to the SimpleShape interface:
/**
 * Change the color used to shade the shape.
 *
 * @param color The color used to shade the shape.
 **/
public void setColor(Color color);
You probably think adding a method to an API is a minor, backward-compatible change, but in this case the interface is implemented by various client bundles that you may not have control over. In order to compile against the new SimpleShape API, they need to implement this method; so from their perspective, this is a major change. You should therefore increment the API version in the main paint example build.xml file to reflect this. The last version you used was 5.0, so the new version is
<property name="version" value="6.0"/>
You now need to implement the setColor() method in each of the three shape bundles. Here’s the updated implementation for the triangle shape bundle.
Listing 8.1. Implementing the setColor() method for the triangle shape
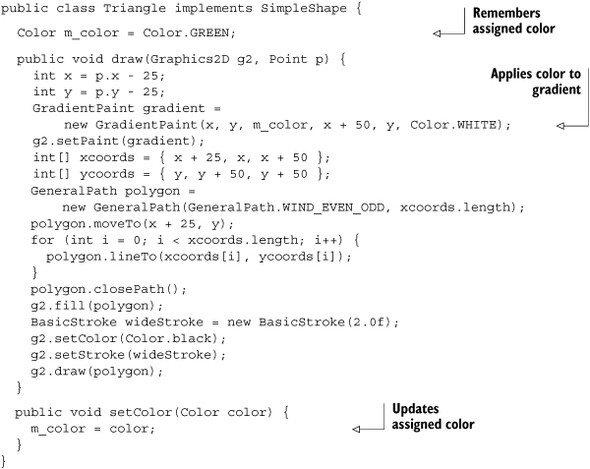
The paint frame bundle contains another implementation of the SimpleShape API: org.foo.paint.DefaultShape. This class lazily delegates to the real shape via the OSGi service registry, so it also needs to implement the new setColor() method. The correct implementation follows the same approach used in DefaultShape.draw(): check that you have access to the real shape from the registry and, if you don’t, request it. You’ll use a broken implementation instead and assume you already have access to the shape instance:
public void setColor(Color color) {
  m_shape.setColor(color);
}
This sort of mistake could be made by a new team member who doesn’t know about the lazy delegation approach and assumes that m_shape has been initialized elsewhere. If the application happened to call draw() early on, this bug could go unnoticed for a long time, because m_shape would always be valid by the time the code reached setColor(). But one day, someone may reasonably change the application so it calls setColor() first, as follows from the ShapeComponent class, and the bug will bite. (This example may seem a little contrived, but it’s surprisingly hard to write bad code when you really want to!)
protected void paintComponent(Graphics g) {
  super.paintComponent(g);
  Graphics2D g2 = (Graphics2D) g;
  g2.setRenderingHint(RenderingHints.KEY_ANTIALIASING,
                      RenderingHints.VALUE_ANTIALIAS_ON);
  SimpleShape shape = m_frame.getShape(m_shapeName);
  shape.setColor(getForeground());
  shape.draw(g2, new Point(getWidth() / 2, getHeight() / 2));
}
You now have a broken OSGi application, which will throw an exception whenever you try to paint shapes. Let’s see if you can debug it using the JDK provided debugger, jdb (http://java.sun.com/javase/6/docs/technotes/tools/solaris/jdb.html).
8.1.1. Debugging in action
The Java Debugger (also known as jdb) is a simple debugging tool that primarily exists as an example application for the Java Platform Debugger Architecture (JPDA, http://java.sun.com/javase/technologies/core/toolsapis/jpda/index.jsp) rather than a product in its own right. This means it lacks some of the polish and user-friendly features found in most other debuggers. But jdb is still a useful tool, especially when you’re debugging on production servers that have limited installation environments.
Debugging With Jdb
You first need to build the broken example. When that’s done, you can start jdb:
$ cd chapter08/debugging-bundles

$ ant dist

$ jdb -classpath launcher.jar launcher.Main bundles

Initializing jdb ...
>
Jdb starts up, but it won’t launch your application until you type run:
> run
run launcher.Main bundles
Set uncaught java.lang.Throwable
Set deferred uncaught java.lang.Throwable
>
VM Started:
>
You should see the updated paint window appear, as shown in figure 8.1. All you had to do is use the jdb command instead of java and specify the class path and main class (the jdb command doesn’t support the -jar option). You didn’t have to tell jdb anything about your bundles or the OSGi framework; from jdb’s perspective, this is just another Java application.
Figure 8.1. Updated paint example running under jdb

If you happen to see several I/O exceptions mentioning the felix-cache, check that you haven’t got any leftover debugged Java processes running. When you forcibly quit jdb using Ctrl-C, it can sometimes leave the debugged process running in the background, which in this case will stop new sessions from using the local felix-cache directory.
If you try to draw a shape in the paint window, jdb reports an uncaught exception in the AWT event thread:
Exception occurred: java.lang.NullPointerException (uncaught)
    "thread=AWT-EventQueue-0", java.awt.EventDispatchThread.run(),
        line=156 bci=152

AWT-EventQueue-0[1] where

  [1] java.awt.EventDispatchThread.run (EventDispatchThread.java:156)
This exception has percolated all the way up to the top of the AWT event thread, and jdb doesn’t give you an easy way to see where it was originally thrown. You can ask it to stop the application when this sort of exception occurs again, like so:
AWT-EventQueue-0[1] catch java.lang.NullPointerException

Set all java.lang.NullPointerException

AWT-EventQueue-0[1] resume

All threads resumed.
Keep resuming the program until you see a long exception stack trace appear on the jdb console. This isn’t a new exception: it’s the AWT thread printing out the original uncaught exception. The top of the exception stack confirms that it was caused by your faulty code inside DefaultShape, which you know is contained inside the paint frame bundle. Notice that jdb doesn’t give you a way to correlate the exception location with a particular JAR file.
What if you didn’t know which bundle contained this package? You could try to locate it using the console, but most framework consoles only let you see exported packages. For internal packages, you would have to come up with a list of candidate bundles by manually checking the content of each bundle and comparing the exception location with the appropriate source. As you’ll see in a moment, tracking a problem to a specific bundle is much easier when you use an OSGi-aware debugger, such as the Eclipse debugger.
Returning to the broken example, try to paint another shape. Jdb now detects and reports the exception at the point at which it’s thrown inside setColor(). But because you haven’t attached any source files, it doesn’t show you the surrounding Java code:
Exception occurred: java.lang.NullPointerException
    (to be caught at: javax.swing.JComponent.paint(), line=1,043 bci=351)
        "thread=AWT-EventQueue-0", org.foo.paint.DefaultShape.setColor(),
            line=126 bci=5

AWT-EventQueue-0[1] list

Source file not found: DefaultShape.java
No problem—you need to attach your local source directory:
AWT-EventQueue-0[1] use org.foo.paint/src

AWT-EventQueue-0[1] list

122        g2.drawImage(m_icon.getImage(), 0, 0, null);
123      }
124
125      public void setColor(Color color) {
126 =>     m_shape.setColor(color);
127      }
128    }
When you print the current value of m_shape, you can finally see why it failed:
AWT-EventQueue-0[1] print m_shape

 m_shape = null
If you’re an experienced Java programmer this should be familiar; no special OSGi knowledge is required. But take another look at the command where you attached your source directory:
use org.foo.paint/src
This command has no knowledge of bundles or class versions; it merely provides a list of candidate source files for jdb to compare to debugged classes. Jdb allows only one version of a given source file to be used at any one time, which makes life difficult when you’re debugging an OSGi application containing multiple bundle versions. You have to know which particular collection of source directories to enable for each debug session.
Debugging With Eclipse
Thankfully, this is merely a limitation of jdb. If you use an IDE such as Eclipse, which knows that multiple versions of a class can coexist in the same JVM, you don’t have to worry about which source relates to which bundle version. The IDE manages that association for you as you debug your application.
To see this in action, generate Eclipse project files for the two paint examples from chapters 4 and 8:
$ cd ../../chapter04/paint-example

$ ant clean pde

$ cd ../../chapter08/debugging-bundles

$ ant clean pde
Now import these two directories into Eclipse as existing projects. You should end up with 10 new projects: half marked version 4, the rest version 6. To debug these bundles in Equinox, the OSGi framework used by Eclipse, click the drop-down arrow next to the bug icon (circled at the top of figure 8.2), and select Debug Configurations.
Figure 8.2. Configuring the Eclipse Debugger
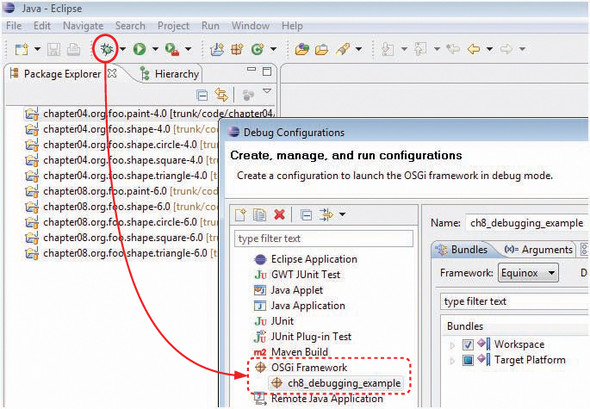
Doing so opens the Debug Configurations dialog box. Follow these instructions to configure a minimal Eclipse target platform for debugging the paint example:
- Double-click OSGi Framework.
- Change the name from New_configuration to ch8_debugging_example.
- Deselect Include Optional Dependencies as well as Add New Workspace Bundles.
- Select Validate Bundles Automatically.
- Deselect the top-level Target Platform.
- Click Add Required Bundles.
- Click Apply.
When you’re happy with your selection, click the Debug button to launch the debugger. Two different paint frames appear, as shown in figure 8.3. This is because you have two versions of the code running simultaneously in the same JVM.
Figure 8.3. Debugging the paint example in Eclipse

Before you start to paint, let’s add a breakpoint so the debugger will stop when someone tries to use a null object reference. Choose Run > Add Java Exception Breakpoint to open the dialog box shown in figure 8.4. Select java.lang.NullPointerException and click OK.
Figure 8.4. Watching for NullPointer-Exceptions

You now have the two paint examples running in the Eclipse debugger. If you try to paint with the original version, which has three shapes in its toolbar, everything works as expected. But if you try to paint with the new version—the one with the paintbrush in its toolbar—the debugger stops (see figure 8.5).
Figure 8.5. Exception caused by a bad setColor() method


Look closely at the title bar. The debugger has correctly identified that the affected source code is from chapter08 even though there are multiple versions of this class loaded in the Java runtime. Again, the problem is caused by a null shape object. Using the Eclipse IDE, you can trace the exception back to the specific bundle project. You can also click different frames in the stack trace to see what other bundles (if any) were involved. Compare this to jdb, where it was difficult to tell which bundles were involved in a given stack trace without a good understanding of the source distribution.
OSGi defines a standard place for embedding documentation inside bundles: OSGI-OPT. Bundles containing source code under OSGI-OPT/src can be debugged in Eclipse even when you don’t have a project associated with them in your workspace.
You’ve successfully debugged an OSGi application with existing tools, from the basic jdb debugger to the full-fledged Eclipse IDE. But what do you do when you finally track down the bug? Do you stop your application, fix the code, and restart? What if your application takes a long time to initialize, or if it takes hours to get it into the state that triggered the bug in the first place? Surely there must be a better way!
8.1.2. Making things right with HotSwap
Thankfully, there is an answer to the question we just asked. You may know it as HotSwap. HotSwap is a feature of the Java 5 debugging architecture that lets you change the definition of a class at execution time without having to restart the JVM. The technical details behind HotSwap are outside of the scope of this book; what’s more interesting is whether it works correctly with OSGi.
To use HotSwap, you need to attach a native agent at startup to the low-level debugging hooks provided by the JVM. One such agent is attached whenever you run an application under jdb. Although jdb provides a basic redefine command to swap in newly compiled classes, it won’t work for the previous example. Jdb refuses to redefine classes that have multiple versions loaded, because it can’t determine which version should be redefined. But what about Eclipse? Can it help you update the right version of DefaultShape?
Hotswap With Eclipse
In the previous section, you successfully used the Eclipse debugger to manage multiple versions of source code while debugging. Will Eclipse come to the rescue again and let you fix the broken DefaultShape implementation while leaving earlier working versions intact? If you still have the Eclipse debugger instance running, you can skip to the next paragraph. Otherwise, you need to relaunch the example by clicking the dropdown arrow next to the bug icon (circled in figure 8.2) and selecting ch8_debugging_example. Trigger the exception again by attempting to paint a shape.
You should have the paint example suspended in the debugger at the point of failure, as you saw in figure 8.5. Unlike jdb, which has to be told which classes to redefine, the Eclipse debugger automatically attempts to redefine any class whose source changes in the IDE (provided you have automatic builds enabled). This means all you need to do to squish this bug is change the setColor() method in the open DefaultShape.java window so that m_shape is initialized before you use it, and save the file. For a quick solution, you can copy and paste the relevant code from the draw() method, as follows.
Listing 8.2. Fixing the setColor() method
public void setColor(Color color) {
  if (m_context != null) {
    try {
      if(m_shape == null) {
        m_shape = (SimpleShape) m_context.getService(m_ref);
      }
      m_shape.setColor(color);
    } catch (Exception ex) {}
  }
}
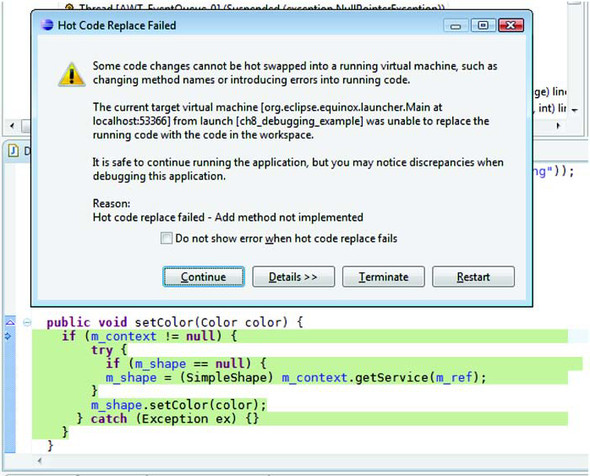
Copying code this way is fine for a quick debugging session, but it’s better to extract the initialization code into a common method for use by both the draw() and set-Color() methods. Reducing code duplication makes testing and debugging a lot easier. For now, you’ll keep things simple: paste the code from listing 8.2 over the broken setColor() implementation. When you’re ready, click Save to squish the bug!
What happened? Most, if not all, of you got an error message like the one in figure 8.6, saying the JVM couldn’t add a method to an existing class. This happened because Eclipse tried to update both versions of the DefaultShape class. Although it was able to redefine the broken setColor() method in the version from this chapter, there is no such method in the DefaultShape class from chapter 4. Instead, the debugger attempted to add the setColor() method to the old class, but adding methods isn’t supported by the current Sun implementation of HotSwap. Even worse, if you decide to ignore this error message and continue, you still get the same exception as before when painting shapes.
Figure 8.6. HotSwap failure updating DefaultShape
Alternative implementations of HotSwap do support adding methods. You can find one such implementation in the IBM JDK (www.ibm.com/developerworks/java/jdk/). If you debug the same example using IBM Java 6 as the target runtime (remembering, of course, to first revert the setColor() method back to the broken version), you can successfully fix the problem without restarting the process. Figure 8.7 confirms that even after using HotSwap to squish the bug, both the old and new paint examples continue to work on the IBM JDK.
Figure 8.7. Successful HotSwap with the IBM JVM

Although you eventually managed to use HotSwap to fix the problem in your bundle, this isn’t exactly what you want, because all versions of DefaultShape were updated. By chance, this didn’t affect the old paint example because you were adding a completely new method. It has no effect on the old application and sits there unused. But what if you wanted to change a method that was tightly coupled to existing code? You could end up fixing one version only to find out you’d broken all the others by unintentionally upgrading them with the new logic. This may not be a big deal during development, because you’ll probably be focusing on one version at a time; but can you do better when debugging OSGi applications in the field?
Hotswap With JRebel
Yes, you can do better. A JVM agent called JRebel (formerly known as JavaRebel; www.zeroturnaround.com/jrebel/) behaves in a way similar to HotSwap but has much better support for custom class-loading solutions like OSGi. For those who don’t know, a JVM agent is a small native library that attaches to the process on startup and is granted low-level access to the Java runtime. Whenever you recompile a class, JRebel automatically updates the appropriate version loaded in the JVM without affecting any other versions of the class. This makes it easy to develop, debug, and compare different releases of an application at the same time.
What are the downsides? The main downside is reduced performance due to the extra tracking involved. JRebel also needs to know how custom class loaders map their classes and resources to local files. It currently supports the Equinox OSGi implementation, but there’s no guarantee it will work with other OSGi frameworks. Finally, you need to add an option to the JVM command line to use it, which is problematic in production environments that lock down the JVM’s configuration. Some places won’t let you use JVM agents at all because of the potential security issues involved. Agents have access to the entire process and can redefine almost any class in your application. Adding an agent to your JVM is like giving root access to a user in Linux. For these reasons, JRebel is usually best suited to development environments.
But what if you’re working somewhere that forbids the use of debuggers or JVM agents? Is there any other way you can update the broken bundle without restarting the whole process?
Hotswap the OSGI Way
Update is the key word here. Back in section 3.7, we discussed the update and refresh parts of the OSGi lifecycle. Well, you can use them here to deploy your fix without having to restart the JVM. To see this in action, you first need to revert the setColor() method of the local DefaultShape class back once again to the broken implementation:
public void setColor(Color color) {
  m_shape.setColor(color);
}
Next, completely rebuild the example:
$ ant clean dist
This time, you won’t use a debugger. Also, add your command shell to the current set of bundles, so you can ask the framework to update the fixed bundle later:
$ ant add_shell_bundles

$ java -jar launcher.jar bundles
First, confirm that you have the broken implementation installed by attempting to paint a shape (you should see an exception). Then, in another operating system shell, fix the setColor() method of the DefaultShape class using the code from listing 8.2, and rebuild the paint frame bundle in a new window:
$ cd chapter08/debugging-bundles/org.foo.paint

$ ant
You can now try updating your fixed bundle. Go back to the OSGi console, and type the following:
-> update 6
Here, 6 is the ID of the paint frame bundle, as reported by the bundles command. When you issue the update command, the framework updates the bundle content by reloading the bundle JAR file from its original install location. It also stops and restarts the paint frame bundle, so you should see the paint frame window disappear and reappear. The paint example is now using the fixed code, which means you can paint multicolored shapes as shown in figure 8.8. Notice that you didn’t need to follow the update with a refresh. This is because the paint frame bundle doesn’t export any packages, so you know there are no other bundles hanging onto old revisions of the DefaultShape code.
Figure 8.8. Painting with the fixed example

Unlike JRebel, the OSGi update process doesn’t depend on a special JVM agent. It also doesn’t have any significant effect on performance. These reasons together mean you can use the OSGi update process in a production environment. The downside is that you have to update and restart the entire bundle, potentially destroying the current state, rather than redefine a single class. If you wanted to keep any previously drawn shapes, you would need to persist them somehow when stopping and restore them when restarting.
You’ve just seen how you can debug and fix problems in OSGi applications using everyday development tools such as jdb and Eclipse. You looked at more advanced techniques, such as HotSwap and JRebel, and finally used the tried-and-tested OSGi update process to fix a broken bundle. We hope these examples made you feel more comfortable about debugging your own OSGi applications. In the next section, we’ll take a closer look at a set of problems you’ll eventually encounter when using OSGi: class-loading issues.
8.2. Solving class-loading issues
OSGi encourages and enforces modularity, which, by its nature, can lead to class-loading issues. Maybe you forgot to import a package or left something out when building a bundle. Perhaps you have a private copy of a class you’re supposed to be sharing or forgot to make sure two tightly coupled packages are provided by the same bundle. These are all situations that break modularity and can lead to various class-loading exceptions. The right tools can help you avoid getting into these situations in the first place, but it’s still worthwhile knowing what can happen and what the resulting problem signatures look like. The following sections take you through a number of common class-loading problems, what to look out for, what might be the cause, and how to solve them.
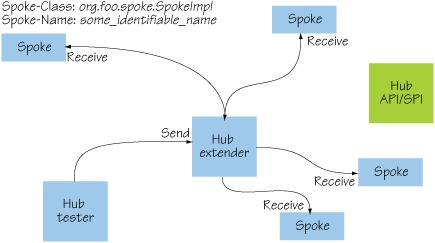
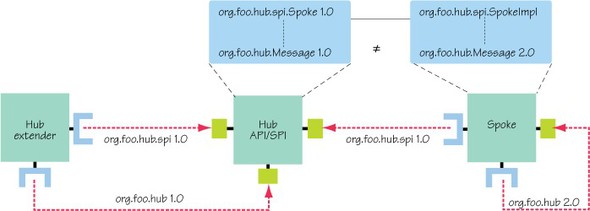
All the exceptions discussed in this section come from the same example application: a simple hub-and-spoke message system that uses the OSGi extender pattern (see section 3.4) to load spoke implementations at execution time. The basic architecture is shown in figure 8.9. The only thing that changes throughout this example is the content of the spoke implementation bundle; the API, hub extender, and test bundles remain exactly the same. By the end of this section, you should understand which class-loading issues can arise from simple changes in content and metadata and how you can diagnose and fix them when something goes wrong.
Figure 8.9. Simple hub-and-spoke message system
8.2.1. ClassNotFoundException vs. NoClassDefFoundError
The first thing you should do when debugging a class-loading exception is look and see if the exception is ClassNotFoundException or NoClassDefFoundError. A subtle difference between these two types will help you understand why the exception occurred and how to fix it.
ClassNotFoundException
A ClassNotFoundException means the reporting class loader wasn’t able to find or load the initial named class, either by itself or by delegating to other class loaders. This could occur in a Java application for three main reasons:
- There’s a typo in the name passed to the class loader (common).
- The class loader (and its peers) have no knowledge of the named class.
- The named class is available, but it isn’t visible to the calling code.
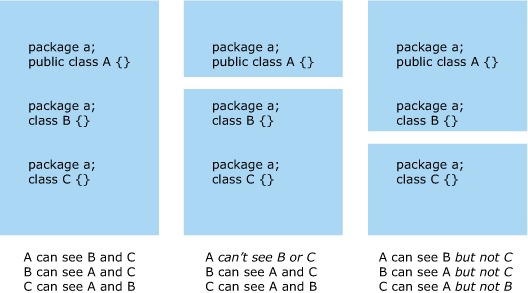
The third case, visibility, is where things get interesting. You know all about public, protected, and private access; but how many of you know what package private means? Package-private classes are those without any access modifier before their class keyword. Their visibility rules are unique: in addition to only being visible to classes from the same package, they’re also only visible to classes from the same class loader. Most Java programs have a single application class loader, so this last rule hardly ever comes up. OSGi applications contain multiple class loaders, but as long as each package is loaded by only one class loader, it’s effectively the same as before. The real problem arises with split packages (see section 5.3), which span several class loaders. Package-private classes from a split package in one bundle aren’t visible to fellow classes in other bundles. This can lead to ClassNotFoundExceptions or Illegal-AccessExceptions that wouldn’t happen with a single application class loader.
Figure 8.10 shows three different package-private scenarios: one classic and two involving split packages. Each scenario has subtly different class visibility.
Figure 8.10. Split packages and package-private visibility
To see a common ClassNotFoundException situation, run the following example:
$ ./chapter08/classloading/PICK_EXAMPLE 1
This builds and deploys a spoke bundle with incorrect extender metadata concerning its implementation class: it lists the name as MySpokeImpl instead of SpokeImpl. This is an easy mistake to make in applications configured with XML or property files because of the lack of type safety. The resulting exception gives the name of the missing class:
java.lang.ClassNotFoundException: org.foo.spoke.MySpokeImpl
You should use this information to check if the name is correct, the class is visible, and the package containing the class is either imported or contained inside the bundle. Most ClassNotFoundExceptions are easily solved by checking bundle manifests and configuration files. The hardest problems involve third-party custom class loaders; you inevitably need access to the class loader’s source code to determine why it couldn’t see a particular class, as well as have the patience to unravel the exception stack.
That’s ClassNotFoundException, but how is NoClassDefFoundError any different?
NoClassDefFoundError
First, this is an error rather than an exception, which means applications are discouraged from catching it. Second, it means the initial class that started the current load cycle was found, but the class loader wasn’t able to finish loading it because a class it depends on was missing. This can happen when a class is compiled against a dependent API, but the resulting bundle neither contains nor imports that package.
Continuing with the exceptional example, type the following:
$ ./chapter08/classloading/PICK_EXAMPLE 2
This time, the extender metadata in the spoke bundle is correct, but the bundle doesn’t import the org.foo.hub.spi package containing the Spoke interface. The runtime begins to load the spoke implementation but can’t find the named interface when defining the class:
java.lang.NoClassDefFoundError: org/foo/hub/spi/Spoke
...
Caused by: java.lang.ClassNotFoundException: org.foo.hub.spi.Spoke
Debugging a NoClassDefFoundError involves tracing back through the dependencies of the class being loaded to find the missing link (or links). Although the cause in this example is clear, developers often get side-tracked by assuming the initial class is at fault. The real culprit may be hidden down at the bottom of the stack as the original cause of the exception. When you know the real cause, you can use the same problem-solving approach used in ClassNotFoundException to fix the issue.
Figure 8.11 summarizes the difference between the two missing-class exception types; together, they make up many of the class-loading issues you’ll encounter when using OSGi. Just remember: ClassNotFoundException means a class is missing, whereas NoClassDefFoundError means one of its dependencies is missing.
Figure 8.11. Differences between ClassNotFoundException and NoClassDefFoundError

Unfortunately, these two exceptions don’t have a monopoly on confusing OSGi developers. A classic puzzle for people new to class loading goes something like this: you’re given an object that says its type is org.foo.Item, but when you try to cast it to org.foo.Item you get a ClassCastException! What’s going on?
8.2.2. Casting problems
How many of you would expect a ClassCastException from the following code?
ServiceTracker itemTracker =
    new ServiceTracker(bundleContext, "org.foo.Item", null);

itemTracker.open(true);

Item item = (Item) itemTracker.getService();
At first glance, it looks correct: you configure a service tracker to track services of type org.foo.Item and cast the discovered service, if any, to the same type. But notice how you open the tracker. Instead of calling the no-argument open() method as usual, you pass in a Boolean: true. This tells the service tracker to track all services whose type name matches the org.foo.Item string, not just the ones that are class-loader compatible with your bundle (we discussed a similar situation back in section 4.5.1). If another bundle provides an Item service and happens to get the org.foo package from a different class space than you did, you’ll see a ClassCast-Exception at the last line.
How can this be? Recall from chapter 2 that class loaders form part of a type’s identity at execution time, so the exact same class byte code loaded by two different class loaders is considered to be two distinct types. This makes all the difference, because OSGi uses a class loader per bundle to support class-space isolation in the same Java runtime. It also means you can get ClassCastExceptions when casting between types that look identical on paper.
To see this in practice, run the third example:
$ ./chapter08/classloading/PICK_EXAMPLE 3
You should see a ClassCastException involving the Spoke class. This is because your spoke bundle contains its own private copy of org.foo.hub.spi, instead of importing it from the hub bundle. The spoke and hub end up using different class loaders for the same API class, which makes the spoke implementation incompatible with the hub:
java.lang.ClassCastException: org.foo.spoke.SpokeImpl
  cannot be cast to org.foo.hub.spi.Spoke
The fastest way to investigate these impossible ClassCastExceptions is to compare the class loaders for the expected and actual types. OSGi frameworks sometimes label their class loaders with the bundle identifier, so calling getClassLoader(). toString() on both sides can tell you which bundles are involved. You can also use the framework console to find out who’s exporting the affected package and who imports it from them. Use this to build a map of the different class spaces. The specific commands to use depend on the framework; at the time of writing this book, the OSGi Alliance is still standardizing a command shell. On Felix, the inspect package command is the one to use. On Equinox you would use the packages or bundle commands. Once you understand the different class spaces, you can adjust the bundle metadata to make things consistent to avoid the ClassCastException. One approach might be to add uses constraints, which we first introduced at the end of chapter 2.
8.2.3. Using uses constraints
Think back to chapter 2, specifically the discussion about consistent class spaces in section 2.7.2. Bundles must have a consistent class space to avoid running into class-related problems, such as visibility or casting issues. When you have two tightly coupled packages, it’s sometimes necessary to add uses constraints to make sure these packages come from the same class space. Perhaps you don’t think you need all these uses constraints cluttering up your manifest—after all, what’s the worst that can happen if you remove them?
Let’s find out by running the fourth example in the class-loading series:
$ ./chapter08/classloading/PICK_EXAMPLE 4
Yet again you get a class-loading exception, except this time it happens inside the spoke implementation. The Java runtime notices that you attempted to load two different versions of the Message class in the same class loader—in other words, your class space is inconsistent:
java.lang.LinkageError: loader constraint violation: loader (instance of
  org/apache/felix/framework/searchpolicy/ModuleImpl$ModuleClassLoader)
    previously initiated loading for a different type with name
      "org/foo/hub/Message"
How did this happen? Your new spoke bundle has an open version range for the hub API, which means it can import any version after 1.0. It also provides a new 2.0 version of the org.foo.hub package that includes a modified Message interface. You may wonder what this package is doing in your spoke bundle—maybe you’re experimenting with a new design, or perhaps it was included by mistake. How it got there isn’t important. What is important is that you have a 2.0 version of org.foo.hub floating around without a corresponding 2.0 version of the Spoke Service Provider Interface (SPI). Let’s see how this affects the package wiring.
The hub extender and test bundles still have the original, restricted version range:
Import-Package:
 org.foo.hub;version="[1.0,2.0)",
 org.foo.hub.api;version="[1.0,2.0)",
 org.foo.hub.spi;version="[1.0,2.0)"
They get Spoke and Message from the original API bundle, but your spoke bundle has
Import-Package:
 org.foo.hub;version="1.0",
 org.foo.hub.spi;version="1.0"
This means it gets the original Spoke interface from the API bundle and the updated Message from itself. (Remember, the framework always tries to pick the newest version it can.) Thus the Spoke interface and your implementation see different versions of the Message interface, which causes the LinkageError in the JVM. Figure 8.12 shows the mismatched wiring.
Figure 8.12. Mismatched wiring due to missing uses constraints
You must tell the framework that the various hub packages are related, so it can stop this mismatch from happening. This is where the missing uses constraints come in. Edit the chapter08/classloading/org.foo.hub/build.properties file and remove this line from the bnd instructions:
-nouses: ${no.uses}
Removing this re-enables bnd support for uses constraints. If you run the example again,
$ ./chapter08/classloading/PICK_EXAMPLE 4
you no longer see any exceptions or linkage errors:
SPOKE org.foo.spoke.no_uses_constraints RECEIVED Testing Testing 1, 2, 3...
You just saw how uses constraints can help you avoid inconsistent class spaces and odd linkage errors, but what happens if they can’t be satisfied? You can find out by tweaking the version range for org.foo.hub in the spoke bundle. By using a range of [2.0, 3.0), you leave only one matching exporter of org.foo.hub: the spoke bundle itself. But this breaks the uses constraints on the SPI package exported from the main API bundle, because it has a range of [1.0, 2.0) for org.foo.hub. These two ranges are incompatible: there’s no way you can find a solution that satisfies both. The fifth example demonstrates the result:
$ ./chapter08/classloading/PICK_EXAMPLE 5

Error starting framework: org.osgi.framework.BundleException:
  Unable to resolve due to constraint violation.
Unfortunately, the framework exception doesn’t tell you which constraint failed or why. Determining why a solution wasn’t found without help from the framework can be time consuming, because the search space of potential solutions can be large. Fortunately, Equinox has a diag command to explain which constraints were left unsatisfied. With Felix, you can add more details to the original exception by enabling debug logging.
For example, if you change the last line in the PICK_EXAMPLE script to
java "-Dfelix.log.level=4" -jar launcher.jar bundles
this enables Felix debug logging, which prints the following message before the exception is thrown:
$ ./chapter08/classloading/PICK_EXAMPLE 5

DEBUG: Constraint violation for 1.0 detected;
  module can see org.foo.hub from [1.0] and org.foo.hub from [2.0]
The message tells you the unsatisfied constraint is related to the org.foo.hub package. It also gives you the identifiers of the bundles involved. This is another reason why it’s a good idea to use uses constraints. Without them, you’d have to debug confusing class-loading problems with no support from the framework. By using uses constraints, you can avoid linkage errors to begin with and help the framework explain why certain sets of bundles aren’t compatible. But it can only do this if the constraints are valid and consistent, which is why we recommend you always use a tool to compute them, such as bnd.
So far, we’ve concentrated on what happens when your bundle metadata is wrong; but even a perfect manifest doesn’t always guarantee success. Certain coding practices common to legacy code can cause problems in OSGi because they assume a flat, static class path. One practice worth avoiding is the use of Class.forName() to dynamically load code.
8.2.4. Staying clear of Class.forName()
Suppose you’re writing a module that needs to look up a class at execution time based on some incoming argument or configuration value. Skimming through the Java platform API, you spot a method called Class.forName(). Give it a class name, and it returns the loaded class. Perfect, right? Its ongoing popularity suggests many Java programmers agree; but before you sprinkle it throughout your code, you should know it has a flaw: it doesn’t work well in modular applications. It assumes the caller’s class loader can see the named class, which you know isn’t always true when you enforce modularity.
How does this affect you as an OSGi developer? Any class you attempt to load using Class.forName() must either be contained, imported, or boot-delegated by the bundle making the call. When you’re loading from a selection of known classes, this isn’t a big deal; but if you’re providing a general utility (such as an aspect-weaving service), there’s no way to know which classes you may need to load. And even if you happen to know, you may decide to keep things flexible for the future. If you remember our discussion on discovering imports from section 6.1.3, you may think this sounds like a job for dynamic imports:
DynamicImport-Package: *
But dynamic imports only work when the wanted packages are exported. In addition, your bundle can get wired to many different packages in numerous client bundles. If any one of these bundles is refreshed, your bundle will also end up refreshed, which in turn may affect the other bundles. Finally, you can import only one version of a package at any one time. If you want to work with non-exported classes or handle multiple versions of the same code concurrently, you need to find another way to access them.
Whenever you work with OSGi class loading, always remember that well-defined rules govern visibility. It’s not some arbitrary decision about who sees what. Every loaded class must be visible to at least one class loader. Your bundle may not be able to see the client class, but the client bundle certainly can. If you can somehow get hold of the client class loader, you can use it to load the class instead of using your own class loader. This job is much easier if the method arguments already include a type or instance of a type that you know belongs to the client. Let’s see how easy it can be with the help of the sixth spoke implementation.
Listing 8.3. Audited spoke implementation
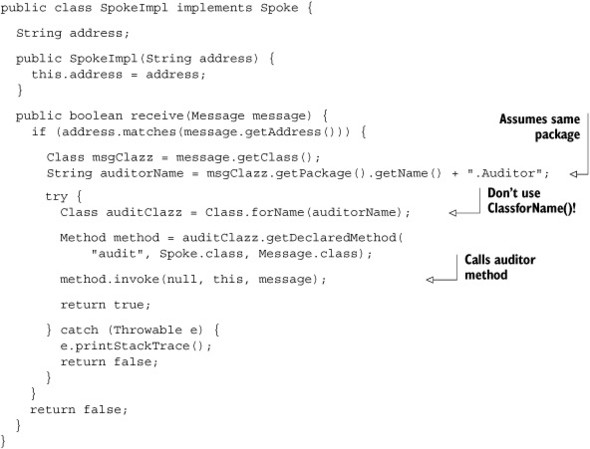
This spoke assumes each Message implementation has an accompanying Auditor class in the same package and uses reflection to access it and log receipt of the message. The reason behind this design isn’t important; you can imagine that the team wants to support both audited and non-audited messages without breaking the simple message API. What’s important is that by using Class.forName(), the spoke bundle assumes it can see the Auditor class. But you don’t export your implementation packages, so when you run the example, we hope you aren’t too surprised to see an exception:
$ ./chapter08/classloading/PICK_EXAMPLE 6

java.lang.ClassNotFoundException: org.foo.hub.test.Auditor
You know the Auditor sits alongside the Message implementation in the same package, so they share the same class loader (you don’t have any split packages). You need to access the Message implementation class loader and ask it to load the class like so:
Class auditClazz = msgClazz.getClassLoader().loadClass(auditorName);
Remove the Class.forName() line from the spoke implementation in listing 8.3, and replace it with the previous line. You can now run the example without any problem:
$ ./chapter08/classloading/PICK_EXAMPLE 6

Fri Sep 18 00:13:52 SGT 2009 - org.foo.spoke.SpokeImpl@186d4c1
  RECEIVED Testing Testing 1, 2, 3...
You may wonder why we don’t use the longer form of Class.forName()—the method that accepts a user-given class loader instead of using the caller’s class loader. We don’t use it because there’s a subtle but important difference between these statements:
Class<?> a = initiatingClassLoader.loadClass(name);
Class<?> b = Class.forName(name, true, initiatingClassLoader);
First, consider loadClass(). The initiating class loader is used to initiate the load request. It may delegate through several class loaders before finding one that has already loaded the class or can load it. The class loader that defines the class (by converting its byte code into an actual class) is called the defining class loader. The result of the load request is cached in the defining class loader in case anyone else wants this class.
Now consider forName(). Although it behaves like loadClass() when looking for new classes, it caches the result in both the defining and initiating class loaders. It also consults the initiating loader cache before delegating any load request. With loadClass(), the resulting class can depend on your context, perhaps according to which module you’re currently running in. But with forName(), you get the same result regardless of context. Because this extra caching may lead to unexpected results in a dynamic environment such as OSGi, we strongly recommend you use loadClass() instead of forName().
In the last example, you found the client class loader by examining one of the arguments passed into your method and used that to look up the client’s Auditor class. What if none of the method arguments relate to the client bundle? Perhaps you can use a feature specifically introduced for application frameworks in Java 2: the Thread Context Class Loader.
8.2.5. Following the Thread Context Class Loader
The Thread Context Class Loader (TCCL) is, as you may expect, a thread-specific class loader. Each thread can have its own TCCL; and, by default, a thread inherits the TCCL of its parent. You can access the TCCL with a single line of Java code:
ClassLoader tccl = Thread.currentThread().getContextClassLoader();
The TCCL is useful when you’re writing code that needs dynamic access to classes or resources but must also run inside a number of different containers such as OSGi. Instead of adding a class-loader parameter to each method call, you can instead use the previous code to access the current TCCL. All the container needs to do is update the TCCL for each thread as it enters and leaves the container. When done properly, this approach also supports nesting of containers, as shown in figure 8.13.
Figure 8.13. Using TCCL with nested containers

You should use a try-catch-finally block to guarantee that the correct TCCL is restored even if an exception or error occurs somewhere inside the container code:
ClassLoader oldTCCL = Thread.currentThread().getContextClassLoader();
try {
  Thread.currentThread().setContextClassLoader(newTCCL);
  ...
} catch (Throwable e) {
  ...
} finally {
  Thread.currentThread().setContextClassLoader(oldTCCL);
}
Let’s see how the TCCL can help you solve a class-loading issue without affecting the API. Run this example:
$ ./chapter08/classloading/PICK_EXAMPLE 7
You should see an exception when the spoke attempts to load the Auditor class:
java.lang.ClassNotFoundException: org.foo.hub.test.Auditor
If you look at this spoke implementation, you’ll see that it uses the TCCL, as shown here.
Listing 8.4. Audited spoke implementation with TCCL
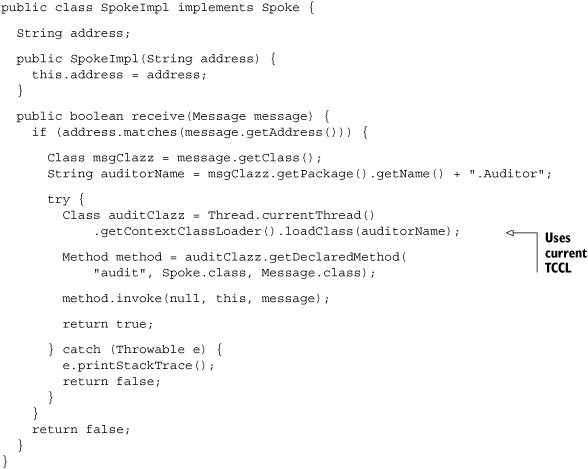
As long as the TCCL is assigned properly by the container or the caller, this should work. The OSGi standard doesn’t define what the default TCCL should be: it’s left up to the framework implementers. This example uses Apache Felix, which leaves the default TCCL unchanged; in other words, it’ll be set to the application class loader. Unfortunately, the application class loader has no visibility of the Auditor class contained within the test bundle, which explains why you see a ClassNotFoundException.
To avoid this exception, you need to update the TCCL in the test bundle before sending the message. To be consistent, you should also record the original TCCL and reset it after the call completes. This last step is important if you want to nest or share containers inside the same process, as you saw in figure 8.13. Look at the test activator contained under org.foo.hub.test; following are the changes needed to set and reset the TCCL.
Listing 8.5. Setting and resetting the TCCL
public Object addingService(ServiceReference reference) {
  ClassLoader oldTCCL = Thread.currentThread().getContextClassLoader();

  try {
    Thread.currentThread().setContextClassLoader(
        getClass().getClassLoader());

    Hub hub = (Hub) ctx.getService(reference);
    hub.send(new TextMessage(".*", "Testing Testing 1, 2, 3..."));

  } catch (Throwable e) {
    e.printStackTrace();
  } finally {
    Thread.currentThread().setContextClassLoader(oldTCCL);
  }
  return null;
}
This listing saves the old TCCL, sets the new TCCL, and then restores the old TCCL. With these three changes, you can rerun the test without any class-loading problems:
$ ./chapter08/classloading/PICK_EXAMPLE 7

Fri Sep 19 00:13:52 SGT 2009 - org.foo.spoke.SpokeImpl@186d4c1
  RECEIVED Testing Testing 1, 2, 3...
That wraps up our discussion of class-loading problems. You used the same example code to see a wide range of different exceptions you may encounter when developing OSGi applications. We hope this will provide you with a foundation for any future class-loading investigations. If you can relate a particular exception with one of the examples here, the associated solution will also help fix your problem.
Unfortunately, class loading isn’t the only problem you’ll encounter when working with OSGi, but the next topic we’ll look at is indirectly related to class loading. OSGi enforces modularity with custom class loaders. An OSGi application contains several class loaders, each one holding on to a set of resources. Unused class loaders are freed as bundles are uninstalled and the framework is refreshed, but occasionally a rogue reference keeps a class loader and its associated resources alive. This can turn into a memory leak.
8.3. Tracking down memory leaks
Memory leaks occur in OSGi applications as in any other Java application. All you need is something like a rogue thread or static field hanging on to one end of a spaghetti ball of references to stop the garbage collector from reclaiming the objects. In a desktop Java application, you may not notice any memory leaks because you don’t leave the application running for a long time. As soon as you restart the JVM, your old application with its ever-growing heap of objects is gone, and you get a brand-new empty heap to fill.
Server-side OSGi applications, on the other hand, can have longer lifetimes; an uptime of many months isn’t unreasonable. One of the strengths of OSGi is that you’re able to install, update, and uninstall bundles without having to restart the JVM. Although this is great for maximizing uptime, it means you have to be careful not to introduce memory leaks in your bundles. You can’t always rely on the process being occasionally restarted. Furthermore, updating a bundle introduces a new class loader to hold the updated classes. If there’s anything holding on to objects or classes from the old class loader, it won’t be reclaimed, and your process will use more and more class loaders each time the bundle is updated or reinstalled.
Class-loader leaks can be more problematic than simple object leaks because some Java runtimes, like Sun’s HotSpot JVM, place classes in a separate heap space called the Permanent Generation, or PermGen for short. This class heap is much smaller than the main object heap, and its capacity is controlled by a different GC setting: -XX:MaxPermSize. If every bundle update adds hundreds of new class revisions without unloading anything, you’ll probably exhaust the PermGen before you run out of object heap space.
Any leak is a cause for concern, but depending on your requirements, not all leaks warrant investigation. You may not even notice certain leaks if they add only a few bytes to the heap every now and then. What’s the best way to find leaks in an OSGi application?
8.3.1. Analyzing OSGi heap dumps
As with debugging, you can continue to use your existing heap analysis skills to examine OSGi applications. Sure, there are more class loaders than in a normal Java application; but standard Java EE containers also contain multiple class loaders, and that doesn’t stop developers from finding memory leaks inside web applications.
Let’s see what an OSGi application heap dump looks like. The leaky application is under chapter08/memory-leaks in the online examples. It consists of a single bundle that creates and accesses a ThreadLocal variable every time the bundle starts and fails to remove it when the bundle stops. Here’s the bundle activator.
Listing 8.6. Leaky bundle activator
public class Activator implements BundleActivator {
  static class Data {
    StringBuffer data = new StringBuffer(8 * 1024 * 1024)
  }

  static final ThreadLocal leak = new ThreadLocal() {
    protected Object initialValue() {
      return new Data();
    };
  };

  public void start(BundleContext ctx) {
    leak.get();
  }

  public void stop(BundleContext ctx) {}
}
Each leaked ThreadLocal takes up a noticeable 8 MB. Following recommended practice, the ThreadLocal is a static member of the class. This is safe because the JVM guarantees to supply a distinct instance of the data object for each thread accessing the ThreadLocal. But how does forgetting to remove the ThreadLocal cause a memory leak? If you read the ThreadLocal Javadoc, you may expect the JVM to clear up stale references (http://java.sun.com/javase/6/docs/api/java/lang/ThreadLocal.html):
Each thread holds an implicit reference to its copy of a thread-local variable as long as the thread is alive and the ThreadLocal instance is accessible; after a thread goes away, all of its copies of thread-local instances are subject to garbage collection (unless other references to these copies exist).
If the bundle has been updated and the framework refreshed, surely the stale data object is no longer accessible and should be removed, right? Unfortunately, the Java 5 ThreadLocal implementation has a subtle behavior that causes it to hang on to values longer than is strictly necessary.
The Java 5 ThreadLocal implementation only clears stale thread-local map entries if set() or remove() is called on another ThreadLocal for the same thread. In the worst case, even this isn’t guaranteed to purge all stale thread-local map entries.
As you’ll soon see, missing the remove() call in stop() means that the data object is kept alive indefinitely because you don’t use any other ThreadLocals in the example. This in turn keeps your class loader alive. Let’s see this leak in action:
$ cd chapter08/memory-leaks

$ ant dist

$ java -verbose:gc -jar launcher.jar bundles

[GC 4416K->318K(15872K), 0.0066670 secs]
[GC 926K->327K(15872K), 0.0040134 secs]
[Full GC 327K->327K(15872K), 0.2674688 secs]
Bundle: org.foo.shell.tty started with bundle id 3
->
Try updating the leaky bundle:
-> update 1
Here, 1 is the ID of the leaky bundle, as reported by the bundles command. You should see the heap expand each time you call update:
[GC 17857K->16753K(32324K), 0.0376856 secs]
[Full GC 16753K->16750K(32324K), 0.0329633 secs]
If you continue to update the bundle, you’ll eventually get an OutOfMemoryError:
org.osgi.framework.BundleException:
  Activator start error in bundle org.foo.leaky [1].
...
Caused by: java.lang.OutOfMemoryError: Java heap space
...
Unable to execute: update 1
Let’s try to analyze this memory leak. Restart the framework with heap dumps enabled:
$ java -XX:+HeapDumpOnOutOfMemoryError -jar launcher.jar bundles
Repeatedly update the leaky bundle until the OutOfMemoryError occurs:
java.lang.OutOfMemoryError: Java heap space
Dumping heap to java_pid1916.hprof ...
Heap dump file created [238744986 bytes in 16.578 secs]
You should now have a heap-dump file in your current working directory. Plenty of open-source tools work with heap dumps; in this case, you’ll use the Eclipse Memory Analyzer (MAT, http://eclipse.org/mat/). This tool provides a graphical view of the heap and several useful reports to quickly identify potential leaks. Let’s see how it copes with an OSGi application. Figure 8.14 shows the leak suspect report for the captured heap dump.
Figure 8.14. Leak suspects reported by the Eclipse Memory Analyzer
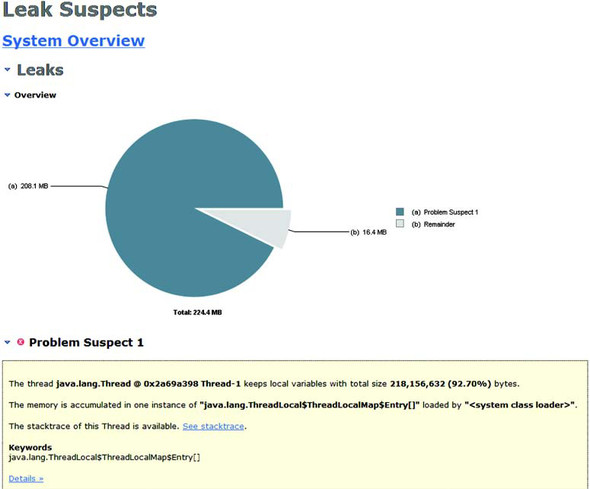
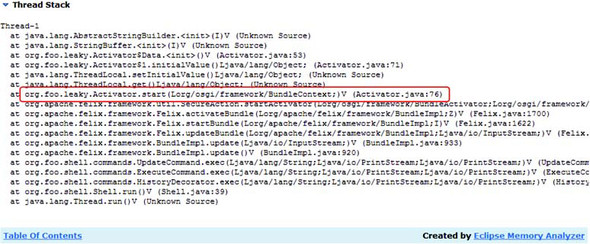
Notice how it correctly identifies the ThreadLocal as the root of the leak. But can it tell you what application code was responsible? To find out, click the Details link at the bottom. Doing so opens a detailed page about the ThreadLocal, including the various thread stacks that created the instances (see figure 8.15). It clearly shows the bundle activator start() method is the one responsible for creating all these instances. With your knowledge of the OSGi lifecycle, you can infer that the problem is in the activator stop() method.
Figure 8.15. Leaking thread stack identified by the Eclipse Memory Analyzer
To solve this leak, all you need to do is go back to the bundle activator and add a call to remove() the ThreadLocal in the stop() method. This forces the underlying data object to be cleared and means the bundle’s class loader can be collected on each update/refresh. You should now be able to continually update the bundle without incurring an OutOfMemoryError.
This example shows that analyzing heap dumps from OSGi applications is similar to analyzing dumps from everyday Java applications. You’ve also seen that misbehaving code can cause memory leaks in OSGi as with any other container. But are any leaks specific to OSGi?
8.4. Dangling services
In addition to the everyday leaks Java developers have to be careful of, the OSGi framework introduces a new form of memory leak to trap the unwary: dangling services. But what exactly do we mean by dangling?
In section 4.3.1, we discussed why it’s a bad idea to access a service instance once and store it in a field: you don’t know when this service is unregistered by the providing bundle. Your bundle continues to keep a strong reference to the original service instance and its entire graph of references long after the providing bundle has been updated or uninstalled (see figure 8.16). You’re also keeping alive the class loaders of any classes used by this instance. As with many memory leaks, you can end up with a significant amount of space being kept alive by a single field. Clearing this field frees everything and allows your application to continue running.
Figure 8.16. Classic dangling service

How do you find this one field in the metaphorical haystack that is your application?
8.4.1. Finding a dangling service
In an ideal world, your application won’t resemble a haystack! Often, you’ll have some idea where the leak may be, because of the bundles involved. For example, if bundle A leaks when it’s updated, and you know that it’s used only by bundles X and Y, you can concentrate your search on those three bundles. This is another benefit of modularity: by enforcing module boundaries and interacting indirectly via the service registry, you reduce the contact points between modules. You no longer have to read through or instrument the entire code base for potential references, because different concerns are kept separate from one another. But regardless of how much code you have to look through, you can use a couple of techniques to narrow the search, ranging from high-level queries to low-level monitoring.
Querying the Framework
You can perform high-level monitoring by using facilities built into the OSGi framework to track service use. The Bundle API has a method called getServicesInUse() to tell you which services the OSGi framework believes a given bundle is actively using at any given time. Remember from chapter 4 that this is done by tracking calls to getService() and ungetService(). Unfortunately, many developers and even some service-based frameworks don’t call ungetService() when they’re done with a service, which can lead you to think there is a leak where there isn’t one. This approach also doesn’t detect when a direct reference to the service escapes from the bundle into some long-lived field. You can also use the getUsingBundles() method from the ServiceReference API to perform a reverse check and find out which bundles are using a given service, but this too doesn’t account for incorrectly cached instances.
Monitoring With JVMTI
Low-level monitoring is possible using the JVM Tools Interface (JVMTI, http://java.sun.com/javase/6/docs/platform/jvmti/jvmti.html). JVMTI is a native API that provides several ways to interrogate, intercept, and introspect aspects of the JVM such as the Java heap, locks, and threads. There are open source agents that can analyze the heap to find leak candidates. It should be possible to take these generic agents and develop them further to add knowledge about OSGi resources, so they can watch for references to OSGi service instances on the Java heap and determine which bundle is responsible for holding on to them. A recent example of this is the OSGi inspector agent (http://wiki.github.com/mirkojahn/OSGi-Inspector).
Just as you saw when debugging, it’s one thing to find out why something is happening; being able to do something about it (and, in this case, protect against it) is even more important.
8.4.2. Protecting against dangling services
The simplest way to protect against dangling services is to let a component framework such as Declarative Services manage services for you. Component frameworks are discussed in detail in chapters 11 and 12; for now, you can think of them as watchful parents that protect their children from the harsh realities of the world. But even component frameworks may not be able to help against rogue clients that stubbornly refuse to relinquish references to your service. You somehow need to give these bundles a reference that you can clear yourself, without requiring their cooperation.
One way to do this is by using a delegating service proxy. A delegating service proxy is a thin wrapper that implements the same set of interfaces as the original service. It contains a single reference to the real service implementation that can be set and cleared by methods only visible to your registering bundle. By registering this delegating proxy with the service registry instead of the real service implementation, you stay in control. Because client bundles are unaware of the internal indirection, they can’t accidentally keep a reference to the underlying service. As figure 8.17 shows, you can decide to sever the link at any time.
Figure 8.17. Delegating service proxy

Notice that there’s still a small leak, because the rogue client maintains a strong reference to the service proxy. But this should be much smaller than the graph of objects and classes referenced by the actual service implementation; otherwise, you don’t gain much by using a proxy.
You can see an example of a service proxy in the code examples:
$ cd chapter08/dangling-services

$ ant dist

$ java -jar launcher.jar bundles
<3> thread="main", bundle=2 : logging ON
->
The log client is taken from the broken_lookup_field service example from chapter 4. It caches the log service instance in a field and repeatedly calls it every few seconds:
<3> thread="LogService Tester", bundle=2 : ping
Try stopping the log service by going to the OSGi console and typing
-> stop 1
<3> thread="Thread-1", bundle=2 : logging OFF
where 1 is the ID of the log service bundle, as reported by the bundles command. You should see an exception when the log client next calls the service:
Exception in thread "LogService Tester"
  java.lang.IllegalStateException: LogService has been deactivated
Your log service proxy has detected that the underlying logger is no longer available and has thrown an IllegalStateException back to the client. In an ideal world, this would make the client take action and clean up after itself. If it doesn’t, the only leak is the service proxy. But what does the service proxy look like? The following listing shows the sample implementation.
Listing 8.7. Delegating service proxy
Proxy.newProxyInstance(
  LogService.class.getClassLoader(),
  new Class[] { LogService.class },
  new InvocationHandler() {
    @Override
    public Object invoke(Object proxy, Method method, Object[] args)
      throws Throwable {
      LogService cachedService = (LogService) loggerMap.get(bundle);
      if (cachedService != null) {
        return method.invoke(cachedService, args);
      }
      throw new IllegalStateException("LogService has been deactivated");
    }
  });
You use JDK reflection to create the proxy, because this approach is less error-prone than creating a new implementation by hand and delegating each method individually. The proxy is defined in the same space as the LogService class and provides the same API. Active logger instances are tracked with an internal shared map. You use reflection to delegate method calls to active loggers and throw exceptions for inactive loggers.
You could manually create delegating service proxies up front, but doing so would only make sense for small numbers of services. For large systems, you want a generic service that accepts a set of interfaces at execution time and returns the appropriate delegating service proxy. Note also that some OSGi component frameworks, which we’ll discuss in chapters 11 and 12, will automatically create delegating service proxies for you. There’s some overhead involved in both memory and performance, so you may only want to consider using a delegating service proxy only when you don’t trust client bundles to do the right thing or your service uses so many resources that even a single leak could be dangerous.
8.5. Summary
We started this chapter with a practical guide to debugging OSGi applications using the console debugger (jdb) and an advanced IDE (Eclipse). We then moved on to specific issues you may encounter while working with OSGi, including seven class-loading problems:
- ClassNotFoundException
- NoClassDefFoundError
- ClassCastException
- Missing uses constraints
- Mismatched uses constraints
- Class.forName issues
- TCCL loading issues
This was followed by a couple of related resource discussions:
- Memory/resource leaks
- Dangling OSGi services
The next couple of chapters should be a welcome break from all this low-level debugging and testing. Look out for fresh, high-level concepts as we discuss managing OSGi bundles and applications!