
The recipes used in this chapter are built around a ReportsApplication. To keep the demonstration of timers simple, a SystemReportManager class is created which issues reports detailing the memory usage of the current JVM. The actual report generated is secondary to learning how to create and use timers. Reporting on JVM memory usage is easy and simple, and its use does not distract from the explanation of timers.
We will create a Java 6 EE application called ReportsApplication. As usual, we will use a packt package to hold our classes and a servlet package to hold the servlet used to drive the application. We will add a simple SystemReportManager class to generate reports and a ReportsServlet to drive many of the timers.
Create a new Java 6 EE application called ReportsApplication. In the EJB module add a packt package. In the WAR module add a package called servlet. Next, add a stateless EJB called SystemReportManager to the packt package. Create a method called getMemoryReport. This method returns a string representing the memory utilized by the current JVM. Within the method add a StringBuilder variable called report. We will build a string containing memory utilization data acquired using the java.lang.Runtime class. It has three methods of interest:
Use the report variable to build a report and then return it as shown here:
@Stateless
public class SystemReportManager {
long duration = 1000;
public String getMemoryReport() {
StringBuilder report = new StringBuilder();
GregorianCalendar reportCalendar = new GregorianCalendar();
Date reportDate = reportCalendar.getTime();
Runtime runtime = Runtime.getRuntime();
DateFormat dateFormat = DateFormat.getDateTimeInstance(DateFormat.MEDIUM, DateFormat.MEDIUM);
report.append("
").append(dateFormat.format(reportDate));
report.append("
Total Memory: ").append(runtime.totalMemory());
report.append("
");
report.append("Maximum Memory: ").append(runtime.maxMemory());
report.append("
");
report.append("Free Memory: ").append(runtime.freeMemory());
report.append("
");
return report.toString();
}
}
Next, create a servlet called ReportsServlet in the WAR module. Use dependency injection to create an instance of the SystemReportManager. Modify the try block of the processRequest method to call the getMemoryReport method.
public class ReportsServlet extends HttpServlet {
@EJB
SystemReportManager systemReportManager;
protected void processRequest(HttpServletRequest request, HttpServletResponse response)
throws ServletException, IOException {
response.setContentType("text/html;charset=UTF-8");
PrintWriter out = response.getWriter();
try {
out.println("<html>");
out.println("<head>");
out.println("<title>Servlet ReportsServlet</title>");
out.println("</head>");
out.println("<body>");
out.println("<h3>" + systemReportManager.getMemoryReport() + "</h3>");
out.println("</body>");
out.println("</html>");
} finally {
out.close();
}
}
protected void doGet(HttpServletRequest request, HttpServletResponse response)
throws ServletException, IOException {
processRequest(request, response);
}
protected void doPost(HttpServletRequest request, HttpServletResponse response)
throws ServletException, IOException {
processRequest(request, response);
}
}
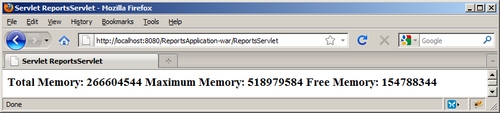
Execute the servlet. The output should be similar to the following screenshot:
The getMemoryReport method used a Runtime object to get JVM memory usage information. A date was created using the GregorianCalendar class as detailed in Chapter 12, Using time within an EJB recipe. All of this was pulled together in a StringBuilder object and returned as a string.