
16
VALIDATION ISSUES IN REGULATORY MODULE DISCOVERY
16.1 INTRODUCTION
Over the last decade, many new techniques have emerged for measuring the functional activity of genes. These include measurements of individual genes through their transcriptional activity, the interaction of their products, or by in vitro experiments with synthesized DNA. For each measurement technique a different set of data is created, each containing information on the functioning of genes, but under differing conditions and with different degrees of experimental error. At the same time, summary information of accepted gene behavior is being collected in the form of the gene ontology database and annotation terms for individual genes. These resources represent accumulated knowledge rather than individual experimental data. Current research is being undertaken to investigate ways in which these rich but diverse sources of information about gene behavior can be combined to provide a more accurate interpretation of experimental work. The goals are two-fold. Firstly, fusing data from diverse sources can be used to stabilize the results from individual experiments. For example, microarray experiments have been generally found to produce data of high variance, and therefore require some form of regularization before results can be interpreted. Secondly, when the data are processed to infer some higher organization among genes, it is essential to have some form of validation of the results.
Work in molecular biology has focused both on identifying the function of individual genes and the way in which they interact in regulation processes. In nature, complex functions of living cells are carried out through the concerted activities of many genes and gene products that are organized into coregulated sets also known as regulatory modules [1]. Understanding the organization of these sets of genes will provide insights into the cellular response mechanism under various conditions. Recently, a considerable volume of data on gene activity, measured using several diverse techniques, has become widely available. By fusing these data using an integrative approach, it may be possible to unravel the regulation process at a more global level. Although an integrated model could never be as precise as one built from a small number of genes in controlled conditions, such global modeling can provide insights into higher processes in which many genes are working together to achieve a task. Various techniques from statistics, machine learning, and computer science have been employed by researchers for the analysis and combination of the different types of data in an attempt to understand the function of regulatory modules.
There are two underlying problems resulting from the nature of the available data. Firstly, each of the different data types (microarrays, DNA-binding, protein–protein interaction, and sequence data) provides a partial and noisy picture of the whole process. They need to be integrated in order to obtain an improved and reliable picture. Secondly, the amount of data that is available from each of these techniques is severely limited. To learn good models, we need considerable amounts of data. Unfortunately, data are only available for a few experiments of each type. These two problems are often cited as a reason for taking an integrative approach. However, integration will filter and obscure some of the information in the actual experimental results, and thus proper validation methods are required to test the effectiveness of any approach.
16.2 DATA TYPES
Various types of data are used to identify regulatory mechanisms. These are primarily generated by molecular biologists using experimental techniques. In most cases, a considerable amount of data processing must be applied before the results can be interpreted.
One of the most important sources of data is genome-wide measurement of mRNA expression levels carried out using microarrays. These have received considerable attention in the last 6 years and various technologies for microarray measurement have been developed [2]. Microarrays allow simultaneous measurement of the expression levels of a large number of genes. Similar expression profiles identify genes that may be controlled by a shared regulatory mechanism. An important point to note is that coregulation does not necessarily imply only positive correlation of expression values, as some of the genes might be downregulated, while others may be upregulated [3]. Processing microarray data to make different experiments as far as possible comparable is known as normalization. A good overview of techniques for normalization and analysis is provided by Quackenbush [4] and a detailled discussion of the statistical issues involved is given by Smyth [5].
Spellman was one of the microarray pioneers who studied the global expression of genes [6]. He studied both the expression variation at various time points in the yeast cell cycle, and, along with other researchers [7], the response of the yeast genes when subjected to various kinds of stress.
A second major source of data is transcription factor–DNA binding data, which is generated as a result of the chromatin immunoprecipitation (ChIP) technique, also popularly known as the ChIP–chip assay. The technique is used to determine whether proteins, including transcription factors, will bind to particular regions of the chromatin within living cells. Harbison et al. determined the global genomic occupancy of 203 transcription factors in yeast, which are all known to bind to DNA in the yeast genome [8]. Lee et al. produced a similar yeast dataset for a smaller number of transcription factors [9]. Both these researchers reported results in the form of a confidence value (statistical P value) of a transcription factor attaching to the promoter region of a gene. The reason behind using statistical techniques was to reduce the experimental errors inherent in microarray technology and to account for multiple cell populations. One of the prominent problems with such approaches is that in order to infer whether a transcription factor is attached to the promoter sequence or not, we have to choose an arbitrary artificial threshold of the P-value.
Transcription factor binding motifs are sequence patterns observed in the intergenic regions of the genome usually located upstream of the genes. They are thought to be responsible for allowing access of transcription factors to binding sites. Initial approaches to identifying these were based on first clustering genes by coexpression and then looking for common sequences in the upstream regions of the genes located in the same cluster. Kellis et al. used comparative genome analysis between three related yeast species to find these motifs [10].
Protein–protein interaction (PPI) data for human and other organisms are available as a result of advances in technologies like mass spectroscopy and yeast two-hybrid assays. There has been a tremendous growth in this type of data in the recent years.
16.3 DATA INTEGRATION
There has been a considerable volume of recent research into data integration in genetics. The methods are often specific to the formalisms used to infer dependency structures from data. Causal networks, for example, Bayesian nets, have been a popular approach to identify the gene regulatory process [11–14]. However, when applied to experimental data alone, the results were poor due to the fact that the data were, and still are, very sparse compared to the large number of variables (genes) that need to be modeled. This is typical of small sample size problems in general. Moreover, there is cyclical feedback operating in gene networks and inference networks generally only handle acyclic relationships among the variables. They need an explicit model of time to be able to deal with feedback. The overall performance of these models was not good and not many verifiable findings were made [12]. In order to improve upon the results, work was done to incorporate better prior knowledge in the Bayesian network-based modeling. Imoto et al. combined PPI, DNA binding, promoter element motifs as well as literature text mining [15]. Tanay et al. also used similar diverse datasets to build Bayesian network models [16, 17].
A more promising pragmatic approach, which we call weakly supervized module identification, did yield very good results and is still used in current research [1, 18]. The method takes a list of potential regulators and the microarray expression data as input. An initial clustering of the genes is carried out, which is then refined using an iterative procedure, based on the expectation maximization (EM) algorithm. For each cluster of genes, it searches for a regulation program that provides the best prediction of the expression profiles of genes in the module as a function of the expression of a small number of genes from the regulator set. After identifying regulation programs for all clusters, the algorithm re-assigns each gene to the cluster whose program best predicts its behavior. It iterates till convergence, refining both the regulation program and the gene partition in each iteration. To test the method, they integrated a set of regulators from the Saccharomyces Genome Database (SGD) and the Yeast Proteome Database (YPD). They obtained modules that showed significant similarity in promoter element motifs as well as in the database compiled by the Gene Ontology Consortium (2001). Despite its success, one of the biggest shortcomings of this research was that the biological prior knowledge that was incorporated was almost of an insignificant level. Only the names of transcription factors were employed by Segal. At about this time, more significant prior knowledge started becoming available in the form of ChIP–chip DNA binding data and other sources as described in an earlier section. The next step of research focused on ways of integrating these datasets in order to find gene modules.
The algorithm called Signature [19] takes a similar approach, clustering genes and conditions together using expression data. The input to the algorithm is a set of genes and, in the first step, the experimental conditions under which these genes change their expression above a threshold are chosen. In the second stage, all genes that have changed expression significantly under these conditions are selected. The consistency of the clustering result is evaluated by analyzing the recurrence of the output gene sets in their resulting modules when the input is mixed with irrelevant genes. The idea is that the results of any good algorithm should not deviate too much when slight perturbations are introduced in the data. A module is considered to be reliable if it is obtained from several distinct slightly perturbed input gene sets. Since the clusters are refined in two stages, there can be no guarantee that the results are clustered in an optimal manner. A better formulation might be to use the EM algorithm in order to maximize the objective function.
The Genetic Regulatory Modules (GRAM) algorithm uses a more strongly supervized method for discovering regulatory modules. It combines microarray expression data with DNA-binding data. DNA-binding data provide direct physical evidence of regulation and thus offer an improvement on previous work in which only indirect evidence of interaction was used for prior information [20]. Similar work was carried out by Lemmens et al. [21]. In this work, a very simple and intuitive algorithm was used to find coregulated sets of genes that have similar expression profiles, the same binding transcription factors, and a commonality of motifs. The principal difference from earlier algorithms is that where others used motif information to validate their results, Lemmens et al. used it in order to find the modules itself. All parameters, such as the cutoff for various datasets, have been chosen without much justification, and the basic idea seems very similar to the work in GRAM. Some of the comparison metrics used do not seem very sound, for example, average functional enrichment values have been calculated for the modules without normalizing to account for the size of the modules. Similarly, summary statistics like the minimum and maximum number of genes in the modules do not provide relevant information for comparing the algorithms.
Tanay et al. analyzed several diverse datasets in an attempt to reveal the modular organization of the yeast regulation system. They defined modules as groups of genes with statistically significant correlated behavior across the diverse datasets. Their algorithm is called Statistical-Algorithmic Method for Bicluster Analysis (SAMBA) and is an extensible framework that can be easily updated as new datasets become available. In their analysis, they have integrated expression, PPI, and DNA-binding datasets. The positive aspect of their approach is that it utilizes all sources of information in one uniform representation and only requires a measure of similarity of genes across a subset of properties. It also allows overlapping modules (with common genes), which is not a feature of traditional clustering algorithms. One of the limitations of their approach is that all sources of data are assigned equal weights and it is not possible to weigh them separately according to reliability or importance [16]. More recently, they analyzed more diverse datasets and focused more on the biological significance of the results, explaining them much more fully. They proposed that work should be carried out on integration across species on the basis that transcription modules are highly conserved among species.
Huang and Pan investigated clustering solutions using a K-medoids algorithm [22]. They incorporated prior knowledge by modifying the distance metric used while clustering. They clustered microarray expression data while deriving biological knowledge about the known similarity between pairs of genes from gene ontology. The authors used a shrinkage approach for the distance metric to shrink it toward zero in cases where there is strong evidence that two genes are functionally related. In a later piece of work, Pan used known functions of genes from existing biological research to assign different prior probabilities for a gene to belong to a cluster [23]. He developed an expectation maximization algorithm for this stratified mixture model.
Troyanskaya et al. developed a generic meta framework, known as Multisource Association of Genes by Integration of Clusters (MAGIC), for integration of diverse sources of data. It is called “meta” because it does not directly integrate the datasets but uses results from other techniques like clustering and combines them with other evidence [24]. Their proposed framework is based on a Bayesian network whose conditional probability tables have been built with the advice of yeast genetic experts. Given a pair of genes, it outputs the probability that they are functionally related after weighing the evidences from various sources. Evaluation of the predictions from the system was done using gene ontology data.
Most of the techniques that we have described work well for real (numerical) data but are less effective when dealing with string data, for example, gene sequences, or graph data such as protein interactions. In many cases, ad-hoc techniques have been deployed. In an approach to this problem, Lanckriet et al. proposed a framework where such diverse data could be merged in a principled manner [25]. It is based on kernel methods in which algorithms work on kernel matrices that are derived from pairwise similarity among variables using so-called kernel functions [26]. If a valid kernel function can be defined to encode the similarity between two variables, then the methods are applicable regardless of the different types of data—strings, vectorial or graphical—being used. This framework will provide a means to integrate more diverse types of data when they become available in the future. The original paper proposed the framework only for supervized learning, but extensions to unsupervised learning are possible.
16.4 VALIDATION APPROACHES
In essence, discovery of regulatory mechanisms comes down to clustering genes that show similar behavior in some context, for example, co-expression in a microarray experiment. The validation problem is to determine how good the resulting clusters are. As yet, no generally accepted method has emerged to address it. Approaches may be divided into those that are purely statistical (internal validation) and those that take into account some measure of biological significance of the clusters (external validation). The term external meaning that further information, not involved in the clustering process, is used for the validation. In contrast, internal validation uses only the data from which the clusters are derived. Those in the latter class are drawn from traditional statistical methods [27], and more recent approaches stem from studies into data mining [28].
16.4.1 Internal Validation Methods
Traditional internal methods use three criteria to validate a set of clusters: compactness, separation, and connectedness. The first two criteria have their roots in well-known statistical pattern classification work. Generally, the input data are used to create an affinity (or similarity) matrix from the measurements. Genes that are strongly correlated in the measurement space have high similarity values in the affinity matrix. Spectral clustering is then used to partition the affinity matrix. The matrix can be re-ordered so that clustered items are located together in submatrices about the diagonal. Ideally, gene pairs in each individual cluster will have high similarity values and the compactness can be measured by finding the average similarity in the submatrix corresponding to each cluster. Separation can be estimated from the affinity matrix elements outside the class submatrices. These elements represent the degree of similarity of genes belonging to different classes and should ideally be zero. These two measures validate the clusters in a manner analogous to the way in which Fisher's linear discriminant analysis finds the space where a set of classes have the smallest within-class variance (compactness) and maximal between-class variance (separation). Connectedness is a different concept that looks at the overlapping between classes. The most connected classes are those with a Gaussian distribution. Those with multimodal distributions have poorer connectedness. We can assess this by testing the nearest neighbors to a class centroid to see what proportion belong to that class. The use of these individual measures and the methods for combining them are rather heuristic in nature, and the results will be dependent on the data used.
Another important class of statistial methods that can be used to validate a clustering solution is resampling. Following this approach, bootstrap datasets are drawn from the original data by sampling with replacement. Each bootstrap set is then clustered and the resulting set of clusters is examined for consistency. Consistent clustering between the different bootstrap datasets is taken to be an indication that the clustering solution is good.
Comparision of different clustering solutions can be done using a well-established measure of cluster similarity, namely the adjusted Rand Index. Milligan and Cooper [29] carried out an extensive empirical study on several such measures and found this index effective even when comparing partitions with different numbers of clusters. The Rand index works by pairwise matching on each of the clusters that are being compared. Given two clusterings C1 and C2 of the same dataset, we define:
- N11: the number of pairs of objects in the same cluster in both C1 and C2.
- N00: the number of pairs of objects in different clusters in both C1 and C2.
- N01: the number of pairs of objects in different clusters in C1 but same cluster in C2.
- N10: the number of pairs of objects in the same cluster in C1 but different clusters in C2.
The Rand index is simply the fraction of items in agreement to the total
When the two partitions are identical, the Rand Index is 1, whereas it reaches 0 when they have nothing in common. Unfortunately, the expected value of the Rand index for two random partitions is not zero. The adjusted Rand index corrects for this, in effect normalizing the range [30]. It takes the form
Its maximum is bounded at 1, but it returns zero for random clusters.
Some evaluation of other statisticals methods for validating clusters in gene expression data has been carried out by Yang et al. [31].
16.4.2 Measures of Biological Significance
External measures of the quality of a clustering solution are made by using other knowledge about the functioning of the genes in a cluster. To this end, genes can tagged with labels, referred to as annotations, attributes, or terms, that give an indication of their known functions. Early attempts to create curated databases describing gene function were inconsistent in their use of terms. However, the Gene Ontology Consortium was recently formed to provide a unified description vocabulary that is generally accepted and continuously evolving [32]. An important publicly available source of genetic knowledge is the The Gene Ontology (GO) database, which provides a set of standard terms that can be used to annotate individual genes. The terms are divided into three groups corresponding to cellular components, biological processes, and molecular functions. Generally, the terms describe functionality without reference to specific conditions in which those functions are carried out. Examples of molecular function are catalytic activity, transporter activity, and binding. Genes are annotated with terms on the basis of accepted experimental evidence that may originate from many sources. The sources are also recorded, since some provide better evidence of the annotation than others. The ontology is created by a set of relations between terms. This forms a semantic network in which each node is a term and the directed arcs are the relations. The relations are is_a and part_of. For example, a nuclear chromosome is_a chromosome and a nucleus is part_of a cell, since there are other parts of a cell and not all cells have nuclei. These relations impose a partial ordering on the terms, with those at higher levels expressing more generality. A term may have multiple parents, and a constraint is that all parents of a term must be applicable to any gene annotated by that term. The descriptive power of the GO database makes it attractive for research into gene function in cell regulation. It encapsulates the prior knowledge of gene function that should be used when making any inference from new experimental data.
Applying the knowledge encapsulated in the GO database to cluster validation is not straightforward and is currently an active area of research. There are many terms, and in a given set of experimental data, each term may be more or less significant as a cluster discriminant. One approach to deciding the significance of a particular annotation within a cluster is to ask whether there are more genes annotated to that term than would be expected in a random cluster. For this purpose, the hypergeometric distribution has been investigated by several researchers [33–35]. The hypergeometric distribution is calculated for a particular term using
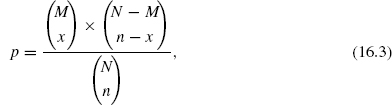
where p is the probability that if n genes are selected at random from the background set then x of them will be annotated by the term in question. N and M describe the background set of genes, N is the number and M the number annotated with the term in question. The background set of genes will in general represent all the genes involved in the experiment. Terms with high p values are less effective at discriminating classes than those with low p values.
Given a clustering solution where the genes are labeled by the GO terms that form significant discriminants for that experiment, the question of assessing the quality of that clustering solution can be looked on as a multivariate problem. Each annotation term used in the total that has been clustered can be considered a variable and each gene in a cluster will contain a binary value for that term (annotated or not), which can be organized as a binary attribute vector. Cluster quality methods based on the attribute vector have been investigated [36]. A promising approach uses information theory [37]. This method is based on calculating the mutual information between the clusters and the attributes. For each term, the number of genes annotated by that term in the cluster is counted. This forms a matrix between the clusters and the terms which can be normalized into a joint probability distribution. Calculating the Kullback–Leibler divergence of this distribution returns the mutual information between the clusters and the terms attributed to their genes. A high value of this entropy indicates a high degree of biological significance in the cluster. A low value indicates that the terms are distributed evenly among the clusters and thus the clusters do not have much biological significance. A popular quality measure is the z-score, which is computed by comparing the mutual entropy of a given partition to the expectation for random partitions.
An approach, known as Renisk's similarity, combines both statistical and topological information, and has been extensively studied [38]. In GO, the information shared by two terms is computed from the set of common ancestors. In general, the higher up in the ontology a term is, the lower the information associated with it. The objective is, therefore, to find the lowest common ancestral term and use its information content as the similarity measure. The information is equated to the negative log of the probability that a gene is annotated to that term or its descendents.
One important question to be resolved in using the GO to validate a clustering solution is the level of detail at which any of the above tests are applied. To increase the generality, terms can be replaced by their ancestors at a given level of the ontology. The higher the level to which the terms are projected, the smaller the total number of terms in any validation problem. This integrative process could offer significant advantages in reducing noise and stabilizing the results, but requires further study into how the optimal level could be found.
Some recent studies have looked into the question of combining statistical and biological validation methods [39]. A comparison of statistical and ontology-based approaches to validation was carried out by Bolshakova et al. [40], and a method for resolving differences in the results of differing validation methods has been investigated by Pihur et al. [41].
16.5 CONCLUSIONS
In modern molecular biology, there is increasingly a chain of processing steps that must be undergone before any experimental results can be interpreted. At the lowest level, microarray experiments require normalization, and at higher levels of abstraction, data fusion and integration is required to stabilize experimental results. This processing separates the scientist from the data and may introduce errors and artefacts. There is, therefore, a need for proper validation of any high-level functionality interpreted from experimental data.
GO is emerging as a powerful resource for recording accepted knowledge about gene functions in a way that allows automatic statistical testing and analysis. Validation methods have been proposed and have met with some success; however, the field is still in its infancy. The information richness of the emerging GO offers the potential for development of powerful new validation methods.
REFERENCES
1. E. Segal, M. Shapira, A. Regev, D. Pe'er, D. Botstein, D. Koller, and N. Friedman. Module networks: identifying regulatory modules and their condition-specific regulators from gene expression data. Nat. Genet., 34(2):166–176, 2003.
2. A. Schulze and J. Downward. Navigating gene expression using microarrays–a technology review. Nat. Cell. Biol., 3(8), 2001.
3. M. Elati, P. Neuvial, M. Bolotin-Fukuhara, E. Barillot, F. Radvanyi, and C. Rouveirol. Licorn: learning co-operative regulation networks from gene expression data. Bioinformatics, 23(18):2407–2414, 2007.
4. J. Quackenbush. Microarray data normalization and transformation. Nat Genet, 32(Suppl):496–501, 2002.
5. G. K. Smyth, Y.H. Yang, and T. P. Speed. Statistical issues in cDNA microarray data analysis. Methods Mol. Biol., 224:111–136, 2003.
6. P. T. Spellman, G. Sherlock, M. Q. Zhang, V. R. Iyer, K. Anders, M. B. Eisen, P. O. Brown, D. Botstein, and B. Futcher. Comprehensive identification of cell cycle-regulated genes of the yeast Saccharomyces cerevisiae by microarray hybridization. Mol. Biol. Cell., 9(12):3273–3297, 1998.
7. A. P. Gasch, P. T. Spellman, C. M. Kao, O. Carmel-Harel, M.B. Eisen, G. Storz, D. Botstein, and P. O. Brown. Genomic expression programs in the response of yeast cells to environmental changes. Mol. Biol. Cell., 11(12):4241–4257, 2000.
8. T. H. Christopher, D. G. Benjamin, I. L. Tong, J. R. Nicola, D. M. Kenzie, W. D. Timothy, M. H. Nancy, T. Jean-Bosco, B. R. David, Y. Jane, et al. Transcriptional regulatory code of a eukaryotic genome. Nature, 431(7004):99–104, 2004.
9. T. I. Lee, N. J. Rinaldi, F. Robert, D. T. Odom, Z. Bar-Joseph, G. K. Gerber, N. M. Hannett, C. T. Harbison, C. M. Thompson, I. Simon, J. Zeitlinger, E. G. Jennings, H. L. Murray, D. B. Gordon, B. Ren, J. J. Wyrick, J. B. Tagne, T. L. Volkert, E. Fraenkel, D. K. Gifford, and R. A. Young. Transcriptional regulatory networks in saccharomyces cerevisiae. Science, 298(5594):799–804, 2002.
10. M. Kellis, N. Patterson, M. Endrizzi, B. Birren, and E. S. Lander. Sequencing and comparison of yeast species to identify genes and regulatory elements. Nature, 423(6937):241–254, 2003.
11. N. Friedman. Inferring cellular networks using probabilistic graphical models. Science, 303(5659):799–805, 2004.
12. D. Husmeier. Sensitivity and specificity of inferring genetic regulatory interactions from microarray experiments with dynamic Bayesian networks. Bioinformatics, 19(17):2271–2282, 2003.
13. K. Murphy and S. Mian. Modelling gene expression data using dynamic Bayesian networks. Technical report, Computer Science Division, University of California, Berkeley, CA., 1999. citeseer.ist.psu.edu/murphy99modelling.html.
14. M. Zou and S. D. Conzen. A new dynamic Bayesian network (DBN) approach for identifying gene regulatory networks from time course microarray data. Bioinformatics, 21(1): 71–79, 2005.
15. S. Imoto, T. Higuchi, T. Goto, K. Tashiro, S. Kuhara, and S. Miyano. Combining microarrays and biological knowledge for estimating gene networks via Bayesian networks. In Proceedings of the 2nd Computational Systems Bioinformatics, IEEE Computer Society, 2003, pp. 104–113.
16. A. Tanay, R. Sharan, M. Kupiec, and R. Shamir. Revealing modularity and organization in the yeast molecular network by integrated analysis of highly heterogeneous genomewide data. Proc. Natl. Acad. Sci. USA, 101(9):2981–2986, 2004.
17. A. Tanay, I. Steinfeld, M. Kupiec, and R. Shamir. Integrative analysis of genome-wide experiments in the context of a large high-throughput data compendium. Mol. Syst. Biol., 1(1):msb4100005–E1–msb4100005–E10, 2005.
18. E. Segal, D. Pe'er, A. Regev, D. Koller, and N. Friedman. Learning module networks. J. Machine Learn. Res., 6(Apr):557–588, 2005.
19. J. Ihmels, G. Friedlander, S. Bergmann, O. Sarig, Y. Ziv, and N. Barkai. Revealing modular organization in the yeast transcriptional network. Nat. Genet., 31:370–377, 2002.
20. Z. Bar-Joseph, G. K Gerber, T. Ihn Lee, N. J Rinaldi, J. Y Yoo, F. Robert, D. B. Gordon, E. Fraenkel, T. S Jaakkola, R. A Young, and D. K Gifford. Computational discovery of gene modules and regulatory networks. Nat. Biotechnol., 21(11):1337–1342, 2003.
21. K. Lemmens, T. Dhollander, T. De Bie, P. Monsieurs, K. Engelen, B. Smets, J. Winderickx, B. De Moor, and K. Marchal. Inferring transcriptional modules from chip-chip, motif and microarray data. Genome Biol., 7(5), 2006.
22. D. Huang and W. Pan. Incorporating biological knowledge into distance-based clustering analysis of microarray gene expression data. Bioinformatics, 22(10):1259–1268, 2006.
23. W. Pan. Incorporating gene functions as priors in model-based clustering of microarray gene expression data. Bioinformatics, 22(7):795–801, 2006.
24. O. G. Troyanskaya, K. Dolinski, A. B. Owen, R. B. Altman, and D. Botstein. A Bayesian framework for combining heterogeneous data sources for gene function prediction (in Saccharomyces cerevisiae). Proc. Natl. Acad. Sci. USA, 100(14):8348–8353, 2003.
25. G. R. Lanckriet, M. Deng, N. Cristianini, M. I. Jordan, and W. S., Noble. Kernel-based data fusion and its application to protein function prediction in yeast. In Proceedings of the Pacific Symposium on Biocomputing, January 2004, pp. 300–311. http://psb.stanford.edu/psb-online/proceedings/psb04/.
26. J. Shawe-Taylor and N. Cristianini. Kernel Methods for Pattern Analysis. Cambridge University Press, 2004.
27. J. Handl, J. Knowles, and D. Kell. Computational cluster validation in post-genomic data analysis. Bioinformatics, 21(15):3201–3212, 2005.
28. J. Dopazo. Microarray data processing and analysis. Methods Microarray Data Anal. II, 43–63, 2002.
29. G. W. Milligan and M. C. Cooper. An examination of procedures for determining the number of clusters in a data set. Psychometrika, 50:159–179, 1985.
30. K. Y. Yeung and W. L. Ruzzo. Details of the adjusted rand index and clustering algorithms. supplement to the paper ⣞an experimental study on principal component analysis for clustering gene expression data. Bioinformatics, 17(17):763–774, 2001.
31. C. Yang, B. Wan, and X. Gao. Effectivity of internal validation techniques for gene clustering. In ISBMDA, 2006, pp. 49–59.
32. GeneOntologyConsortium. Gene ontology. Nat. Genet., pp. 25–29, 2000.
33. R. Gentleman. Using go for statistical analysis. Proceedings of COMPSTAT. 2004, pp. 171–180.
34. E. Boyle, S. Weng, J. Gollub, H. Jin, D. Botstein, and J. Cherry. Go::termfinder-opensource software for accessing gene ontology information and finding significantly enriched gene ontology terms associated with a list of genes. Bioinformatics, 20(18):3710–3715, 2004.
35. S. Falcon and R. Gentleman. Using gostats to test gene lists for go term association. Bioinformatics, 23(2):257–258, 2007.
36. I. Gat-Viks, R. Sharan, and R. Shamir. Scoring clustering solutions by their biological relevance. Bioinformatics, 19(18):2381–2389, 2003.
37. F. Gibbons and F. Roth. Judging the quality of gene expression-based clustering methods using gene annotation. Genome Res., 12(10):1574–1581, 2002.
38. H. Wang, F. Azuaje, O. Bodenreiderm, and J. Dopazo. Gene expression correlation and gene ontology-based similarity: an assessment of quantitative relationships. In Proceedings of the 2004 IEEE Symposium on Computational Intelligence in Bioinformatics and Computational Biology, 2004, pp. 25–31.
39. S. Datta and S. Datta. Validation measures for clustering algorithms incorporating biological information. In IMSCCS (1), 2006, pp. 131–135.
40. N. Bolshakova, A. Zamolotskikh, and P. Cunningham. Comparison of the data-based and gene ontology-based approaches to cluster validation methods for gene microarrays. In CBMS '06: Proceedings of the 19th IEEE Symposium on Computer-Based Medical Systems, IEEE Computer Society. Washington, DC, USA, 2006, pp. 539–543.
41. V. Pihur, S. Datta, and S. Datta. Weighted rank aggregation of cluster validation measures: a Monte Carlo cross-entropy approach. Bioinformatics, 23(13):1607–1615, 2007.
1Java Runtime Environment 1.5 or higher has to be installed previously.
2PubMed result from March 2008. This may change as new documents are added to PubMed every day.
3Gale et al. [22] showed that this holds in 98% of all cases.
4Created with WebLogo, available at http://weblogo.berkeley.edu/.
5If one considers the pairwise inter-annotator agreement, measured in various studies to be around 90%; for instance in Morgan et al. [53].
Elements of Computational Systems Biology Edited by Huma M. Lodhi and Stephen H. Muggleton Copyright © 2010 John Wiley & Sons, Inc.