CHAPTER 9
Economic Evaluation of Public Sector Projects
9.1 PUBLIC SECTOR PROJECTS
The projects that are owned, used and financed by the citizenry of any government level are classified as public sector projects. The primary purpose of such projects is to provide services to the citizenry at no profit. The examples of projects related to public sector include hospitals and clinics, educational institutions, transportation, police and fire protection, public housing, postal services etc. It has been observed that such projects often require large initial investments, possibly distributed over several years. Public sector projects do not yield profit, but they do require huge investments that are paid by the appropriate government unit. The successful implementation of the public sector projects provides benefit to the citizenry. It is found that certain undesirable consequences are often associated with the public sector projects. Therefore, the economic analysis of such projects must not only consider these consequences but also should quantify them with great accuracy. To perform an economic analysis of public sector projects, the costs (initial and annual), the benefits, and the disbenefits, if considered, must be estimated as accurately as possible in monetary units.
Costs refers to the estimated expenditures to the government body for construction, operation, and maintenance of the project, less any expected salvage value.
Benefits refers to the advantages expected by the owners i.e. the public.
Disbenefits refers to any expected undesirable consequences to the owners if the project is implemented.
Economic analysis of public sector projects is different from those of private sector projects. For public sector projects, the initial costs are usually large, the expected life is long, and the sources for capital are usually a combination of taxes levied on the citizenry, user fees, bond issues, and private lenders. It is very difficult to make accurate estimates of benefits, disbenefits for a public sector project. The interest rates in the public sector are lower than those for private sector. The methods that are used to perform economic analysis of public sector projects are discussed in the following sections.
9.2 BENEFIT/COST ANALYSIS OF A SINGLE PROJECT
The benefit/cost (B/C) ratio is a fundamental analysis method for public sector projects. In this method, all costs and benefits estimates are converted to a common equivalent monetary unit (P.W., A.W., or F.W.) at the given interest rate. The B/C ratio is then calculated from one of the following relations:
The P.W. and A.W. equivalencies are more used than F.W. values. It is important to note that the sign convention for B/C analysis is a positive sign, so the costs are preceded by a + sign. If salvage values are also estimated, then they are subtracted from costs. If disbenefit values are also estimated then they are subtracted from benefits and placed in the numerator of Eq. (9.1). The decision guidelines are given below:
If B/C ≥ 1.0, accept the project as economically acceptable for the estimates and interest rate applied.
If B/C <1.0, the project is not economically acceptable.
If the B/C value is exactly 1.0 or very near 1.0, non-economic factors will help make the decision for the best alternative.
Another version of B/C ratio, called conventional B/C ratio is calculated as:
In Eq. (9.2) disbenefits are subtracted from benefits and not added to costs. It should be noted that if disbenefits are considered as costs, then B/C value will change considerably. For example, if numbers 12, 10, and 10 represent P.W. of benefits, P.W. of disbenefits and P.W. of costs respectively, then the correct procedure results in ![]() If disbenefits are regarded as costs, then incorrect procedure results in
If disbenefits are regarded as costs, then incorrect procedure results in ![]() which is three times the correct B/C value of 0.2. Thus, it is clear that the manner in which disbenefits are handled affects the B/C value. It should be noted that, no matter whether disbenefits are correctly subtracted from the numerator or incorrectly added to costs in the denominator, a B/C ratio of less than 1.0 by the first method will always yield a B/C ratio less than 1.0 by the second method, and vice versa.
which is three times the correct B/C value of 0.2. Thus, it is clear that the manner in which disbenefits are handled affects the B/C value. It should be noted that, no matter whether disbenefits are correctly subtracted from the numerator or incorrectly added to costs in the denominator, a B/C ratio of less than 1.0 by the first method will always yield a B/C ratio less than 1.0 by the second method, and vice versa.
Yet there is another way to calculate B/C ratio. The B/C ratio obtained from this method is called modified B/C ratio. The following relationship is used to calculate modified B/C ratio:
In Eq. (9.3), benefits, disbenifits, maintenance and operation costs, and initial investment are expressed in terms of either P.W. or A.W. or F.W. Salvage value is included in the denominator as a negative cost. The modified B/C ratio yields a different value than the conventional B/C method, but it does not change the decision to accept or reject the project.
The following examples illustrate the use of B/C ratio in the evaluation of projects:
Example 9.1 University Grants Commission (UGC) is planning to award a grant of ![]() 5,00,00,000 to Jamia Millia Islamia to upgrade its engineering education. The grant will extend over a period of 10 years and will create an estimated savings of
5,00,00,000 to Jamia Millia Islamia to upgrade its engineering education. The grant will extend over a period of 10 years and will create an estimated savings of ![]() 50,00,000 per year in faculty salaries and student-related expenses. UGC uses a rate of return of 5% per year on all grants award. This grant will share UGC funding with ongoing activities, so an estimated
50,00,000 per year in faculty salaries and student-related expenses. UGC uses a rate of return of 5% per year on all grants award. This grant will share UGC funding with ongoing activities, so an estimated ![]() 2,00,000 will be removed from other program funding. To make this program successful,
2,00,000 will be removed from other program funding. To make this program successful, ![]() 5,00,000 per year operating cost will be incurred from the regular maintenance and operation budget. Use the B/C method to determine if the grant is economically justified?
5,00,000 per year operating cost will be incurred from the regular maintenance and operation budget. Use the B/C method to determine if the grant is economically justified?
Solution Let us use annual worth (A.W.) as the common monetary equivalent.
A.W. of investment cost =![]() 5,00,00,000(A/P, 5%, 10)
5,00,00,000(A/P, 5%, 10)
= ![]() 5,00,00,000(0.12950)
5,00,00,000(0.12950)
= ![]() 64,75,000
64,75,000
A.W. of benefits = ![]() 50,00,000
50,00,000
A.W. of disbenefits = ![]() 2,00,000
2,00,000
A.W. of M&o costs = ![]() 5,00,000
5,00,000
Use Eq. (9.2) to obtain conventional B/C ratio as:

The project is not justified, since B/C < 1.0
Use Eq. (9.3) to obtain modified B/C ratio as:
The project is also not justified as expected, since B/C < 1.0
Example 9.2 The fire chief of Delhi has estimated that the initial cost of a new fire station will be ![]() 2,00,00,000. Annual maintenance and operation costs are estimated at
2,00,00,000. Annual maintenance and operation costs are estimated at ![]() 15,00,000. Benefits to citizens of
15,00,000. Benefits to citizens of ![]() 27,50,000 per year and disbenefits of
27,50,000 per year and disbenefits of ![]() 4,50,000 have also been identified. The discount rate is estimated to be 5% per year. Use the B/C method to determine if the fire station is economically justified?
4,50,000 have also been identified. The discount rate is estimated to be 5% per year. Use the B/C method to determine if the fire station is economically justified?
Solution Let us use annual worth (A.W.) as the common monetary equivalent.
A.W. of investment cost = (![]() 2,00,00,000)(0.05) =
2,00,00,000)(0.05) = ![]() 10,00,000
10,00,000
A.W. of benefits = ![]() 27,50,000
27,50,000
A.W. of disbenefits = ![]() 4,50,000
4,50,000
A.W. of M&O costs = ![]() 15,00,000
15,00,000
Use Eq. (9.2) to obtain conventional B/C ratio as:
The project is not justified, since B/C < 1.0
Use Eq.(9.3) to obtain modified B/C ratio as:

The project is also not justified as expected, since B/C < 1.0
9.3 SELECTION BETWEEN TWO MUTUALLY EXCLUSIVE ALTERNATIVES USING INCREMENTAL B/C ANALYSIS
Follow the following steps to compare two mutually exclusive alternatives by benefit/cost analysis:
| Step 1: | Determine the total equivalent costs for both alternatives. (Use either P.W. or A.W. or F. W. equivalencies.) |
| Step 2: | Order the alternatives by total equivalent cost; smaller first, then larger. Calculate the incremental cost (ΔC) for the larger-cost alternative. |
| Step 3: | Calculate the total equivalent benefits and disbenefits estimated for both alternatives. (Use either P. W. or A.W. or F.W. equivalencies). Calculate the incremental benefits (ΔB) for the larger cost alternative. ΔB is calculated as:
where, B is either P.W. or A.W. or F.W. of benefits. D is either P.W. or A.W. or F. W. of disbenefits |
| Step 4: | Calculate the incremental B/C ratio using the following relationship:
|
| Step 5: | Select the higher-cost alternative, if B/C ≥ 1.0, otherwise select the lower-cost alternative. |
The following example illustrates the use of incremental B/C analysis to compare two mutually exclusive alternatives:
Example 9.3 Use incremental B/C analysis at an interest rate of 5% per year to determine which alternative should be selected. Use a 25-year study period.
| Alternative A | Alternative B | |
|---|---|---|
| Initial cost ( |
30,00,000 | 40,00,000 |
| Annual M&O costs ( |
2,50,000 | 3,50,000 |
| Usage cost ( |
3,50,000 | 1,50,000 |
Solution Since most of the cash flows are already annualized, the incremental B/C ratio will use A.W. values. No disbenefits estimates are considered. Follow the steps of the procedure explained above.
| Step 1: | The A.W. of costs is the sum of initial cost and annual M&O costs.
|
| Step 2: | Alternative B has the larger A.W. of costs, so it is the alternative to be incrementally justified. The incremental cost value is
|
| Step 3: | The A.W. benefits are derived from the usage cost. The benefits for the B/C analysis are not the costs themselves, but the difference, if alternative B is selected. The lower usage cost each year is a positive benefit for alternative B.
|
| Step 4: | The incremental B/C ratio is calculated by Eq. (9.5)
|
| Step 5: | The B/C ratio is greater than 1, indicating that the extra costs associated with alternative B are justified. Therefore, select alternative B. |
9.4 SELECTION AMONG MULTIPLE MUTUALLY EXCLUSIVE ALTERNATIVES USING INCREMENTAL B/C ANALYSIS
The procedure for selecting one from more than two mutually exclusive alternatives by incremental B/C analysis is essentially the same as that of the Section 9.3. Follow the following steps to compare more than two mutually exclusive alternatives by benefit/cost analysis:
| Step 1: | Determine the total equivalent costs for all alternatives. (Use either P.W. or A.W. or F.W. equivalencies for equal lives; use A.W. for unequal lives.) |
| Step 2: | Order the alternatives by total equivalent cost; smaller first. |
| Step 3: | Calculate the total equivalent benefits (and any disbenefits estimated) for each alternative. (Use either P.W. or A.W. or F.W. equivalencies for equal lives; use A.W. for unequal lives.) |
| Step 4: | Calculate the B/C for the first ordered alternative. It, indeed, makes the “Do Nothing” the defender and the first alternative the challenger). If B/C < 1, eliminate the challenger, and go to the next challenger. Repeat this until B/C ≥ 1. The defender is eliminated, and the next alternative is now the challenger. |
| Step 5: | Calculate incremental costs (ΔC) and benefits (ΔB) using the following relations:
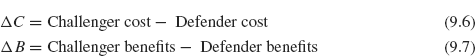
If relative usage costs are estimated for each alternative, rather than direct benefits, ΔB may be found using the relation
|
| Step 6: | Calculate the incremental B/C for the first challenger compared to the defender.
If incremental B/C ≥ 1 in Eq. (9.9), the challenger becomes the defender and the previous defender is eliminated. Conversely, if B/C<1, remove the challenger and the defender remains against the next challenger. |
| Step 7: | Repeat steps 5 and 6 until only one alternative remains. It is the selected one. In all the steps above, incremental disbenefits may be considered by replacing Δ B with Δ(B–D), as the conventional B/C ratio. |
The following example illustrates the use of incremental B/C analysis to compare more than two mutually exclusive alternatives:
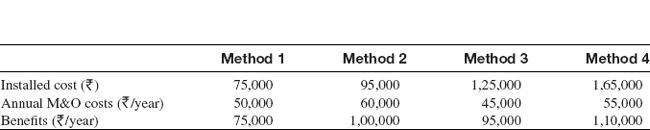
Example 9.4 A pharmaceutical company is considering use of any one of the following four methods to control chemical fume leakage into the surrounding air from a mixing machine. The estimated costs and benefits, in terms of reduced employee health costs, are given for each method. Assuming that all methods have a 10-year life and no salvage value, determine which one should be selected using a M.A.R.R. of 10% per year and the B/C method.
Solution
| Step 1: | Find the A.W. of costs for each technique, order them, and determine the incremental B/C values. A.W. of costs = Installed cost(A/P,15%,10) + A.O.C. |
Method |
A.W. of Cost Calculation |
|---|---|
1 |
|
2 |
|
3 |
|
4 |
| Step 2: | Order of incremental analysis is: “Do Nothing i.e. DN”, Method 1, Method 3, Method 2, Method 4. |
| Step 3: | A.W. of benefits of Method 1, 2, 3, and 4 is given in the problem as |
Step 4, Step 5, Step 6: Method 1 vs DN
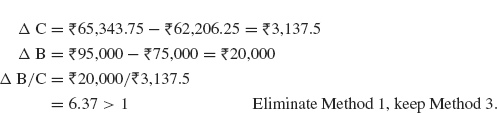
Method 3 vs 1
Method 2 vs 3
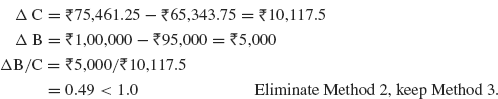
Method 4 vs 3

Step 7: Select Method 3.
PROBLEMS
- Haryana government is considering to extend Bhakra canal into a desert area for irrigation. The initial cost of the project is expected to be
 3,75,00,000 with annual maintenance costs of 6,25,000 per year. (a) If agricultural revenue is expected to be 47,00,000 per year, do a B/C analysis to determine whether the project should be undertaken, using a 15-year study period and a discount rate of 5% per year (b) Rework the problem, using the modified B/C ratio.
 - The annual cash flows (C) for a public project is estimated to be 1,12,50,000 per year, benefits(B) of 1,50,00,000 per year, and disbenefits (D) of 25,00,000 per year. Determine the (a) B/C ratio and (b) value of B – C.
- The B/C ratio for new flood control project along the banks of Yamuna river is required to be 1.2. If the benefit is estimated at 1,50,00,000 per year and the maintenance cost is expected to be 75,00,000 per year, what is the allowed maximum initial cost of the project? The discount rate is 6% per year, and a project life of 50 years is expected.
- The modified B/C ratio for a municipal corporation project is 1.5. If the initial cost is 2,50,00,000 and the annual benefits are 37,50,000, what is the amount of the annual O&M costs used in the calculation, if a discount rate of 5% is considered and the estimated life is 25 years?
- Delhi government is planning a hydroelectric project for Yamuna river basin primarily for the generation of electric power. However, this project will also provide flood control, irrigation and recreation benefits. The estimated costs and benefits associated with the project are given below. Apply (a) conventional B/C ratio and (b) modified B/C ratio to determine whether the project is economically justified. Use a discount rate of 10% per year.
Item Cash Flow Initial cost ( )54,00,00,000 Annual operating and maintenance costs ( /year)1,50,00,000 Annual power sales ( /year)3,60,00,000 Annual flood control savings ( /year)1,50,00,000 Annual irrigation benefits ( /year)2,40,00,000 Annual recreation benefits ( /year)1,20,00,000 Project life in years 30 - Calculate the B/C ratio for the following cash flow estimates at a discount rate of 5% per year.
Item Cash Flow P.W. of benefits ( )9,50,00,000 A.W. of disbenefits ( /year)11,25,000 First cost ( )5,50,00,000 O&M costs ( /year)75,00,000 Project life in years 20 - Two mutually exclusive alternatives are being considered for investment. The cost data and benefit values of these alternatives are given below. Use incremental B/C analysis at an interest rate of 8% per year to determine which alternative should be selected. Use a 20-year study period.
Alternative A Alternative B Initial cost ( )1,50,00,0002,00,00,000Annual O&M costs ( /year)12,50,00015,50,000Benefits ( /year)17,50,0007,50,000 - Solar and conventional alternatives are being considered for providing energy to a far-off site. The data pertaining to these alternatives are given below. Use the B/C method to determine which should be selected at a discount rate of 1% per month over a 5-year study period.
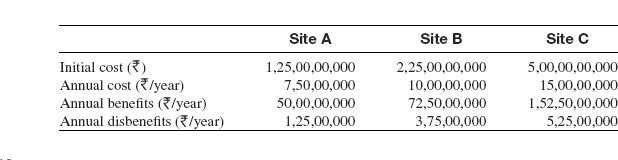
Solar Conventional Initial cost ( )11,25,00,0005,00,00,000M&O costs ( /month)2,50,00012,50,000Salvage value ( )37,50,0000 - The central government is considering three sites for mineral extraction. The cash flows associated with each site are given below. Use the B/C method to determine which site, if any, is best, if the extraction period is limited to 5 years and the interest rate is 8% per year.
- A state government is planning a hydroelectric project for Yamuna river basin primarily for the generation of electric power. However, this project will also provide various other benefits. The estimated costs and benefits associated with three alternatives under consideration are given below. If the interest rate is 8% per year and the life of alternatives is estimated to be 40 years, determine which alternative should be selected using B/C ratio analysis.
