
Chapter 2. Conducting Your Own Cybersecurity Experiments
This chapter delves deeper into the specific steps of the scientific method. Recall that there are five essential elements: asking a question, formulating a hypothesis, making predictions, experimental testing, and analysis. These details will help as you think about using the scientific method in your own situation. After seeing them described here, you’ll apply these steps in practice in the subsequent chapters.
Asking Good Questions and Formulating Hypotheses
Formulating a good question might sound easy, but it can often be harder than it sounds. Most infosec professionals see problems that need solving every day, even if they don’t keep track of them. Trying to think of a problem on the spot can be especially challenging. An economist friend of mine prefers to look for problems in proverbs. To create experimental questions, he asks when is it the case that “when the cat’s away, the mice will play” or “don’t put the cart before the horse?” These can help get you thinking about challenging the folk wisdom of cybersecurity.
Creating a Hypothesis
A hypothesis is a statement and suggested explanation. Based on this statement, you will use scientific experimentation, investigation, or observation to show support or rejection for the hypothesis. A hypothesis is temporary and unproven, but something you believe to be true. The hypothesis must be testable, and experiments can help you decide whether or not your hypothesis is true.
Consider the following example. You’re interested in building a scalable automated malware analysis solution. In order to test scalability, you ask yourself, “how quickly can my solution analyze 100 files to determine if they are malicious?” This is a reasonable question and one that will help you understand and improve your product. However, it’s not a scientific hypothesis because the question isn’t a testable statement. Assume you’ve been working on your product for a while and know that you can analyze one or two files in less than 30 seconds.
Now try making the question testable. Here is a modified version of the question: “Can my solution analyze 100 files in 10 minutes?” This is now a testable proposition. It also has nice properties like the ability to prove it false, and the ability for other people to reproduce the test. What this version lacks are independent and dependent variables. The independent variable is the one single thing you change during the experiment, and the dependent variable is the thing you monitor for impact depending on changes to the independent variable. So, hypotheses can be written as if-then statements in the form “If we change this independent variable, then this dependent variable also changes.”
With this formula in mind, here is a better statement of our hypothesis: “If I use one server, my solution can analyze 100 files in 10 minutes.” This is your educated guess about how many files you can analyze based on previous observations. Not only is it testable, reproducible, and falsifiable, but it has an independent variable (one server) and a dependent variable (the number of files analyzed in 10 minutes). Now you have a well-formulated hypothesis.
Caution
Don’t think of a hypothesis purely as a guess. A guess has no knowledge or observation to back it up, whereas a hypothesis is based on previous observations, measurements, or experiments. You should also be careful about creating a hypothesis that you just want to be true. This bias would threaten the impartiality of the scientific method.
When you read scientific papers, you may occasionally find references to the null hypothesis. The null hypothesis, often written as H0, is the claim that there is no relationship between two variables. When used, the null hypothesis is offered with an alternative hypothesis called H1. The null hypothesis is assumed to be true, and you must show evidence to prove a relationship that rejects or disproves the null hypothesis. For example, you may propose null and alternative hypotheses such as:
- H0
Malware families exhibit no human-discernable visual similarities when visualized by our solution.
- H1
Malware images belonging to the same family exhibit human-discernable visual similarities in layout and texture.
Note
Success in the scientific method is accepting or rejecting any hypothesis.
Accepting the null hypothesis does not mean that your experiment failed! Accepting (or rejecting) any hypothesis is a result.
Warning
Care is required when wording the null and alternative hypotheses. Don’t be tempted to define your null hypothesis simply as the opposite of the alternative hypothesis. Otherwise, you might create a situation where you have to reject both the null hypothesis and the alternative—you want to be able to accept one or the other. For example, say you’re studying the performance gains of a new tool. You define the null hypothesis as “there is no difference in performance” and the alternative hypothesis as “there is a performance gain.” However, if the tool causes a decrease in performance, then you’ve rejected both hypotheses.
Hypotheses can sometimes be obfuscated in scientific papers. You will often find that the hypothesis is implied by the solution or contribution in the paper. In Table 2-1, there are three quotes from papers in the left column, and the corresponding implied hypothesis in the right column. It is not too difficult to infer what the hypothesis was, but it is instructive as you think about how to form hypotheses. Finally, many readers of these papers are ultimately more interested in the results and an explanation of how and why those results occurred.
| Paper text | Implied hypothesis |
|---|---|
| “We found that inhibitive attractors significantly reduced the likelihood that participants would (1) install software despite the presence of clues indicating that the publisher of the software might not be legitimate, (2) grant dangerously excessive permissions to an online game, and (3) fail to recognize an instruction contained within a field of a dialog that they had been habituated to ignore.“a | Inhibitive attractors will reduce the likelihood that users will (1) install dangerous software, (2) grant dangerously excessive permissions to online games, and (3) fail to recognize instructions contained within dialogs that they have a habit of ignoring. |
| “Is there any hope in mitigating the amplification problem? In this paper, we aim to answer this question and tackle the problem from four different angles…Lastly, we analyze the root cause for amplification attacks: networks that allow IP address spoofing. We deploy a method to identify spoofing-enabled networks from remote and reveal up to 2,692 Autonomous Systems that lack egress filtering.”b | The root cause for amplification attacks is networks that allow IP address spoofing. |
| “To discourage the creation of predictable passwords, vulnerable to guessing attacks, we present Telepathwords. As a user creates a password, Telepathwords makes realtime predictions for the next character that user will type… We found that participants create far fewer weak passwords using the Telepathwords-based policies than policies based only on character composition. Participants using Telepathwords were also more likely to report that the password feedback was helpful.”c | If shown a guess as to the next character of a user’s password before he or she types it, then users will create stronger passwords. |
a Your Attention Please: Designing security-decision UIs to make genuine risks harder to ignore. b Exit from Hell? Reducing the Impact of Amplification DDoS Attacks. c Telepathwords: Preventing Weak Passwords by Reading Users’ Minds. | |
With a good question and well-formulated hypothesis in hand, you are ready to consider how you will test your hypothesis.
Security and Testability
How do you know if your system is secure, and what you can actually test? By now you understand the need to scientifically test assurances of security, but system security is meaningless without a statement and specification of security. You and your target audiences could misunderstand each other about what security means without a defined context.
One way to describe security is with a specified security policy. The security policy defines what it means to be secure for a specific system, and the goal of a policy is to achieve some security properties. For example, a policy might say that after three incorrect password attempts, the user is locked out of his or her account. For the owner of this policy, this is one specification of security that, if followed, contributes toward the security of the company. Your definition of security may differ. There are many frameworks and policy-specification languages both for formalizing policies and for formally evaluating the effects of policies.
Validation of a security policy can be accomplished with formal and experimental methods. Formal validation is based on theories, such as the Bell-La Padula confidentiality policy, which are amenable to analysis and verification. On the other hand, experimental testing can evaluate whether a security policy is needed and whether the implementation achieves the desired security property. Say your organization requires continuous monitoring of network traffic to implement a certain security policy. In a series of experiments, you could show the computational and storage load for full packet capture versus various sampling rates of NetFlow. The outcome of these experiments would be actionable information about how to balance costs and benefits in achieving the security policy.
In later chapters we will provide a variety of experiments and examples that illustrate more testable claims of security.
Designing a Fair Test
When conducting an experiment, you may do many tests. It is vital that for each test you only change one variable at a time and keep all other conditions the same. The variable in your test is the one changing factor in the experiment. This practice is key to good science, and following this practice results in a fair test.
Note
A fair test is different from a good experiment. People often use “good” in a colloquial sense to mean interesting, clever, or important. Those are fine goals, too, but are distinct from the experiment’s fairness.
Imagine that you want to test the hypothesis that a particular cryptographic algorithm is faster in C than C++. If you implement the same algorithm in both languages but run one on a laptop and one on a supercomputer, that would be an unfair test because you gave an unfair advantage to the one running on the supercomputer. The only thing that should change is the programming language, and every other part of the test should be as identical as possible. Even comparing C to C++ implies different compilers, different libraries, and other differences that you may not know about. Instead, think about comparing the speed of two different crypto algorithms in a given application.
One serious problem for fair tests is inadequate data sample sizes. This happens because gathering data can be expensive (in time, money, labor, and so on) or because the scientist just didn’t calculate how much data was needed. Consider an experiment to determine the effectiveness of a cybersecurity education campaign at your company. First, determine as best as possible the size of the total population. You may have to guess or approximate. Second, decide on your confidence interval (margin of error), such as ±5%. Third, decide on your desired confidence level, such as 95%. Finally, use an online sample-size calculator to determine the recommended sample size.1 Say your company has 1,000 employees and just did a cybersecurity awareness campaign. You are asked to study whether or not the campaign was effective by surveying a sample of the employees. If you want a 5% margin of error and 95% confidence, you need a sample size of at least 278 employees.
Note
Statistics is a science whose scientists cannot, in general, be replaced simply by an online tool.
Getting the sample size correct gives you statistical power, the ability of the test to detect the relationship between the dependent and independent variables (if one exists). When your sample size is too small, the danger is that your results could be overestimates or exaggerations of the truth. On the contrary, if your sample size is very large and you are looking for tiny effects, you’re always going to find the effect. So, calculate the right sample size in advance. Don’t start with 10 employees in the cybersecurity education campaign study and keep adding more subjects until you get a statistically significant result. Also, document and publish the reasons for choosing the sample size you used. In some fields and journals, sample size is so important that it’s standard practice to publish the study protocol before doing the experiment so that the scientific community can collectively validate it! Experimental protocol outside of computer science and cybersecurity is generally well defined, but could be incompatible with fast-paced developments in cybersecurity.
A problem with proper experimental construction is that you need to identify and address challenges to validity. Validity refers to the truth of the experiment’s propositions, inferences, and conclusions. Could the changes in the dependent variable be caused by anything other than changes in the independent variable? This is a threat to internal validity. Research with a high degree of internal validity has strong evidence of causality. External validity, on the other hand, refers to how well your results can be generalized and applied to other situations or groups. One must often balance internal and external validity in experimental design. For some examples of threats to the validity of cybersecurity studies, see Experimental Challenges in Cyber Security: A Story of Provenance and Lineage for Malware by Dumitras and Neamtiu (CSET 2011).
One challenge with fair tests is that when you create a hypothesis, you make a lot of assumptions. In reality, each assumption is another hypothesis in disguise. Consider a case where university students have been the subject of a phishing attack. The IT security team gives you demographic data about the students who fell for the attack, and you want to find correlations. Were men more likely than women? Were students under age 20 more likely than students over 20? Were chemistry majors more likely than biology majors? You could conduct fair tests by measuring each variable independently. There is also a statistical method called regression which allows you to measure the relative contribution of several independent variables. You’ll see this method in action in Chapter 10.
Analyzing Your Results
The goal of analysis is to determine if you should accept or reject your hypothesis and then to explain why. While we described analysis as the step after experimental testing, it is wise to do some analysis during experimentation and data collection. Doing so will help save time when troubleshooting problems with the experiment.
The analysis step of the scientific method is very experiment-specific. There are a few common techniques that may be applicable to your particular experiment. One technique is to literally look at the data. Constructing graphs can draw your attention to features in the data, identify unexpected results, or raise new questions. The graphs shown in Figure 2-1 helped the authors of a paper on botnets observe that “by comparing the IRC botnet submissions in the two graphs, we can observe that, in 2007, most of IRC botnets were belonging to different clusters. In 2008 instead, we still received an [sic] high number of IRC bots, but they were mostly polymorphic variations of the same family.”
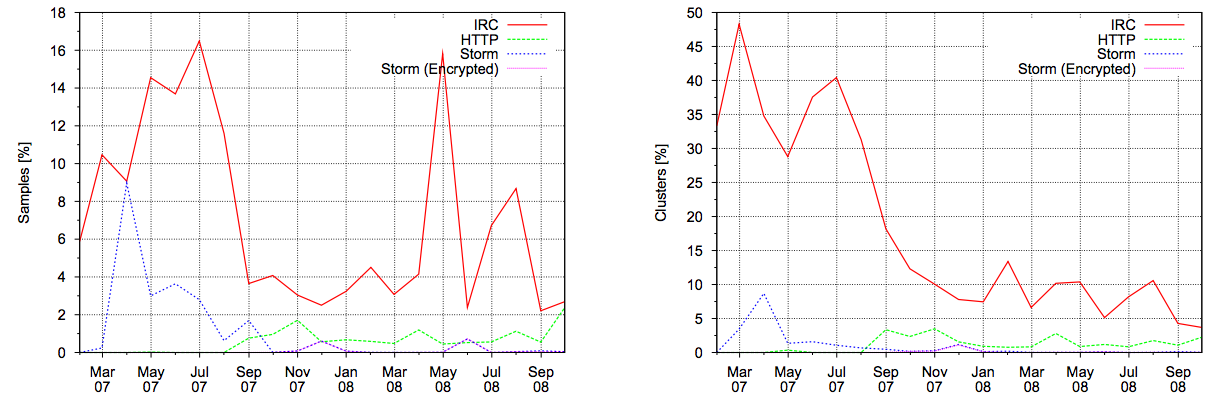
Figure 2-1. Graph of botnet submissions comparing samples to clusters (courtesy of Usenix)
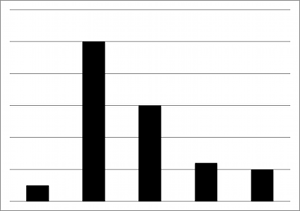
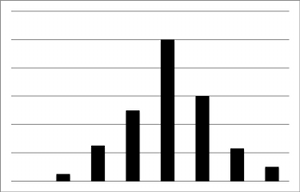
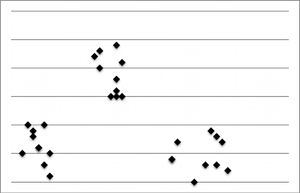
Statistics is probably the most commonly used general-analysis method. It is also a rich and complex field, so we skim only the surface here to introduce general topics of use to you. All scholastic disciplines need a logic. The logic of a discipline is the methodology the discipline uses to say that something is correct, and statistics is one such set of rules. Descriptive statistics describe the basic features of a collection of data, such as the mean, median, mode, standard deviation (or variance), and frequency. Inferential statistics uses samples of a larger dataset to infer conclusions about the larger population. Examples of inferential statistics are Bayesian inference, comparison to specific distributions (such as a chi-square test), grouping by categories (statistical classification), and regression (estimating relationships between variables). Table 2-2 illustrates various distributions of data, and a corresponding analysis method.


One other note about statistics. A statistically significant relationship between two variables is determined from a value called the chi-squared statistic. This chi-squared statistic is a number that quantifies the amount of disparity between the actual observed values and the values that would be expected if there were no relationship in the population. The relationship between two variables is considered statistically significant if its probability of occurring is large enough to rule out it occurring by chance. A p-value is a probability that measures how likely it is to observe the relationship if there’s really no relationship in the population. It is generally accepted that if the p-value is less than or equal to .05, you can conclude that there is a statistically significant relationship between the variables.
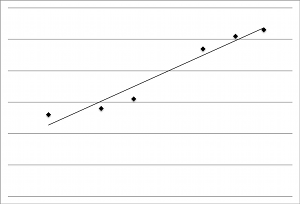
Outside of formal statistical modeling is a method known as exploratory data analysis, which is often used as a first look at experimental data. It has been described as finding the “attitude” of the data, applied before choosing a probabilistic model. Used during or soon after data collection, exploratory data analysis is a cursory look that can reveal mistakes, relationships between variables, and the selection of an analytical method. It is very common to use graphical techniques to explore the data, such as histograms and scatterplots. Remember, however, that as mathematician John Tukey wrote in Exploratory Data Analysis, “exploratory data analysis can never be the whole story.”
Many people are familiar with the adage “correlation does not imply causation.” This error in logic is easy to make if you assume that one event depends (causation) on another for the two to be related (correlation). Correlated events offer scientists valuable insights about things to investigate. However, the legitimate scientist must work to show the cause. Controlled studies can be used to increase confidence that a correlation is a valid indicator of causation. The control group helps show that there is no effect when there should be no effect, as in people who receive a placebo in a drug trial. Say you develop a web browser plug-in that warns people of dangerous web pages. There might be a correlation between how many people use the plug-in and the number of dangerous sites they visit, but you should also measure how many dangerous sites a control group—one without your security plug-in—also visits.
To determine causation, first be sure that the effect happened after the cause (see Figure 2-2). In an experiment to study the effects of fatigue on 10-hour shifts in a network operations center, researchers find that people who are tired make more mistakes. Those researchers should have looked to be sure that mistakes happened after people were tired. You should also be aware that it can be difficult to identify and rule out other variables. In a 2010 study about victims of phishing attacks, the research results suggested that women and participants between ages 18−25 were more susceptible.2 They point out, however, that there were limitations to the study, including the fact that participants might have been riskier in the study than in real life.
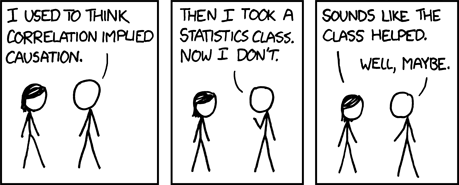
Figure 2-2. XKCD comic on correlation
I will introduce a variety of methodologies and considerations for scientific experimentation and analysis in subsequent chapters of this book. If you wish to skip to any in particular, they can be found as shown in Table 2-3.
| Experimentation/analysis topic | Chapter |
|---|---|
| Fuzzing | Chapter 4 |
| False Positive and False Negatives | Chapter 5 |
| Machine Learning | Chapter 6 |
| Security Assumptions and Adversarial Models | Chapter 7 |
| Reproducibility and Repeatability | Chapter 8 |
| Game Theory | Chapter 9 |
| Regression | Chapter 10 |
| Double-Blind Experimentation | Chapter 11 |
| Evaluating Visualizations | Chapter 12 |
Putting Results to Work
After experimentation and analysis, you will often have useful new knowledge, information, or insights. The most obvious way to apply the knowledge gained from science is to improve the use of tools and improve the tools themselves. Take forensics, for example. Your job is forensic analysis and you found a new open source forensic tool. You designed a scientific evaluation and ran a quick experiment to see which tool performs some forensic function faster or more accurately. Now with the knowledge you’ve gained, you have empirical data about which tool is better for your job.
Sharing your results is an important part of science. Sure, you may have selfish intentions to improve your proprietary product, or you might want to file for a patent. Contributing your results to the public domain does not mean you won’t be rewarded. Google’s papers on the Google File System, MapReduce, and BigTable opened up whole new fields of development, but they did not inhibit Google’s success.
Another way to put your experiment to work is to share the code and data you used. This used to be very rare in computer science, but there is a growing movement toward openness.3 The common repositories for source code are SourceForge and GitHub. There are two common complaints against publishing code. The first concern is that it’s too much work to clean up unpolished or buggy code, and that other users will demand support and bug fixes. I recommend spending a modest amount of time to offer reasonably understandable and useful code, and then making it public as is. The second concern is that your code is proprietary intellectual property. This may be true, but the default decision should be to share, even if it’s only code snippets rather than the whole program.
There are lots of ways to share your work and results. Here are some common options, in order of increasing formality:
- Blogs
Blogs offer an easy way to quickly share results with a broad online audience. Individuals and companies are using this approach. See, for example, Light Blue Touchpaper, Dell SecureWorks, Synack, and Brian Krebs.
- Magazines
Magazines offer an opportunity to publish professionally without the formal process of an academic journal. Examples include SC Magazine and Security Magazine. IEEE Security and Privacy Magazine is a highly respected publication for cybersecurity research but has a more substantial review and editing process.
- Conferences
Presenting at a conference is an opportunity to share your work, get feedback from an audience, and build a reputation. The list of conferences is extensive, and each offers a different kind of audience. Some conferences receive a lot of submissions and only accept a select few. There are a few workshops devoted to cybersecurity science, including the LASER Workshop (Learning from Authoritative Security Experiment Results), Workshop on Cyber Security Experimentation and Test (CSET), and Symposium on the Science of Security (HotSoS). For general cybersecurity research conferences, consider the ACM SIGSAC Conference on Computer and Communications Security (CCS), Black Hat, IEEE Symposium on Security and Privacy, and RSA Security Conferences. So-called hacker conferences, such as BSides, CanSecWest, DEF CON, and ShmooCon, offer an informal venue to present security work and results.
- Journals
Scientific cybersecurity journals are considered the most respected place to publish research results. Journal articles have conventions for content and format: an introduction and subject-matter background, methodology, results, related work, and conclusions. Unfortunately, the acceptance rates are often low, and the time between submission and publication can be many months. Respected journals include Computers & Security and IEEE Transactions on Information Forensics and Security.
A Checklist for Conducting Experimentation
Below is a general list of considerations for conducting scientific experimentation in cybersecurity. It captures the major components of the scientific method, and other important considerations and waypoints. Science is too broad to have a universal and concrete, one-size-fits-all checklist and your experiment will almost certainly have modified or expanded steps, but this serves to guide you and help ensure that the important aspects aren’t overlooked.
Formulate a question to study, the purpose for doing experimentation.
Ensure that the topic is nontrivial and important to solve.
Conduct a literature review and background research to see what is already known about the topic.
Form your hypothesis, ensuring that the statement is testable, reproducible, and falsifiable with an independent and dependent variable.
Make some predictions about your hypothesis.
Assemble a team to help execute the experiment, if necessary.
If studying human subjects, seek institutional review board (IRB) approval.
Test your hypothesis. Collect data.
Make a list of data, equipment, and materials you will need.
Carefully determine the procedure you will use to conduct the experiments.
Identify the environment or test facility where you will conduct experimentation (e.g., laboratory, cloud, real world).
Determine the scientific and study instruments you will use (e.g., packet analyzer, oscilloscope, human survey).
Identify necessary sample size to have statistical power.
Conduct your experiments.
Change only one variable at a time to ensure a fair test.
Record data and observations.
Sanity check the data during collection to be sure data collection is working properly.
Analyze and interpret your data and test results to determine whether you should accept your hypothesis.
Check for experimental errors and outliers. Are the results reasonable?
Document your experiment.
Include a description of your procedures with enough detail for others to reproduce.
Include details of the data, equipment, configurations, and other materials used in the experiment.
Describe the analytical technique(s) you applied and their results.
Explain your conclusions, including why you did or did not accept your hypothesis.
Honestly explain limitations of your data, approach, and conclusions.
Provide considerations for future experiments or impact of your results.
Determine if you should modify your hypothesis and conduct further experimentation.
Put your results to work by publishing a paper, creating a product, or making a recommendation.
Make code and data used in experimentation publicly accessible if possible.
Conclusion
This chapter discussed the execution of the scientific method and key points in designing an experiment. The key takeaways are:
A hypothesis is a testable statement you believe to be true.
In a fair test, only one experimental variable changes at a time and all other conditions remain the same.
Analysis helps you determine whether to accept or reject a hypothesis. Statistics is commonly used for analysis, and sample size determines statistical power.
You can put scientific results to work by building tools and sharing results in blogs, conferences, and journals.
The checklist in this chapter can help ensure that you’ve thought about important components of the scientific method.
References
Matt Bishop. Computer Security: Art and Science (Boston, MA: Addison-Wesley Professional, 2002)
David Freedman, Robert Pisani, Roger Purves. Statistics, 4th Edition (New York, NY: W. W. Norton & Company, 2007)
Learning from Authoritative Security Experiment Results (LASER) Workshops
Dahlia K. Remler and Gregg G. Van Ryzin. Research Methods in Practice (Thousand Oaks, CA: SAGE Publications, Inc., 2010)
David Salsburg. The Lady Tasting Tea: How Statistics Revolutionized Science in the Twentieth Century (New York, NY: Holt Paperbacks, 2002)
Dennis Shasha and Cathy Lazere. Out of Their Minds: The Lives and Discoveries of 15 Great Computer Scientists (New York, NY: Copernicus, 1998)
John W. Tukey. Exploratory Data Analysis (Reading, MA: Addison-Wesley, 1977)
1 One such sample-size calculator can be found at Creative Research Systems.
2 Who Falls for Phish? A Demographic Analysis of Phishing Susceptibility and Effectiveness of Interventions.
3 In 2013, the White House issued a memo directing public access to research funded by the federal government. In 2014, the National Science Foundation, the funding source for a large portion of federal science and engineering research, launched its own initiative for public access to data.