

4.3. THE FULL REPORT FOR CURVE SKETCHING 159
4.3 THE FULL REPORT FOR CURVE SKETCHING
Knowledge Box 4.9
e table for a full report
Roots:
Vertical asymptotes:
Horizontal asymptotes:
Critical points:
Increasing on:
Decreasing on:
Inflection points:
Concave up on:
Concave down on:
In this chapter so far we have found nine types of information that help us sketch the curve
generated by a function. ese are the roots, both sorts of asymptotes, the critical points together
with the increasing and decreasing ranges, and the inflection points together with the concave
up and concave down ranges. In this section all we are going to do is pull them together into
a single type of report. In addition to a good, annotated sketch of a curve, the information in
Knowledge Box 4.9 is used to make a full report on a function.
With all the pieces in place, let’s do a full example on a fairly simple curve. is first example
will skip the issue of asymptotes by not having any.
Example 4.45 Make a full report and sketch of the curve
y D
1
3
x
3
3x:

160 4. CURVE SKETCHING
Solution:
Factor to find roots:
1
3
x
3
3x D
1
3
x.x
2
9/ D
1
3
x.x 3/.x C 3/ D 0
So we have roots at x D 0; ˙3. Since the function is a polynomial, we know it has no division
by zero and so no vertical asymptotes; similarly as x ! ˙1 the function diverges, so no
horizontal asymptotes. Now we are ready for derivative information.
A quick derivative and we see f
0
.x/ D x
2
3. So we have critical values at x D ˙
p
3 and crit-
ical points at .˙
p
3; 2
p
3/. Plugging the values x D 0; ˙2 into f
0
.x/ gives us the increas-
ing/decreasing sign chart:
.1/ C C C .
p
3/ .
p
3/ C C C .1/
is tells us the function is increasing on .1;
p
3/ [ .
p
3; 1/ and decreasing on .
p
3;
p
3/.
Another quick derivative and we see f
00
.x/ D 2x. So there is an inflection value at x D 0 and
an inflection point at (0,0). Plugging in ˙1 to the second derivative yields the sign chart:
.1/ .0/ C C C .1/
So, the function is concave down on .1; 0/ and concave up on .0; 1/.
Roots: x D 0; ˙3
Vertical asymptotes: none
Horizontal asymptotes: none
Critical points: .˙
p
3; 2
p
3/
Increasing on: .1;
p
3/ [ .
p
3; 1/
Decreasing on: .
p
3;
p
3/
Inflection points: .0; 0/
Concave up on: .1; 0/
Concave down on: .0; 1/
e following picture displays all the information. Notice how roots, critical points, and inflec-
tion points are all displayed.

4.3. THE FULL REPORT FOR CURVE SKETCHING 161
5
-5
-4 4
y D
1
3
x
3
3x
˙
Let’s move on to an example with both vertical and horizontal asymptotes.
Example 4.46 Make a full report and sketch for
y D
x
2
4
x
2
:
Solution:
To find the roots, we solve the numerator equal to zero, x
2
4 D 0. is gives us roots
x D ˙2. e denominator is zero at x D 0, giving us a vertical asymptote at x D 0. e rule
for ratios of polynomials tells us:
lim
x!1
x
2
4
x
2
D 1
So we have a horizontal asymptote at y D 1.
Computing the first derivative we get:
f
0
.x/ D
x
2
.2x/ .x
2
4/2x
.x
2
/
2
D
8x
x
4
D
8
x
3
Since the numerator is a constant, there are no critical values and hence no critical points. We
build a sign chart on the vertical asymptote, plugging in f
0
.˙1/ D ˙8, and get:
.1/ .0/ C C C .1/
is gives us decreasing on .1; 0/ and increasing on .0; 1/. Since f
0
.x/ D 8 x
3
, we can use
the power rule to get that f
00
.x/ D 24 x
4
D
24
x
4
. Again the top is a constant so there are no

162 4. CURVE SKETCHING
inflection values or points. Building a sign chart on the vertical asymptote at x D ˙1 we get:
.1/ .0/ .1/
In fact f
00
.x/ is negative everywhere it exists. is yields concave up: nowhere; concave down:
.1; 0/ [ .0; 1/. And, we are done. Filling in the chart gives us:
Roots: x D ˙2
Vertical asymptotes: x=0
Horizontal asymptotes: y=1
Critical points: none
Increasing on: .0; 1/
Decreasing on:
.
1
; 0/
Inflection points: none
Concave up on: never
Concave down on: .1; 0/ [ .0; 1/
e corresponding sketch looks like this:
3
-4
-5 5
y D
x
2
4
x
2
Example 4.47 Make a full report and sketch for
y D tan
1
.3x/:
Solution:
We already know that tan
1
.x/ is zero only at x D 0. So, solving 3x D 0 we get a root
at x D 0. We also know that =2 < tan
1
.x/ < =2. So, there are no points where a divide
by zero and hence a vertical asymptote can form.
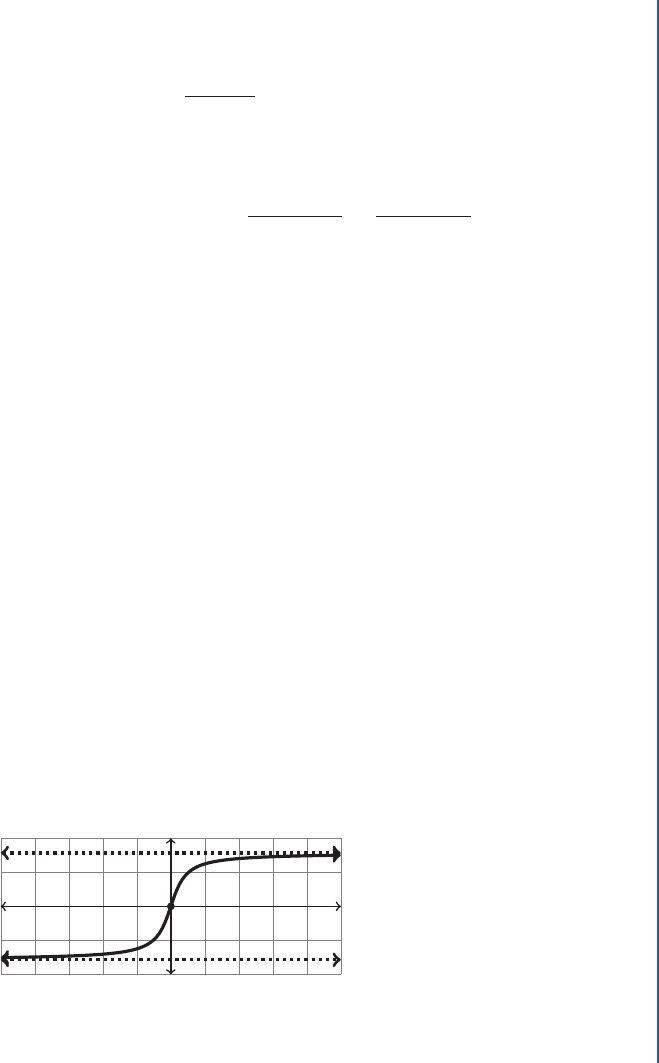
4.3. THE FULL REPORT FOR CURVE SKETCHING 163
We have that lim
x!˙1
tan.x/ D ˙1. e quantity 3x heads for 1 faster than x, but it will not
change the asymptotes of y D ˙=2.
Using the chain rule we see that f
0
.x/ D
3
1 C 9x
2
. e numerator is constant, so there are no
critical points. e first derivative is the ratio of two positive quantities, and so the function
increases everywhere.
Using the reciprocal rule we get that f
00
.x/ D 3
18x
.
1 C 9x
2
/
2
D
54x
.
1 C 9x
2
/
2
:
e numerator is zero at x D 0, and the denominator is not, yielding a single inflection
value of x D 0 and an inflection point at .0; 0/.
Building a sign chart by plugging in f
00
.˙1/ D 0:27, we get .1/ C C C .0/ .1/.
So, the function is concave up on .1; 0/ and concave down on .0; 1/. Putting all this in the
table yields:
Roots: x D 0
Vertical asymptotes: none
Horizontal asymptotes: y D ˙=2
Critical points: none
Increasing on: .1; 1/
Decreasing on: never
Inflection points: (0,0)
Concave up on:
.
1
; 0/
Concave down on: .0; 1/
e resulting graph is:
2
-2
-5 5
y D tan
1
.3x/
˙
..................Content has been hidden....................
You can't read the all page of ebook, please click here login for view all page.