
THE OBJECTIVE of this chapter is to encourage the reader to take a more proactive role in addressing fraud by using analytical techniques. This segment of the volume focuses on how critical analysis technology has become and how specific analytical techniques have proven to be highly effective. ACL is recognized as one of the top competitors in the field of fraud analytics.
The flexibility and breadth of ACL analytical software has enabled countless organizations around the world in every industry to gain immediate insight into fraudulent transactional data underlying business processes and financial reporting.1
The desktop version of ACL software provides analysts with a product they can benefit from even if they have little knowledge of the product. It allows them to develop and improve their analytical skills as they become more advanced with their use. One immediate benefit is analysts' ability to pull transactional activity by vendors and duplicates. This allows for more efficient analysis of exposures and reaction to potential fraudulent activity. What previously represented a three-to-four-week wait for information is now immediate (see Figure 4.1).
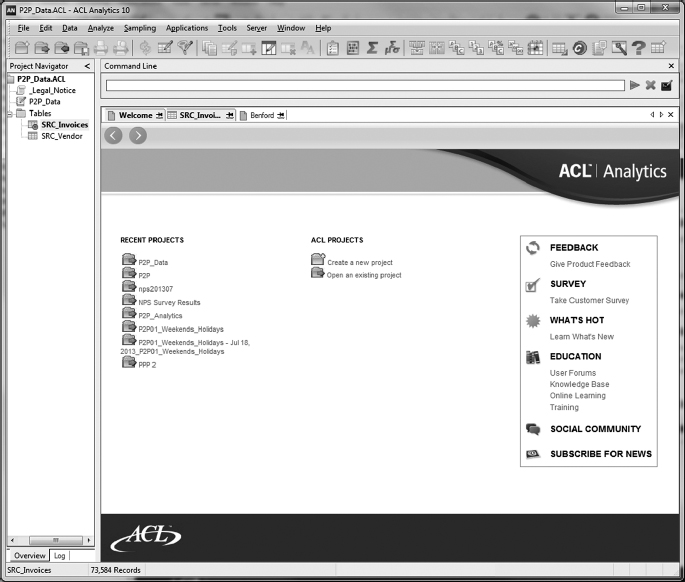
Source: ACL Services Ltd. Reprinted with permission of ACL Services Ltd.
When an act of fraud is committed through financial statement fraud, bank statement fraud, or vendor and payment-related frauds, there is invariably a record of their transactions or an indication that something averse has occurred. However, the devil is in the details. The truth is in the transactions. ACL technology can help any organization effectively monitor 100 percent of its transactions to uncover fraud. If applied on a consistent basis through detection and monitoring, detective measures can become preventive.2
Using ACL, users can access, analyze, and monitor transactions from any source that will independently verify the effectiveness of internal controls—in a fraction of the time once required. ACL Analytics assists in producing results more quickly; it allows users to read and comprehend data expediently and easily organize data extracts. It also produces greater analysis which allows the examination of complete data for every field and every record and serves as the catalyst for improving the effectiveness and accuracy of analysis.
ACL Analytics has several techniques that are useful in detecting fraud in an effective manner:
- Classification. To find patterns among data elements
- Stratification of numbers. To identify unusual entries
- Digital analysis using Benford's Law. To identify unexpected occurrences of digits in naturally occurring data sets . . .
- Duplicate testing. To identify duplicate transactions such as payments, claims, or expense report items
- Gap testing. To identify missing values in sequential data where there should be none3
ACL states that fraud detection and prevention methods should include a range of approaches—from point in time to recurring and, ultimately, continually for those areas where the risk of fraud warrants.
Based on key risk indicators, point-in-time . . . testing will help identity transactions to be investigated. If that testing reveals indicators of fraud, recurring testing or continuous analysis should be considered.4
ACL is a well-respected fraud analysis tool that has been around for quite some time. Various industries use the product for the sole purposes of detecting and monitoring the elements of fraud.
CASE STUDY: ACL INVENTORY FRAUD OF OPERATION SUPPLY AND DEMAND
The management at Dee Consulting is disenchanted with the newly employed Accounts Payable clerk. There are concerns that she is billing customers for nonexistent products. All valid products must exist in inventory and have a valid department description. Also, the A/P clerk is inadvertently forwarding invoices to customers regarding products that have been discontinued and are not in the primary stock.
An important factor to note is that there are duplicate invoices. The first two digits in the Product Number column on the AP Transaction spreadsheet correlates to the two digits in the Product Class on the Department spreadsheet.
The known products should be accounted for in the inventory and possess a department description. In using the data files, these six steps need to be completed to do a thorough investigation and analysis:
- What is the total accounts payable amount?
- Analyze what's in the inventory (quantity on hand versus quantity on order). Suggest other ways to analyze the inventory spreadsheet.
- If you have found anything suspicious (vendors, etc.), on the AP Transaction spreadsheet, what would the total amount be if you removed the suspicious transactions?
- Describe the analysis performed in its entirety and why selected.
- Identify products that may be unusual in nature and state why there may be just cause to question them.
- Describe any additional analysis that you would perform and, if so, why.
When the six steps are completed, you are challenged with preparing a link analysis association chart to visualize the red flags discovered via i2 Analyst Notebook.
Case Specifics
Based on the case study, this section provides the results via spreadsheet format that are clearly applicable for importing and exporting into ACL software. Dee Consulting discovered the newly employed Accounts Payable clerk is billing customers improperly. The clerk is suspected of billing clients for nonexistent products. In addition, clients received invoices for products that are not in primary stock. Dee Consulting has partnered with Fraud Solutions Limited to investigate the activities of the Accounts Payable clerk and determine if any of the actions are deliberately fraudulent.
Analysis
The client provided three Microsoft Excel spreadsheets for analysis:
- Inventory Listing (DAT0108_Inventory.xls)
- Accounts Payable Transactions (DAT0108_AP_Trans.xls)
- Department and Department Codes (DAT0108_Dept.xls)
Using the documentation provided by the client, the team analyzed the data looking for abnormalities. Specifically, the team conducted the following reviews:
- Day of the week
- Product code
- Department analysis
- Accounts payable analysis
- Inventory analysis
- Benford's Law analysis
After initial review of the documentation, the team noted the total amount billed according to the Accounts Payable Transactions spreadsheet was $325,821.48. In addition, the following red flags were identified:
- Duplicate invoices
- Invalid product codes
- Unavailable, backordered, or deleted product codes
- Invoices billed on weekends
- Even dollar amounts
- Quantity on hand versus quantity on order analysis
Duplicate Invoices
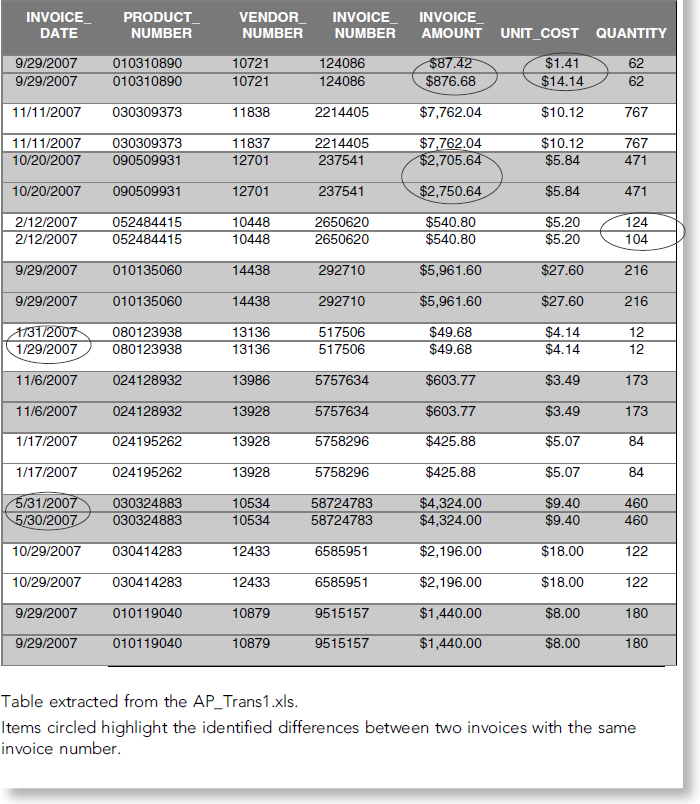
The team identified invoices with duplicate invoice numbers in the Accounts Payable Transactions spreadsheet. While no conclusive evidence can be inferred by these duplications, a thorough review is recommended, to include contacting each vendor to determine if any duplicate orders were placed. The total amount attributed to duplicate invoices is $54,4418.18. Some duplicate invoices were identical, but others varied in the invoice date, invoice amount, unit cost, and quantity.
Table 4.1 illustrates the duplicate invoices and the identified differences.
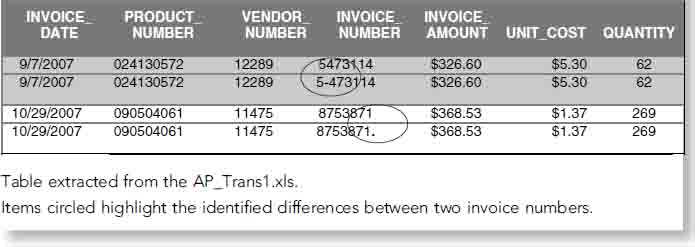
In addition, we noted there were duplicate invoices with slight modifications to the invoice number. These invoices are identified in Table 4.2.
Invalid Product Codes
During the investigation the team discovered invalid product codes listed in the Inventory spreadsheet. According to the documentation provided by the client, there are no departments associated with codes 13 or 18. However, two products were found with these department codes: product numbers 130305603 and 180122158. Table 4.3 illustrates our findings.
TABLE 4.1 Duplicate Invoices Number
Further review of the Accounts Payable spreadsheet indicated that at least one of these products was billed to a vendor in the amount of $760.77, as shown in Table 4.4.
TABLE 4.2 Duplicate Invoices with Variations to the Invoice Number
The team recommends further review of the actual invoice and Accounts Receivable documentation. In addition, the vendor listed in Table 4.4 should be contacted for additional information regarding the invoice.
Unavailable, Backordered, or Deleted Product Codes
Dee Consulting and Fraud Solutions Limited reviewed both the Inventory documentation and the Invoice documentation to determine if any products were identified as unavailable, backordered, or deleted and had an associated invoice(s).
The analysis of the Inventory documentation revealed four products were listed as unavailable. Of the four, three had associated invoices. Likewise, backordered items and deleted items also indicated associated invoices. Developed in i2 Analyst Notebook 8, Figure 4.2 illustrates the relationship of the products to invoices.
IBM i2 Analyst's Notebook delivers the richest assisted analysis and visualization capabilities in the world to support analysts and fraud examiners in quickly turning large sets of data of disparate information into high-quality and actionable intelligence to prevent crime and terrorism.
Invoices Billed on Weekends
A day of the week analysis was done as well. It was assumed that the Accounts Payable department would only process work and bill customers on workdays (Monday through Friday.) The AP_Trans.xls spreadsheet was organized by days of the week. This analysis identified that out of 116 total transactions, 39 invoices were billed on either Saturday or Sunday. These transactions need further investigation to determine if there was a legitimate reason for these billing dates. Also, there were a lot of repeated dates within the nonweekday transactions. Sorting of the spreadsheet by date revealed that specific days had a greater number of transactions. For instance, Saturday, 09/27/07, had a total of 18 transactions, much greater than the average number of transactions on any other date. Those transactions which occurred on nonworkdays were highlighted as possible suspicious transactions. The link analysis chart in Figure 4.2 shows the relationship between working days, nonworking days, and billed invoices.
TABLE 4.3 Invalid Product Codes

TABLE 4.4 Details of Invoice with Invalid Product Code

Invoice Billing by Day of Week and Product Reviewing the product codes while the spreadsheet was organized by days of the week also revealed patterns. Nineteen transactions, nearly half of the total 39 transactions, had product numbers that started with 01*. We wondered if this was a normal pattern, and compared it to the percentage of transactions occurring on workdays from Department 01. We found no transactions from this department that occurred on a workday. The link analysis chart in Figure 4.2 illustrates the relationship among workdays, invoice, and departments.
Invoice Billing by Day of Week and Department Dee Consulting and Fraud Solutions Limited decided to look closer at Department 01, Housewares. The Inventory spreadsheet listed products such as cake pans, dish drainers, and other housewares. Comparing these products with other products in the inventory showed anomalies. The majority of other products appeared to be products from a hardware store. The team found these product descriptions unusual and not aligned with the rest of the inventory. Further investigation is recommended to determine whether these products, or even this department, exist at all (see Figure 4.3).
Benford's Law Analysis We also conducted a Benford's Law analysis using ACL Analytics. According to David Coderre, “Benford's Law concludes that the first digit of each transaction in a large number of transactions will be a ‘1’ more often than a ‘2,’ and a ‘2’ more often than a ‘3.’” See Figure 4.4.
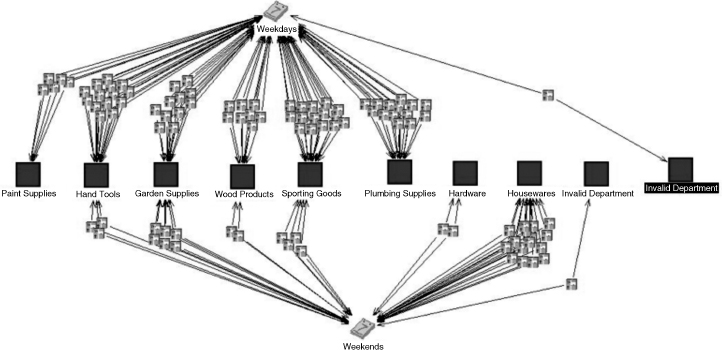
FIGURE 4.2 Link Association Chart by Day of Week and Department via i2 Analyst's Notebook 8
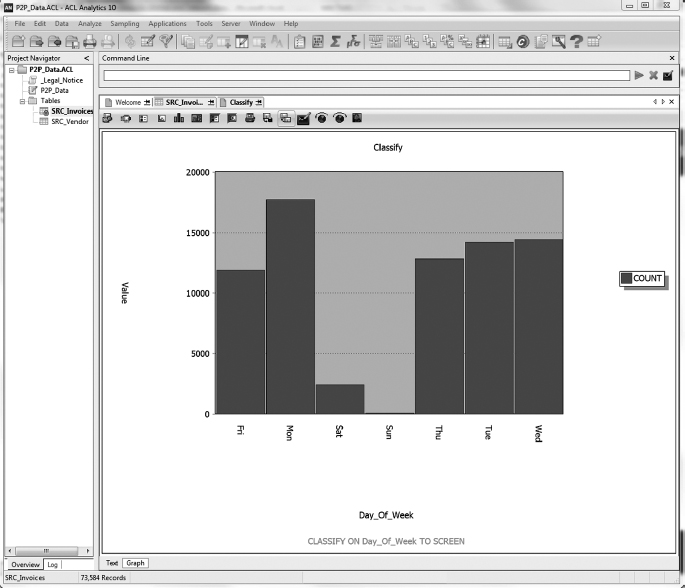
FIGURE 4.3 Day of Week Analysis with ACL.
Source: ACL Services Ltd. Reprinted with permission from ACL Services Ltd.
In other words, a random set of data follows a predictable pattern that is extremely hard for a human to emulate, or fake. Using Benford's Law, Dee Consulting and Fraud Solutions Limited examined the data to try to pinpoint whether transactions on the AP_Trans.xls spreadsheet were made up. We did this analysis on the first digit of the transaction amount and found the results shown in Table 4.5.
There were some irregularities in the data. Statistically, the number 1 should occur as the first digit in the transaction amount far more often than the 30 times that it did. Similarly, the number 3 should have occurred more often. Conversely, the numbers 4 and 5 occurred far too many times, especially the number 5. It may be that the Accounts Payable clerk, in trying to fake transaction amounts, selected transaction amounts which began with these numbers, believing they would appear more random. Not understanding Benford's Law, however, she did not know that it is almost impossible statistically to fake numbers in a data set (see Figure 4.5).
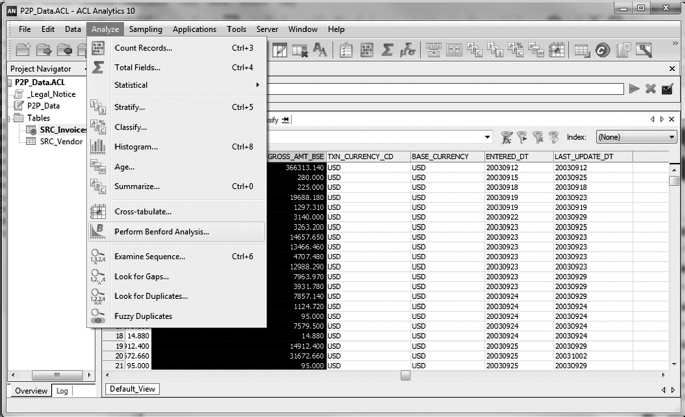
FIGURE 4.4 Powerful Data Analytic Commands to Perform Benford, Duplicates, Statistical Analysis, and More
Source: ACL Services Ltd. Reprinted with permission of ACL Services Ltd.
TABLE 4.5 Benford's Law Analysis of Invoices
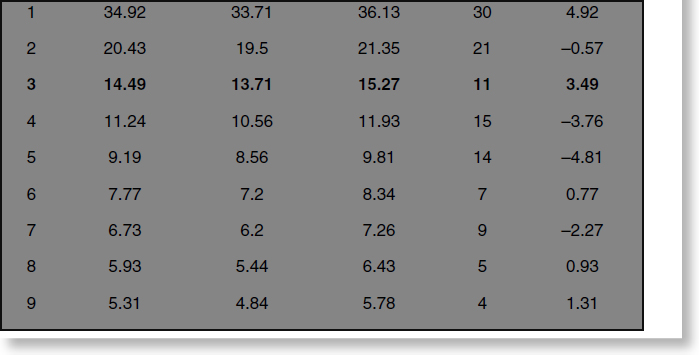
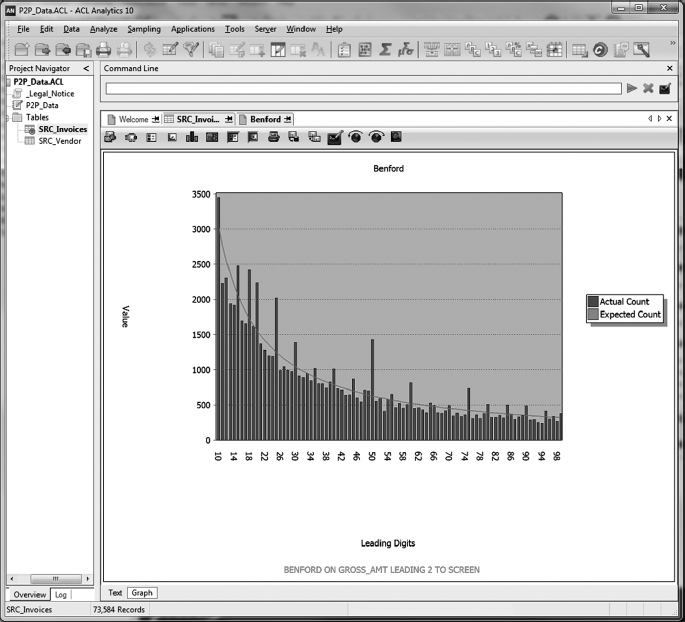
FIGURE 4.5 Benford Analysis Visualization
Source: ACL Services Ltd. Reprinted with permission of ACL Services Ltd.
Even Dollar Amounts
There were a total of 13 invoices that had even dollar amounts. Within this group, two of the invoices were part of the duplicate invoice set discussed previously.
In addition, five of these invoices were billed on nonworking days. On 10/29/07, three invoices were created for the same vendor (124233). The total invoice amount for this extracted data is $14,794.00. While not conclusive of fraud, even-amount invoicing could indicate someone was attempting to make a payment to themselves or someone else. An additional review of these invoices was recommended to determine if they were accurate. Table 4.6 highlights these anomalies.

Quantity on Hand versus Quantity on Order Analysis
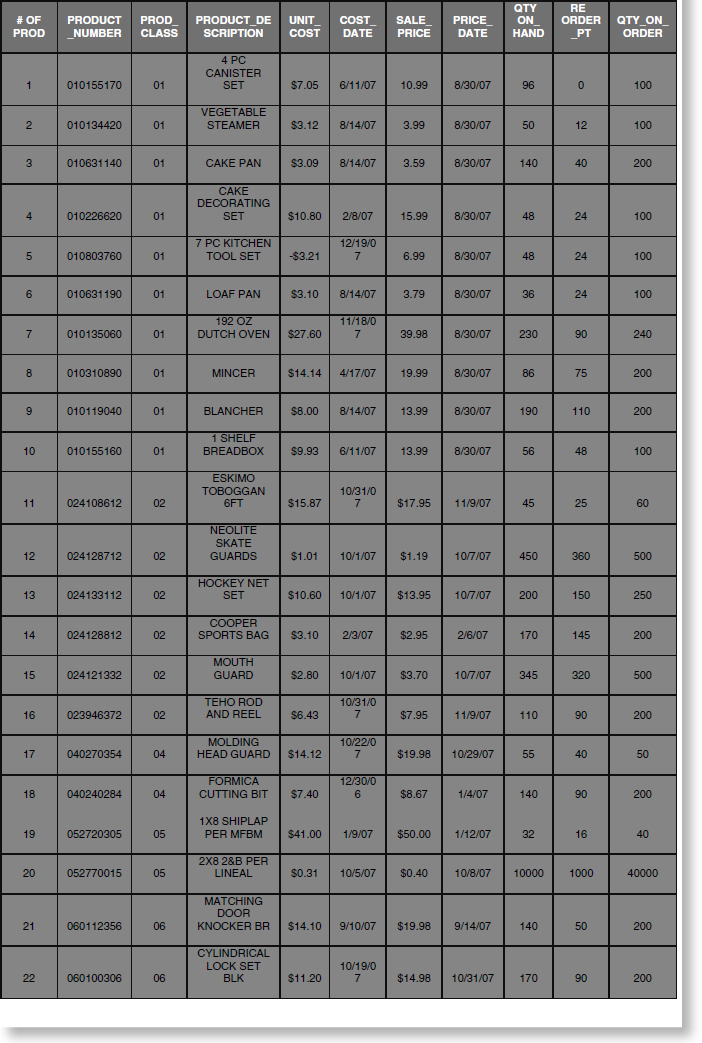
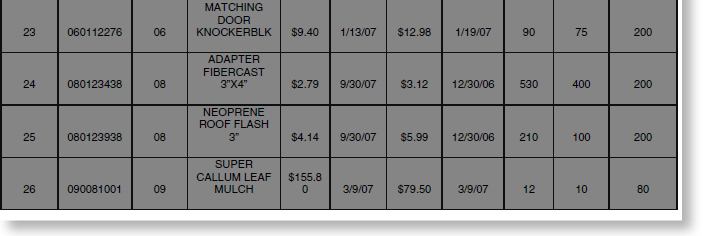
Dee Consulting and Fraud Solutions Limited conducted analysis on the inventory looking at the quantity on hand versus the quantity on order. The team first sorted the data by products with quantities on hand that were higher than the reorder point and had quantities on order. The team was looking for products that had a high reorder point relative to the quantity on hand and the reorder point. There were 26 products that met these criteria, as shown in Table 4.7.
During this analysis the team noted there were a high number of products from Department 01, Housewares. (Department 01 was discussed previously in the “Invoices Billed on Weekends” section.) In fact, 42 percent were from this department. Also, it was noted that the price date for items from Department 01 were all on the same day, 08/30/07. The total value at cost for these products is $32,036.69 with a sale price of $42,571.45.
TABLE 4.7 Quantity On Hand versus Quantity On Order
Next, the consulting firm compared the products ordered with the invoice spreadsheet. First, the team queried the data to determine how many products ordered before the preorder amount had been invoiced. Once this information was determined, the team looked at the following:
- Items invoiced on a nonworking day
- Items invoiced from Department 01
- Items that were also part of the duplicate invoice analysis
The results of this analysis yielded several areas for concern which require further investigation. The results of the fraud analysis were:
- 21 invoices were identified that contained products which were ordered before their reorder amount; this was 81 percent of the total products identified in this analysis.
- 9 of the 21 invoices (43 percent) were from Department 01.
- 17 of the 21 invoices (71 percent) were billed on a nonworking day.
- 5 of the 21 invoices (24 percent) were also identified on the duplicate invoice list.
- $24,313.99 was the total amount billed from these items.
- $22,154.06 of the total amount billed (91 percent) was the amount billed on a nonworking day.
- $17,443.86 of the total amount billed (71 percent) was the total amount billed from Department 01 (see Figure 4.6).
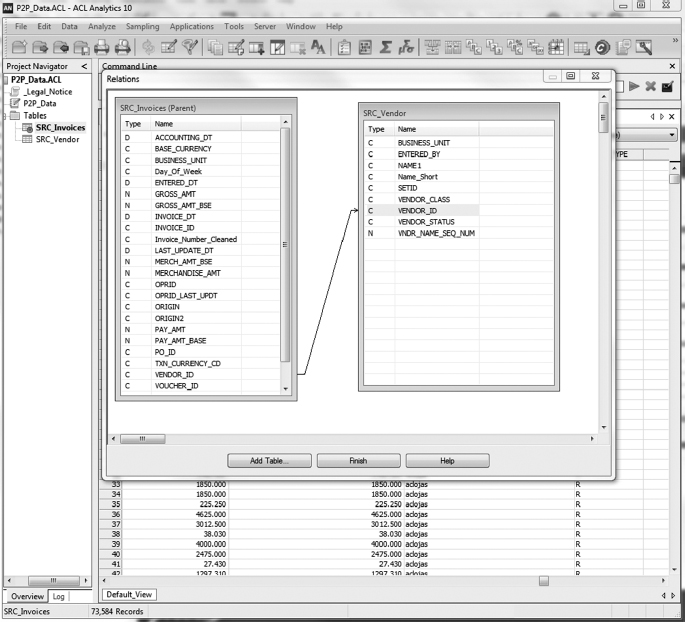
FIGURE 4.6 Visually Related Data from Multiple Tables
Source: ACL Services Ltd. Reprinted with permission of ACL Services Ltd.
Further Analysis
Further analysis was necessary to determine if the Accounts Payable clerk was committing actual fraud. This analysis included:
- Examined copies of the actual invoices and the Accounts Receivable spreadsheet. The Accounts Payable Transaction spreadsheet indicated clients were billed for the unit price instead of the sale prices.
- Examined copies of the actual invoices to verify the amounts billed and amounts received, looking for any differences. In addition, the examiners requested an explanation for why the sale price was not used.
- Obtained balance sheets from prior years from management. This information was used to do a trend analysis of profits and losses in order to calculate any unusual highs or lows. Compared to the inventory and/or transactions to identify further possible fraudulent transactions. Random sampling was done on prior-year transactions in order to determine whether these transactions fit the pattern of the transactions currently being analyzed.
- Reviewed products that were below the reorder point. Some products were below the reorder point and there wasn't any product on order. This warranted some review to analyze other outliers of why some products weren't being monitored closely enough to reorder on a timely basis. This could mean fraud was being perpetuated within the inventory itself, causing certain items to not be ordered on purpose to skew inventory levels.
- Reviewed previous billing cycles and/or previous fiscal years to determine if there were any other duplicate invoices. This was used to determine if any specific vendor did have multiples of the same type of order or if there was more fraud perpetrated previously.
- Developed a way to have the inventory tracked and reordered more consistently, perhaps integrating a computerized system where items are automatically reordered as their quantities reach the reorder level. This should take the guesswork and error out of an individual keeping track of reordering and could help decrease the differences of products being reordered on a random basis and prevent someone committing fraud with the inventory.
In conclusion, it is imperative that all necessary data is reviewed beforehand. Doing this serves as the gateway to making certain that all documents are concise, information is understood, and the data is presented in its simplest form for greater results.
 THE DEVIL REMAINS IN THE DETAILS
The Association of Certified Fraud Examiners (ACFE) found that one-quarter of fraudulent transactions involved losses of at least $1 million, while the fraudulent activities lasted a median of 18 months before initial discovery. When fraud analytics of suspected targets is established, fraud analytics technology can be used to extract and analyze data—complex or clean—for a variety of anomalies.
When anomalies are uncovered, several analytic tests should be conducted. An example would be when comparing employee data fields (including names, addresses, phone number, bank accounts, and Federal Employer Identification Numbers) that have a commonality, the most sophisticated techniques should be used.
Fraud analytics should target transaction dates to ensure that items are in the proper time frame and that results are posted in a timely manner. Fraud analytics offers insight and possibility that would have been too dramatic to achieve by any means of manual processes. The ACFE 2010 Report to the Nation revealed that financial statement fraud is the most costly form of occupational fraud for organizations worldwide, causing a median loss of more than $4 million in the United States alone.5 Additionally, recently other frauds (e.g., money laundering, credit card fraud, Ponzi schemes, etc.) also have contributed to the enormous increase in fraud.
Fraud analytics and its unique capabilities can quickly identify unusual patterns, trends, and so on. When viewing potential fraudulent transactions, you need to understand and accept the fact that weaknesses can be exploited and uncovered with the proper tools. ACL Analytics is the perfect tool of choice.
Looking at 100 percent of the financial statement transactions and comparing data and numbers from different applications will allow analysts to interpret matches that really should not be there or look for duplicate transactions that indicate either fraudulent activities or deficiencies. This can be achieved only by using the most innovative fraud analytic techniques and to find those frauds performed with fraudulent intent. Keep in mind that fraudulent transactions, by nature, do not occur randomly.
Fraud analytics allows analysts to investigate financial transactions and see if there is anything to indicate fraud or opportunities for fraud to be perpetrated. Fraud is inevitable. ACL clearly reminds us that we are looking for those things that do not appear to be normal.6
ACL technology provides the following three critical techniques in its application of analytics:
- Examine classification of data, group your data into specific groups based on something as simple as location or numbers, and view all the transactions. Maybe a number of transactions are occurring outside of the normal parameters. Consider where are they from and how are they distributed across an entire population of sorts.
- Look at high and low values and find anomalies there. Quite often these anomalies are indicators of fraud.
- Calculate statistics and look for outliers or values that exceed the normal averages or appear to be outside standard deviations.7
Ad Hoc: Is It Really Needed?
Ad hoc allows exploration. Ad hoc means that you can should seek out answers to a specific hypothesis. You can investigate financial transactions and see if there's anything to indicate fraud or opportunities for fraud to be perpetrated. What if you have a hypothesis? Maybe an employee financial statement matches a financial statement from a different time frame. You can go and seek the information—compare the master file of the previous period against the employee file and look for matched records. If you uncover something, great! It could indicate someone setting themselves up for a phantom transaction and perpetrating the fraud. You can seek opportunities for fraudulent activities to occur. If this sort of anomaly appears to be relatively prevalent or there is certain exposure to risk that you are not comfortable with, then maybe you want to investigate all possibilities on a recurring basis.
Fraud Detection in Financial Crimes and Banking
Fraud detection in financial crimes and banking is a critical activity. It can investigate a series of fraud schemes and fraudulent activity from criminal enterprises, bank employees, and fraudsters. Since banking and financial crimes are highly relatable industries, the financial industry and those in financial crimes organizations must and should adhere to a number of compliance and ethical requirements in order to fight fraudulent and criminal activity.
Noted next are a few fraud schemes that are encountered in financial crimes investigations and banking. These are also some of the ways that fraud analytics can be applicable to detect and prevent them.
Check Tampering
- Identify missing, duplicate, or voided check numbers.
- Identify checks paid that do not match checks issued by bank, by check, or by deposit ticket items.
- Locate check forgery or falsification of loan applications (homes, cars, etc.).
Corruption
- Produce a list of transactions with organizations on the list of noncooperative countries and territories.
- Ensure Financial Action Task Force on Money Laundering (FATF) compliance.
- Find customers who appear on the Office of Foreign Assets Control (OFAC) of the U.S. Department of the Treasury list.
Cash Transactions
- Identify a series of cash disbursements by customer numbers that exceed the regulatory thresholds.
- Identify cash transactions just below regulatory thresholds.
- Identify unusual numbers of cash transfers (wire) by customers or by bank accounts.
Financial Statement Fraud
- Identify suspicious journal entries.
- Monitor dormant and general ledger accounts.
Financial Skimming
- Find indicators of check kiting.
- Highlight duplication of credit card transactions and skimming.
- Highlight very-short-time deposits and withdrawals on the same account.
Fraud analysis can be used to proactively seek out potential indicators of fraud in financial data. This helps keep the focus of fraud investigations on those areas that display indicators of fraud in the data analyzed. Fraud examiners, analysts, auditors, and investigators must exercise their intuition to analyze the data. Fraud analysis also allows users to track down the root cause of fraud and prevent fraud from occurring in the future.
However, keep in mind that fraud analysis cannot identify all fraud schemes. Most of the time when there is a high-volume of corruption or nonelectronic paper trails of financial transactions, more manual fraud detection processes are appropriate. Herein lies the value of Excel spreadsheets. Where fraud experts can leverage technology to pose indicators of fraud in electronic data, automate detective monitoring, and schedule tests of specific data to run on a frequent basis, using the fraud analytic techniques will expand some much-needed time for other analysis, investigations, and fraud risk assessments.
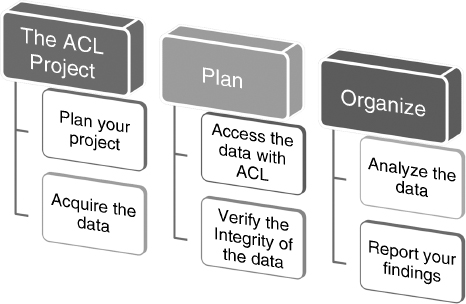
FIGURE 4.7 Six-Step Plan to Assist ACL Users in Starting the Analytics Process
Source: ACL Services Ltd. Reprinted with permission from ACL Services Ltd.
ACL: The Six-Step Plan
Some would argue that the most important part of starting the analytical plan is to know your data before you start. The time that you spend in reviewing your data can set milestones and identify major objectives that can save you valuable time.
As shown in Figure 4.7, the next six steps teach you how to choose the appropriate ACL command that will best support your objectives. This plan is the most effective way to get answers from your data.
- Planning the project begins with identifying the objective and determining the necessary steps to achieve the objectives.
- Acquiring the data requires gaining physical access by identifying the location and the format of the source data that you require.
- Accessing the data with ACL Analytics will allow you to add the data to your project as tables or charts, which will define how the ACL technology reads.
- Verifying the integrity of the data is critical. It ensures that the data does not contain corrupt elements and that the tables and charts are constructed by their uniqueness, relational data, and reliability.
- Analyzing the data assists in the manner of interrogating and manipulating the data to identify exceptions.
- Reporting your findings is a much-needed component in preparing the results for oral and/or visual presentation.
ACL Analytics lets you analyze data in almost any known format from various platforms and decipher meaning from a plethora of data—be it raw, clean, or financial statement data. The sooner that red flags of fraud are detected, the greater the chance that losses can be recovered and control weaknesses can be addressed. As a 2002 ACL executive brief states, “The timely detection of fraud directly impacts the bottom line, reducing losses for an organization. And effective detection techniques serve as a deterrent to potential fraudsters.”8
NOTES
1. ACL company data, “Industry.” www.acl.com/solutions/industry/
2. Peter Millar, “The Best of Crimes, the Worst of Crimes: Fraud Stories that Prove the Truth is in the Transactions,” 21st Annual ACFE Global Fraud Conference, June 2010.
3. IIA, “Global Technology Audit Guide: Fraud Prevention and Detection in an Automated World,” 2009; cited in ACL Services Inc., “Fraud Detection Using Data Analytics in Government Organizations,” discussion paper, 2010.
4. Peter Millar, “Detecting and Preventing Fraud with Data Analytics,” ACL Services Ltd., 2009.
5. Association of Certified Fraud Examiners, Report to the Nations on Occupational Fraud and Abuse (Austin, TX: Author, 2010).
6. Millar, “Detecting and Preventing Fraud with Data Analytics.”
7. David Coderre, Fraud Analysis Techniques Using ACL (Hoboken, NJ: John Wiley & Sons, 2009).
8. ACL Services, “Fraud Detection,” executive brief, 2002.