
WHAT IS the recipe for using visual displays to find fraudulent activity? Analysis of data is not enough when the amount of data and the various sources and formats of data are overwhelming. The ability to integrate the data sources and allow the data to be shown by a visual format gives the fraud examiner a leg up in the fight against fraud.
Centrifuge is a leading provider of visual analytics. Its Centrifuge Visual Network Analytics (VNA) is one of the most enhanced analytical tools for integrating data in a cohesive manner and provides vibrant association maps and interactive visualizations. VNA allows the fraud examiner or fraud analyst to quickly discover patterns in the data to detect anomalies and red flags. In addition, it displays the connections between businesses, customers, and transactions in a mapping format.
The Centrifuge VNA platform can integrate data from sources formatted in Word, Excel, Access, PDFs, and can combine data with information from social networks, and cloud-based data to uncover relationships and patterns in a visual display (see Figure 7.1).
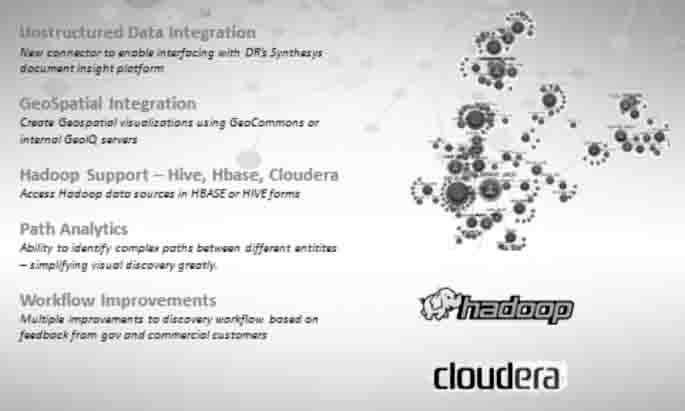
FIGURE 7.1 Centrifuge VNA Associations/Relationships
Source: Centrifuge Systems. Reprinted with permission of Centrifuge Systems.
 SOPHISTICATED LINK ANALYSIS
The solution to most complex data problems lies in understanding the relationship among entities such as people, events, systems, facts, and so on. Centrifuge uses cutting-edge link analysis algorithms to quantify these relationships and visualize them in the form of interactive relationship graphs. High-performance, server-side rendering allows seamless panning and zooming from dense maps of millions of nodes down to individual relationships.
Fraud continues to be one of the most pervasive threats to the success of retailers around the world. But while the problem is well known throughout the industry, fraud detection is no easy task. With such a wide variety of tactics employed by fraudsters, retailers have found it difficult to identify potential vulnerabilities before it's too late.
However, the rise of innovative analytical solutions such as data visualization has enabled fraud examiners to discover and predict key patterns to stay one step ahead of the opposition.
Let's examine how Centrifuge VNA can help fraud examiners and analysts in two common fraudulent scenarios: one that affects manufacturers and retailers and another that affects bankers.
THE CHALLENGE WITH ANTI-COUNTERFEITING
The counterfeit goods trade has grown exponentially with the use of the internet. The top counterfeit best sellers are shoes, followed closely by handbags. Even more frightening is the proliferation of counterfeit drugs available from numerous internet websites proclaiming to be legitimate pharmaceutical businesses. The internet has allowed counterfeiters from countries around the world to sell their knock-offs for huge profits, to the detriment of legitimate businesses. The damage that these perpetrators do to manufacturers' brands and revenues cannot be overstated.
Centrifuge VNA can be an effective way of protecting a company from these fraudsters by allowing the fraud examiner to view integrated data from multiple sources on the internet to include blogs, websites, fraud alerts and news media. Since all of this is done in real time, this program provides graphic depictions that save critical time to defend against these fraudulent attacks.
INTERACTIVE ANALYTICS: THE CENTRIFUGE WAY
Centrifuge has pioneered interactive analysis running inside a browser. Now analysts can uncover hidden insights in their data without having to install any software.
How does it work? Users can easily connect to the data, explore it interactively with rich visualizations, and collaborate with others through shared insights. This approach extends beyond other analytic tools to include:
- Advanced link analysis to visualize important relationships
- The ability to link up data on demand and expand the analysis
- Powerful Centrifuge functions to explore the data
- Collaborative analysis
Two very important forces are impacting the way organizations analyze data today:
- An explosion of incoming data pouring in from multiple sources
- Shrinking windows of time to understand and act on the resulting information
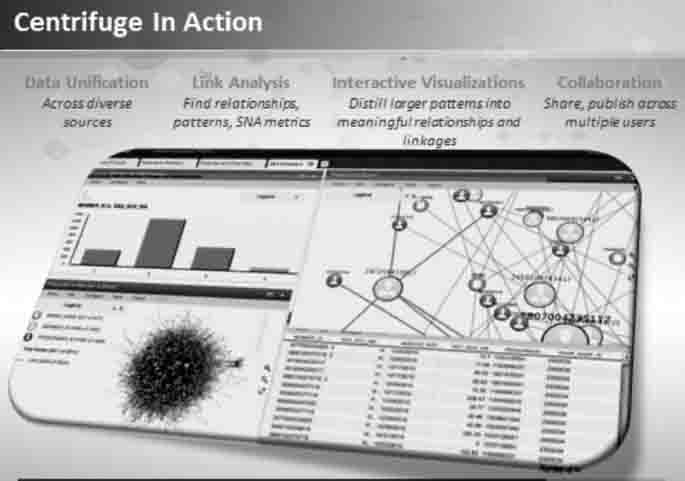
FIGURE 7.2 Centrifuge's Interactive Analytics Approach
Source: Centrifuge Systems. Reprinted with permission of Centrifuge Systems.
Other tools require you to know what you are looking for in advance. They are designed to report on prebuilt metrics that constrain users' ability to differentiate noise from meaning.
Still other tools require the time-consuming construction of complex extract, transform, and load (ETL) processes and data warehouses.1
Today's leaders must make fast decisions. These decisions must consider the volume of relevant data pouring into the business. This can be accomplished only through effective collaboration across departments, management levels, and geographic boundaries, as shown in Figure 7.2.
Interactive Visualization
- Visualize your data in rich pictures.
- Pose questions through direct interaction with pictures.
Unified Data Views
- Analyze multiple data sources in multiple views.
- Shift your lens to gain insight across a 360-degree view.
- Force multiply through the collective intellect of a group on the same problem space.
- Share insight in real time to improve decision making.
The Challenge with Bank Fraud
Fraud is commonplace. Bank fraud is common and the fraudsters change their schemes often. Thieves frequently morph their fraud strategies to throw investigators off their scent while more elaborate schemes are put in place.
As Internet usage has exploded, consumers have become comfortable with e-commerce transactions and people have flocked to social networking sites, which have become a fertile breeding ground for fraud, identity theft, money laundering, and cybercrime. Fraudsters like to remain anonymous, and what better way to do that than through the World Wide Web? . . .
Figure 7.3 depicts fraudulent banking transactions and illustrates how Centrifuge VNA clearly displays which customers are associated with each transaction based on account information from several unknown branch financial institutions.
FRAUD ANALYSIS WITH CENTRIFUGE VNA
The three crucial phases of fraud analysis are discussed next. Results from these phases are often integrated with case management technology: rules-based systems to refine alerts and predictive analytics technology.
Centrifuge VNA organizes fraud analysis into these phases:
- Phase 1. Data Preparation and Connectivity
- Phase 2. Initial Data Analysis
- Phase 3. Advanced Link Analysis and Identity Visualization
Phase 1: Data Preparation and Connectivity
Data preparation and data connection are essential first steps in fraud analysis. When done properly, they provide a foundation for your analysis. This phase provides a basic understating of the data and allows the analyst to unify disparate sources of data. Fundamentally, these two processes streamline the analysis stages that follow. The primary components of this phase include:
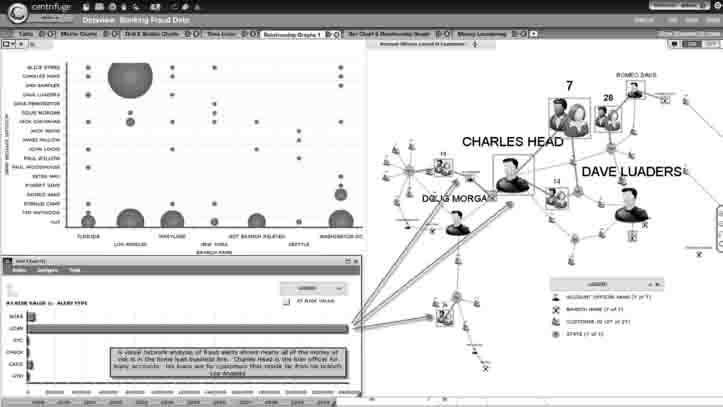
Source: Centrifuge Systems. Reprinted with permission of Centrifuge Systems.
CASE STUDY: FRAUDULENT BANKING TRANSACTIONS
A few customers are linked to many alerts. High appraisal alerts represent the most risk to the bank. The suspicious customers are linked to specific branches in Florida, California, and Washington, D.C. Certain account officers have unusually high alert volumes for their customers. There may be collusion between the customers and account officers with kickbacks taking place.
Questions to Ponder
- Do customers with historical alerts show a pattern of behavior over time?
- Are the alerts clustered around certain days of the weeks or times of day?
- Are the account officers in any way related to the customers?
- Are mortgages being issued in close proximity to the bank?
- Are high-risk customers tied to watch lists?
- Why are there so many high appraisal alerts not assigned to an account officer?
- Do other financial transactions and accounts show suspicious behavior?
- Do customers have any unusual identity or personal property data attributes?
- Are suspicious customers linked in any way?
- How much money is at risk for the high-risk targets?
More and more data is becoming available for analysis every day. The need to easily connect to these sources and unify them is essential if the fraud examiner or fraud investigator is going to successfully connect the dots between pieces of data in different sources. The above case study illustrates the use of four data sources (see Figure 7.3).
- Fraud alerts across different business lines in a bank
- Financial data on banking transactions and account holders
- National identity management databases
- Independent “watch lists”
- Connect to data sources and integrate essential data for analysis
- Inventory data sources and determine what you have to work with
- Identify gaps and anomalies in the data
- Pre-process the data to select segments required in the analysis
- Transform the data by creating new data fields and modifying field types
- Define “Dataviews” for later use in data profiling and advanced data visualization
Joining Data
With so many data sources available for analysis, the process of integrating the data allows analysts to thoroughly and accurately investigate cases. Joining different data sources involves indicating where the data resides followed by linking disparate sources based on a common key (a unique key present in one or more sources of data).
The example in Figure 7.3 shows the first two sources of data (Weekly Fraud Alerts and Financial and Customer Demographic data). These two data sources are in different formats (Excel and Microsoft Access) yet they can be joined on a common key (Customer ID). Notice that each of the two sources of data contains different data fields. The Fraud Alerts (listed as Accounts Query) has alert ID, alert name, at-risk value, and more. The Financial and Demographic data has contact information, branch, and account officer data. The fraud analyst has chosen to include all of the data in both sources (indicated by check marks next to the field names) but could have decided to exclude data fields irrelevant in the investigation. Excluding data could make it easier for the analyst to navigate through the analysis phases and also speed up performance if any of the tables are extremely wide. . . .
Typically, most organizations will have more than two sources of data. By integrating multiple sources of data, the fraud analyst increases her chances of identifying unusual behavior across the sources. In Figure 7.3, many sources are connected. In the center of the figure, the analyst has joined 16 different sources with data on property, SSNs [Social Security numbers], vehicles, aliases, and much more. . . . Inventory the Data
Analyzing the imported data in a table format and then running frequency distributions on each field to show the number of values for every data element is an excellent way to inventory the data prior to analysis. It may also reveal important insights or anomalies about the data by pointing the analyst in a specific direction. . . .
Phase 2: Initial Data Analysis
In Phase 2, the analyst is focused on data profiling in support of understanding the data and developing a series of questions requiring investigation. During this phase, the fraud analyst can identify correlations between data fields as well as look for anomalies in the data, null values, suspicious behavior, and basic patterns of behavior. Based on this process, the analyst formulates a hypothesis for the investigation. Results from this phase include:
- A set of charts, tables, and other forms of visualizations
- A set of questions leading the analyst down a path of investigation
- Identification of data that appears to be suspicious requiring more advanced analysis
- A hypothesis for the investigation . . .
Phase 3: Advanced Link Analysis and Identity Visualization
Charts, tables, and heat maps tell part of the story. They are typically used to show summary and aggregate-level views of data. Analysts use them to profile data fields, show how the data is organized, investigate if two or more fields of data could be correlated, and isolate anomalies in the data. Oftentimes, these forms of visualization communicate the magnitude of the problem. Shifting from one form of visualization to another allows the analyst to reveal new insights.
But charts, heat maps, and tabular data don't show relationships between the people, transactions, and locations. They don't show networks of activity or connections between individual pieces of data.
In addition to identifying meaningful relationships hidden in the data, the fraud analyst is typically also concerned about the timing, strength, and direction of the relationship. Is there someone representing the leader or “head” of the relationship? Are there people who exist “near” the potential fraudster or “in between” two individuals clearly involved in fraud? Do the identities of these people indicate anything suspicious? Are there people linked through employers? How strong are the relationships between people, accounts, or loan officers? These types of questions are better suited to a form of data visualization commonly called link analysis but also known as relationship graphs or link-node diagrams.
Revealing hidden meaning in data requires analysts to maintain their train of thought. Jumping from one data source to another breaks that train of thought. Moving from one analytical tool to another further complicates this problem. Checking identities outside of the analytical environment used to identify the fraud creates delays and inaccuracies. As a result, this phase also includes identity visualization.
The advanced analysis summarized in this phase allows the analyst to do the following:
- Build relationship graphs to identity hidden insight
- Analyze relationship graphs using advanced functions
- Integrate watch list analysis
- Validate identities using commercially available identity data
What Are Relationship Graphs?
Relationship graphs are a way of showing visual representations of data through links between data objects. They are comprised of nodes and links. The nodes of the graph are usually real-world items, such as people, places, telephones, vehicles, and so on. The links are lines connecting these nodes to show that a relationship exists between the nodes.
The characteristics of the links are important since they can show the strength and direction of the related nodes. These diagrams can get complicated with large volumes of data and many different types of nodes. For example, a relationship graph showing linkages between people and properties is less complex than one showing people linked to properties, airline flights, and employers. As a result, oftentimes analysts use other forms of visualizations, “filters,” and search capabilities to identify a set of data they want to draw in the graph. In other words, using charts to initially identify fraud alerts for high-risk customers and then selecting these records for use in the relationship graph is a common practice in data visualization. . . .
Advanced fraud analysis using data visualization technology includes a wide range of techniques that are useful in proving the hypothesis in question. As the analyst interacts with all of the visualizations, a limitless number of pictures, questions, and techniques can be applied to explore the data.2
THE FRAUD MANAGEMENT PROCESS
Let's look at the essential steps in the fraud management process to better understand where the process breaks down.
As shown in Figure 7.4, fraud management is typically divided into four steps:
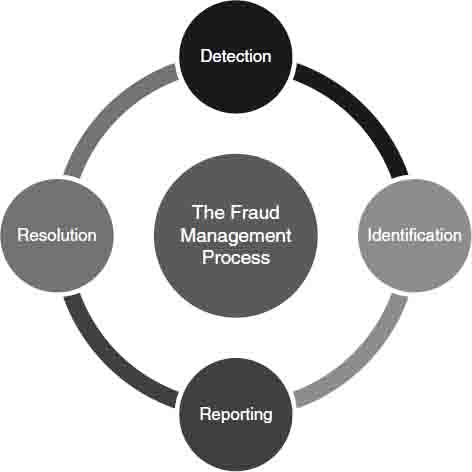
FIGURE 7.4 Fraud Management Process Cycle
- Detection generates alerts which then require investigation.
- Identification involves investigators/fraud examiners confirming suspicious activity.
- Reporting requires suspicious activity reports to be filed with regulatory agencies.
- Resolution includes the involvement of agencies and other organizations to resolve the case.
A Centrifuge corporate white paper from 2010 details how this process works with VNA:
In a perfect world, the process would unfold as follows: The detection process includes all relevant transaction monitoring systems so that alerts from each line of business may be analyzed together. Automated rules are applied to detect suspicious activity. When conditions match these preexisting rules, alerts are sent to notify fraud investigators that something suspicious is taking place. The investigators are then charged with investigating these cases that have been flagged. This is the key step. The investigator leverages all available data, and her own domain knowledge and expertise, to determine if this case does in fact represent fraudulent activity. If so, a report is filed. The criminal activity is then pursued in conjunction with federal and local authorities and resolved as quickly as possible. Ideally, accurate identification by the investigator is fully documented and meets regulatory requirements. Unfortunately, this perfect world doesn't exist.
One could argue that the most critical step in this process is Step 2, Identification. Better stated, the most critical step is accurate identification by the fraud examiner, analyst, or investigator. By improving this step, all of the other steps can be positively impacted. Let's analyze this in more detail. If the investigator can accurately identify fraud from thousands of alerts, she can provide a feedback loop into the alerting process to improve detection over time. As the investigator learns more, the rules get better and the job becomes more focused by virtue of the fact that accurate detection is in place. Similarly, accurate identification leads to accurate reporting which leads to more effective utilization of resources in the last step, issue resolution. All of this translates to less risk for the business on many levels. There is a lower risk of noncompliance, lower risk of fines, less risk of negative publicity, and more positive awareness that the business is managing risk in a manner consistent with consumer and organizational expectations.3
Investigative Analysis Using Data Visualization
[T]he identification phase is arguably the most important phase of the fraud management process. This phase encompasses real investigative analysis [IA] and has the potential to positively impact the other phases. It is also the weakest component of most existing analytical solutions. Let's summarize three emerging technologies that can significantly improve the investigative analysis effort.
1. Interactive data visualization
2. Unified data views
3. Collaborative analysis
1. Interactive Data Visualization
Data visualization is getting a lot of attention today. This is the use of visual metaphors to enhance our ability to detect patterns in data. Interactive Visualization takes this further and allows us to interact with the visualizations directly to ask follow-up questions and pursue a line of inquiry. This has proven to be very effective at allowing investigators to navigate through, explore, and understand massive amounts of data. We find that when we see something relevant, we almost instantly draw inferences and allow the investigator to work at the speed of the human brain. This is very different from the static charts that most tools provide today. When used effectively, the resulting insights can be remarkable.
2. Unified Data Views
Accurate identification depends on having access to all relevant data pertaining to the investigation. Since important facts exist in disparate systems, the ability to access these data sources without extensive integration and programming efforts is critical.
Internal data used in the investigation represents one important class of information. Increasingly, third-party data, news wires, blog posts, network traffic, historical information, and many other sources are equally important. Providing the investigator with the ability to easily reach out to these sources from within the investigative framework is extremely powerful. The absence of this capability often yields an incomplete investigation.
A common complaint is that the investigator needs to use multiple tools to get a comprehensive view of the case. This can be tedious and highly disruptive to a particular line of reasoning. The ability to create unified views of the disparate data is a powerful paradigm for visual analysis. Unified views allow us to “shift our lens.” For example, we could move from a quantitative to a relational to a temporal view of the same data expediently. This allows investigators to validate findings and eliminate false positives very quickly.
3. Collaborative Analysis
Business professionals have leveraged the power of collaboration technology to increase productivity and foster the exchange of ideas for quite some time. This needs to be applied to fraud and ALM [anti-money laundering] investigations. Since investigators are assigned cases, and many of these cases are interrelated, it stands to reason that if investigators can collaborate, notify each other of important findings, and publish results for review, they can solve cases faster while also improving the accuracy of the identification process. The ability to document the results of the investigation for audit purposes is also very important, especially in the area of compliance and regulation. Knowing exactly what steps the investigator took in the analysis process to arrive at a conclusion is useful for audit purposes, training, and notifying other investigators who may have similar types of cases to solve.
Automatically notifying others in the organization that results are available for review can dramatically speed up investigations, leading to shorter windows for criminal activity to occur. For this reason, saving the results of the analysis to document key findings in the investigation is very important. These analytic assets need to be protected, archived, retrieved when needed, and used to meet compliance requirements.
Investigative Analytics
These three improvements comprise the pillars of investigative analytics. IA is a fraud analyst-centric approach to analyzing and understanding data in support of accurate identification. It is based on highly interactive visualizations that allow users to rapidly comprehend and act on large amounts of data. This remarkable approach empowers investigators to apply their domain knowledge and experience while exploring all relevant data in a particular case.
Investigative analytics holds great promise for quickly and effectively detecting potential fraud schemes. This approach allows the investigator to ask questions of the data (who, what, why, where, and when) and explore relationships between individuals, banks, accounts, phone records, e-mail records, or other relevant data regardless of where it resides.
This approach is very different from other analytical techniques that are currently applied. Today, fraud examiners are largely dependent on first-generation business intelligence products which produce static dashboards that may describe the problem but don't allow the investigator to interact with the data in an unconstrained way. By way of example, cyberinvestigators focused on detecting network intrusion may have access to dashboards which reveal leading indicators of suspicious activity, such as spikes in e-mail activity to specific IP [Internet Protocol] addresses with attachments over a certain file size. These indicators suggest a potential malicious attack where the attacker is trying to establish a presence on a network server followed by the installation of some form of malware which could scrape credit card numbers.
The problem is, the investigator [and/or the fraud examiner] needs much more than leading indicators of the historical attacks if they [sic] are to identify and thwart the new attacks. She also needs to leverage the collective domain knowledge of the team through rich collaboration.
Statistical analysis (and predictive analytics) is another class of analytics which uses statistical techniques ranging from simple correlations to complex neural networks in an attempt to predict or forecast a specific outcome or behavior. For example, given the right amount of input data, an analyst could build a model to predict that mortgage fraud through inflated home appraisals is about to take place and the loss amount will exceed a specific dollar value.
While these techniques can work successfully, they suffer from a number of inherent weaknesses and should be used in conjunction with IA. They require a deep understanding of statistical modeling and data transformations. Additionally, since models require historical data to accurately predict the future, the accuracy of the models depends on having sufficient data.
The results of investigative analysis should be easy to understand, clear and concise, and easily transferable to others involved in the case.4
Centrifuge Analytics has become one of the most widely known fraud analytic tools of the 21st century. Its speed and accuracy in developing leads within financial investigations, audits, and threat analysis has proven to be one of the most reliable tools on the market. The next chapter reflects on the well known and widely used investigative analysis tool that assists in fraud detection through the means of criminal investigations, audits, and financial statement fraud. IBM i2 Analyst's Notebook features a well-rounded visual display of analysis that depicts intelligence gathering, terrorist financing, and other related entities to an investigation. i2 Analyst's Notebook provides a plethora of strategies to properly define analytical concepts. It allows the user to sift through voluminous amounts of financial data to ascertain the significance of relational entities. Its capabilities are phenemonal and the user has the ability to provide in-depth analysis on telephone tolls via subpoena, suspicious wire transfers, mortgage fraud comparables, and fraudulent credit card transactions. i2 Analyst Notebook is quick, sleek and gets the job done.
NOTES
1. Centrifuge Systems, “Centrifuge Interactive Analytics,” 2012.
2. Centrifuge Systems, “Centrifuge Data Visualization Techniques for Fraud Analysis,” white paper, 2010.
3. Ibid.
4. Ibid.