
ANALYSIS IS sometimes viewed as being complex in whole or in parts. In my experience each part of the analysis must be examined to determine its role and placement in the scheme. When one reassembles these parts to form an overall visual depiction, it clearly produces a conclusion or theory as to how the entities are associated and/or how their relationships stemmed from the specifics.
In the visual depiction of the analytical cycle after the collection, evaluation, and collation phases, the analysis phase begins. The analysis begins when the individual immerses himself/herself into the data. Analysis exposes preconceptions and assumptions and thus allows us to identify the hypothesis and verify our findings. Considering the circumstances of the analysis provided and the conditions under which it has been produced, at varying times analysis involves highly ambiguous situations, information that is processed incrementally, and the reasoning for assessment. As you begin to delve into the components of the analysis, IBM i2 Analyst's Notebook is an intricate part in displaying the depictions that allow integration, visualization, collection, and the like. IBM i2 Analyst's Notebook has been an extremely important tool far law enforcement and private sector entities, IBM i2 Analyst's Notebook is used to show the associations between people, places, organizations and the flow of commodities between property and money. If the data is insufficient, sound judgment is what one should use to fill the gaps in their information. IBM i2 Analyst's Notebook entails going beyond the facts and the means of inadequate information.
 RAPID INVESTIGATION OF FRAUD AND FRAUDSTERS
According to the i2 Analyst website:
Organized fraud is harmful to revenue and reputation, and is usually perpetrated across multiple systems and processes. IBM i2 Fraud Intelligence Analysis is designed to significantly reduce the costs, time, and complexity associated with these investigations.
Patterns, links, and relationships are rapidly created from vast, disparate data sets, enabling you to rapidly identify and disrupt fraud and misuse.1
The following list from the i2 Analyst website expresses the advantages of using i2 Analyst's Notebook as a visualization tool that provides a clear and succinct correlation between entities:
- Improve investigation effectiveness for better results and reduced costs.
- Broaden your investigative community and raise awareness by involving key stakeholders and specialists in the investigation.
- Make use of other IBM solutions for detecting fraud and managing investigations.
- Improve customer relationships by demonstrating a proactive stance against fraud.
- Improve your resistance to fraud by understanding system and process weakness.
Use i2 Fraud Intelligence Analysis to Improve Investigation Effectiveness
- Include any data to uncover “hidden” attacks, patterns, and trends.
- Rapid investigation leads to timely responses, significantly reducing the ongoing costs of undetected fraud.
- Produce easy-to-interpret visualization of complex fraud rings for investigation, internal repudiation, or to support prosecutorial measures.
- Easy-creation maps, timelines, temporal analysis to support investigation and response in time-critical business processes.
Broaden Your Investigative Network
- Collaborative investigation efforts to support rapid response.
- Raise fraud awareness across your community. . . .
- Early detection of suspicious patterns or transactions leading to prioritized investigation using fraud analytic methods.
- Uncovers patterns of weaknesses and enable you to take the required action needed.2
Figure 8.1 illustrates a pivotal element within the auspices of i2 Analyst's Notebook. The figure displays data extraction sets and transactions linked to associates and establishes patterns that can be used to further enhance fraud analysis and/or financial crimes investigations.
i2 ANALYST'S NOTEBOOK
With i2 Analyst's Notebook, it is an easy task to discover fraudulent activities or suspicious transactions that will produce accurate results and link associations of persons, businesses, and commodities. The linked associations of all determine and/or confirm the relationships. i2 Analyst's Notebook defines associations, establishes groups (criminal associations), establishes patterns, and displays events on a time/theme line.
IBM i2 Analyst's Notebook is at the top of the analysis spectrum. Analyst's Notebook is designed to provide a representation of visually complex criminal enterprises that are used for examining and processing large quantities of data that result in the development of recognizable patterns. According to an IBM white paper from 2012:
A flexible data acquisition approach allows analysts to more quickly collate both structured and unstructured information to help build a single, cohesive intelligence picture. The flexible data model and visualization environment coupled with a wide range of visual analysis tools help users build multiple views for detailed network, temporal, statistical, or geospatial analysis and reduce the time taken to identify key connections, networks, patterns, and trends that may exist.
The results gained from this detailed analysis can be shared via intuitive and visual briefing charts or visualizations that can be included in end user intelligence products. These can simplify the communication of sometimes complex information and ultimately help to drive more timely and accurate operational decision making.
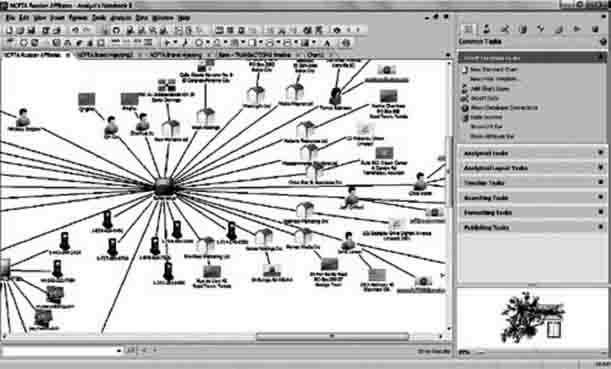
FIGURE 8.1 Association Link Chart
Source: IBM i2 Analyst Notebook Reprinted with permission of IBM i2source.
A technology road-tested by over 2,500 organizations worldwide, Analyst's Notebook is designed to help government agencies and private sector businesses in their fight against increasingly sophisticated criminal and terrorist organizations.3
Highlights
- Powerful investigative analysis tool.
- Allows for large amounts of information to be analyzed quickly: people, places, financial accounts, events and telephone numbers.
- Adds clarity to complex investigations and detects patterns.
- Provides a better understanding of terrorist financing cells, criminal organizations, check kiting, and other related financial crimes.
- Creates theme/time lines to display a common thread to a sequence of events over a period of time: suspects, transactions and associates.
Figure 8.2 allows for a quick and efficient way to identify key individuals within target networks with social network analysis. It fully associates who knows whom, how they are linked, and what methods were used in the transactions.
According to a 2012 Industry Solutions paper from IBM:
Flexible Data Modeling and Visualization
Analyst's Notebook is designed to provide users with a highly flexible data modeling environment. Users can represent information in a variety of ways, including the ability to model their data as association networks and timeline views to best suit the analysis task at hand—and help drive effective analysis and dissemination of key intelligence. Analysts can work with a wide range of data sets including social networks, communications data, financial transactions, and intelligence reports. . . .
Simple Communication of Complex Data
Analyst's Notebook offers users the means to capture and organize their data. They can create clear, intuitive briefing charts, or simply include information in other reports, to support the effective dissemination of key information. Data can also be shared with nonusers via IBM i2 Chart Reader, a freely available product that provides read-only access to charts which can then be navigated, searched, or printed. . . .
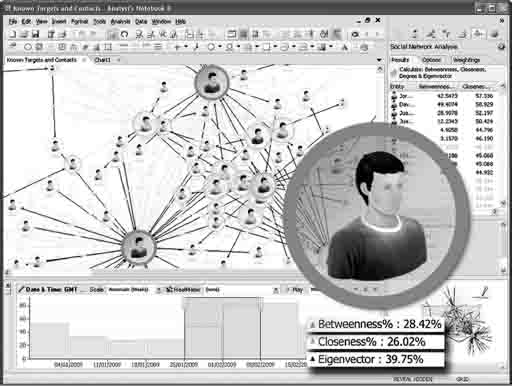
FIGURE 8.2 Link and Visualization Analysis Chart of Target Networks and Social Media
Source: IBM i2 Analyst Notebook. Reprinted with permission of IBM i2source.
i2 Analyst's Notebook can help users:
- Acquire data from disparate sources in order to piece together a coordinated picture that allows for an effective, more accurate analysis of available information.
- Establish key “who, what, where, when, and why” information by analyzing and visualizing data in multiple ways including association, temporal, geospatial, statistical, and spreadsheet views.
- Identify connections, patterns, trends, and key intelligence within a wide range of data types that might otherwise be missed.
- Discover duplicate information within data by leveraging intelligent semantic smart matching capabilities.
- Increase understanding of key individuals or groups within criminal and terrorist networks and the roles they may play, helping to guide future operational planning and resource allocation.
- Create clear and concise briefing charts to simplify the communication of complex data in support of more timely and accurate operational decision making.4
i2 ANALYST'S NOTEBOOK AND FRAUD ANALYTICS
Fraud is a significant and evolving challenge for the financial industry, costing an estimated 5 to 8 percent of revenues per annum. Criminals are becoming increasingly adept at exploiting weaknesses across multiple systems, possibly in collusion with employees, and attempting to hide in the siloed nature of enterprise data. In addition to damage to the balance sheet, fraud poses a real threat to brand and reputation with potential impact on customers, shareholders, and regulators. However, each interaction a fraudster has with your system leaves a small breadcrumb and the opportunity to intelligently link them to identify, detect, and disrupt threats.
Traditionally, companies have countered fraud with point solutions that target a specific, known threat. This approach can be difficult to manage, often missing cross-channel and asymmetric attacks perpetrated by organized criminals and almost always resulting in a more expensive, fragmented solution. This “rearview mirror” approach can also fail to spot new and emerging attacks.
IBM i2 Fraud Intelligence Analysis is designed to provide critical insights to aid in investigating complex incidents, producing actionable visualization of critical people and events and documenting results for potential prosecution.
If you cannot see the full picture you cannot respond.
Fraud Intelligence Analysis takes a holistic approach to this problem by providing:
- Inclusion of virtually any data source to provide comprehensive visibility of activity.
- Event- and rule-driven procedures to aid faster remediation and to support Know Your Customer and Customer Due Diligence.
- Distributed investigative and collaborative tools designed to leverage relevant skills and knowledge to improve results.
- Identification and forensic investigation of suspicious or unexpected activities and threats using market-leading analysis and visualization tools.
- Automated briefing updates based on role and responsibility that allow analysts and investigators to share evidence and analytical results in near real time.5
Figure 8.3 is the visualization that allows users to see the full picture of link associations. If the associations cannot be seen, the investigator cannot respond or determine their affiliation.
An IBM Industry Solutions paper from 2012 detailed some of the features of Fraud Intelligence Analysis:
Analytics and Visualization
Fraud Intelligence Analysis includes market-leading analytical tools designed to provide rapid forensic investigation of abnormal and unexpected behavior.
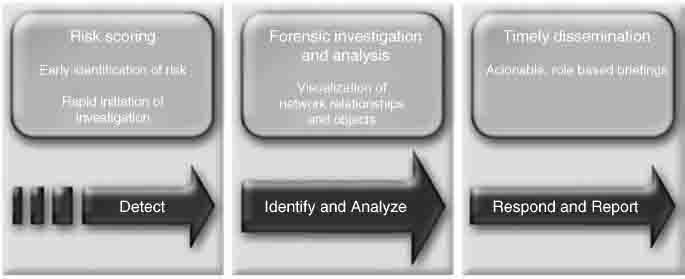
FIGURE 8.3 Governance, Risk, and Compliance Model
Reprinted with permission of IBM i2source.
With this solution, vast quantities of data from unrelated sources can be analyzed and visualized in a number of rich formats to support your investigation.
Risk Alerting
Early identification of possible fraud can eliminate the cost, time, and pain associated with complex investigations and reclamation. Knowing “who is who” and “who knows who” is critical to this process. Key fraud indicators combine information from watch lists, known fraudsters, and other relevant sources in a risk scorecard that provides visibility of risk to help enable proactive remedial action.
Collaboration and Investigation
Fraud prevention requires intelligence and involvement from across your organization. Fraud Intelligence Analysis provides an intuitive, security-rich interface for stakeholders to contribute to, share and analyze investigative data leading to faster, more informed decision making.
Investigation Management
IBM i2 Fraud Intelligence Analysis can be adapted to support your internal processes. Business rules and events may be combined to form standard operating procedures and support your compliance requirements.
Investigation Monitoring
Providing visibility [into] the fraud investigation can greatly assist . . . investigation efficiency and also improve fraud awareness across your enterprise, a great asset in the fight against fraud. Key performance indicators (KPIs) can be used to monitor progress and KPIs and related content may also be displayed through user- and role-specific dashboards.6
Figure 8.4 solidifies and explains the area of crossing the line in cross-channel attacks and depicts the cycle that represents each entity.
The IBM 2012 Industry Solutions paper continued to illustrate i2 Analyst's features:
Combating Cross-Channel Attacks
Data may be locked in disparate, unconnected databases and can be in a structured or unstructured form.
Fraud Intelligence Analysis is designed to combat this by working across your data silos to provide a “joined up,” rich view of related events, people, and objects.7

FIGURE 8.4 Repository of Analytical Risk Alerts
Source: IBM i2. Reprinted with permission of IBM i2source
HOW TO USE i2 ANALYST'S NOTEBOOK: FRAUD FINANCIAL ANALYTICS
According to the i2 Analyst's Notebook Guide, place the following types of data on your link when importing financial data:8
- Date and time in the Date and Time fields
- Dollar amount of transactions in the Label field
- Direction of transactions in the Direction field
- Change the Multiplicity of Connection to Multiple
When deciding where on your link to place information, consider the kinds of queries that you will need to perform on this data:
- How much money moved in a single transaction?
- When was the money moved?
- Where is the money going?
- What is the total amount of money being deposited at or withdrawn from a particular entity?
- What is the frequency of a particular type of transaction?
Attribute Types
As shown in Figure 8.5, in i2 Analyst's Notebook an attribute frame displays a specific occurrence. There are four attribute types: Text, Flag, Number, and Date & Time. When working with financial data, specifically when incorporating dollar amounts, make sure the attribute type is Number. Note that you want to use the Number attribute type only when you want a sum total. You don't want the i2 Analyst's Notebook to sum up telephone numbers or Social Security numbers.9
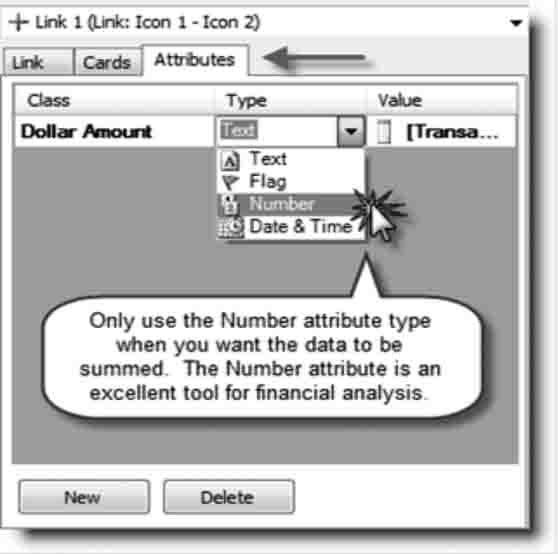
FIGURE 8.5 Changing Attribute Type in the Importer
Source: IBM i2. Reprinted with permission of IBM i2source
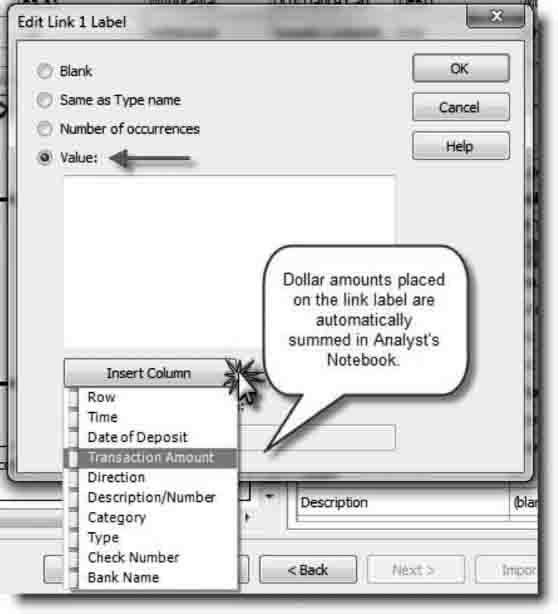
FIGURE 8.6 Place Dollar Amount on the Link Label
Source: IBM i2. Reprinted with permission of IBM i2source
Placing the column that contains the transaction amounts on the link label is very important. With the transaction amounts on the link label, you can access the more advanced analysis tools, such as Filters and Histograms or Analysis Attributes (see Figure 8.6).
Directional Data
Direction is an optional feature on links in the i2 Analyst's Notebook Import Editor. This feature allows you to dictate the direction of the arrow to be drawn between two entities based upon data in a specific column. In Figure 8.7, the Direction column in our data set specifies the direction of each transaction, a deposit or withdrawal. By indicating which arrows represent deposits and withdrawals, the resulting chart will show the proper direction of all transactions.
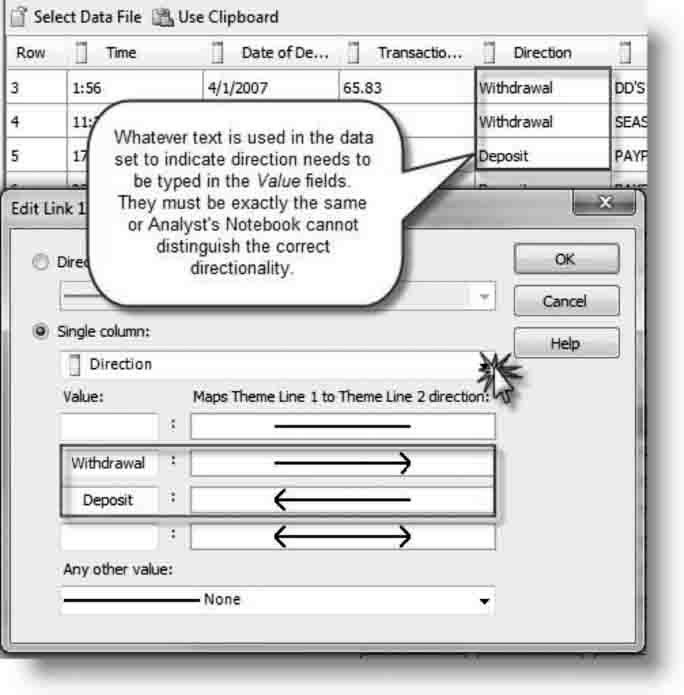
FIGURE 8.7 Mapping a Link Direction
Source: IBM i2. Reprinted with permission of IBM i2source
List Items
Found under the Analytical Tasks on the Common Tasks tab, List Items is a convenient and easy way to read columns of data.
Analysis Attributes are available for both links and entities and provide useful statistical information about chart items which may enhance your analysis. For example, they can help you determine which entity has the most transactions or the net balance for a specific account.
As shown in Figure 8.8, to add Analysis Attributes, click the Column button at the bottom of the List Items window. A new window with three tabs along the top will open. By clicking on the Analysis Attributes tab, you will see all the available Analysis Attributes. Keep in mind that there are different Analysis Attributes for entities and links.
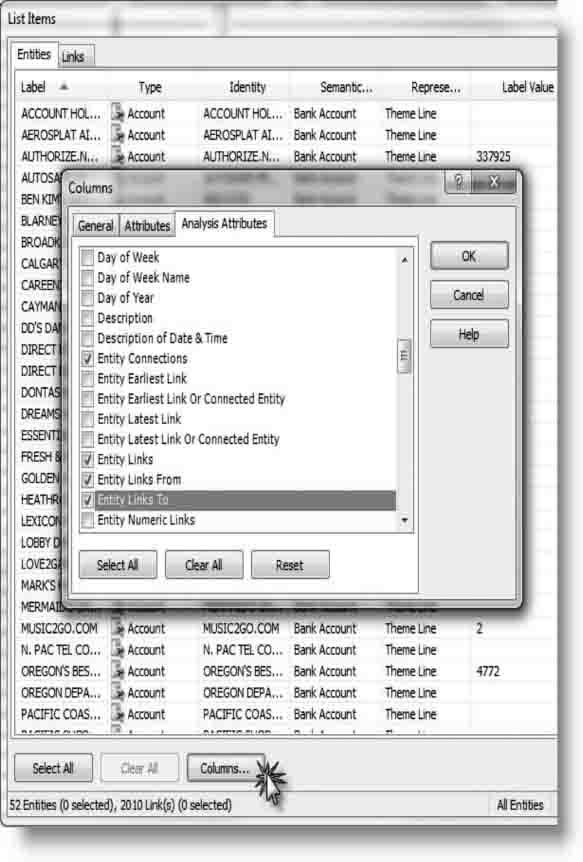
FIGURE 8.8 Adding Analysis Attribute Columns to List Items
Source: IBM i2. Reprinted with permission of IBM i2source.
For Fraud Financial Analysis use these Analysis Attributes:
- Entity Connections
- Entity Links
- Entity Links From
- Entity Links To
- Entity Sum Link Flow
- Entity Sum Links
- Entity Sum Links From
- Entity Sum Links To
USING i2 ANALYST'S NOTEBOOK IN A MONEYLAUNDERING SCENARIO
The task at hand is a simple money-laundering transaction and the elements that comprise the process.
General Process Used in Analysis
Analysis for a particular investigation is typically begun by any of the following:
- Article in a newspaper or a magazine
- News reports
- Review of analysis started by an analyst in a field office
- Suspicious activity reports (SARs)
Steps to Perform Analysis
The initial goal of the analysis is to create a profile on the person/group in which you are interested. First, analysts check in-house databases to find more information about the person or group. Then analysts check public information sources, such as LexisNexis Investigative Portal, CLEAR Thomson Reuters, and TLOXP. They will also subpoena bank records to get a more complete picture of the activities related to that person(s) or group. The goal is to get as much information as possible. The initial search process will help reveal information such as the hierarchy of the group and what kinds of crimes the group is committing. Once enough information has been gathered, it is passed on to an agent in the field to begin the investigation.
Products used in the analysis:
- i2 Analyst's Notebook
- iBase
Key product features used during analysis:
- Merging entities
- Import
- Find clusters
Problems the analyst faces in performing these steps:
- Accessing information—having to go to different machines to get data (one PC for public source information, another PC for classified information, etc.)
- Difficult to combine information from the various data sources being used (different information collected, different fields in various databases, etc.)
How i2 products help solve these problems:
- Online Chart Saver allows users to save a chart that they have gotten from a public source and combine that with an Analyst's Notebook chart stored on another computer.
- The Merge Entities functionality allows users to easily combine entities that are alike although they may come from different sources.
MONEY-LAUNDERING SCENARIO
You are an analyst/fraud examiner/investigator/accountant with the United States Department of Justice in the White Collar Financial Crimes Unit. Since investigations are opened in the field and not at headquarters, the goal of the analysis is to gain enough information to generate a field analyst's interest in beginning an investigation.
An SAR comes across your desk from the Financial Crimes Enforcement Network download that catches your attention. Quick Copy, a photocopy shop in Washington, DC, is reported as having made many large cash transactions over a short period of time. More than $500,000 has flowed through the account in two weeks, which is an unusually high amount for a photocopying business. You find out that the shop is owned by James Carter and check to see if your internal databases contain any information on him.
Retrieve bank information from an internal database using iBase
- Connect to your database.
- Find James Carter.
- Expand to see accounts connected to Carter.
- Expand again to find other accounts/entities connected to Carter.
Use i2 Analyst's Notebook (if the user pulls the bank information from a spreadsheet)
- Import spreadsheet into Analyst's Notebook.
- Visual Search.
- Linked Entities tab.
- Choose Link.
- Label/Connection: Link Count greater than 10.
- Apply to Entity A, Entity B, Link (to see high-volume flow and where it is going to/from).
- Cut and paste those items onto a new chart so that you can see the people/organizations involved in the high-volume activity.
- Zoom in on James Carter in the chart.
Your search of bank information shows that, after flowing through a series of other accounts, large sums of money are flowing from a company called Global Cash Connections into James Carter's account.
You also see that somewhere in this flow of money, a Joe Johnson has multiple accounts listed and that a large amount of money is flowing from his account to James Carter's account.
Use i2 Analyst's Notebook
- Merge those entities.
- Other unique features of i2 Analyst's Notebook may be useful here.
Now we can more easily see that money is flowing from a company to an individual using several middleman accounts. (You could also do a find search, using iBase, between James Carter and Global Cash Connections to show the user another way to see the money flow between those entities.)
Now let's find the relationship between James Carter and Global Cash Connections.
Use i2 Analyst's Notebook
- Go to Dun & Bradstreet and run a search on Global Cash Connections.
- Drag visualization into i2 Analyst's Notebook using iBase.
From this search, you find that Joe Johnson is the CEO of Global Cash Connections, and you remember his account was one involved in the flow of money to James Carter. This catches your attention, so you want to find out more about Joe Johnson.
Use i2 Analyst's Notebook
- Go to LexisNexis Accurint Law Enforcement Solutions and run a query on Joe Johnson.
- Drag visualization into i2 Analyst's Notebook using iBase.
From this, you learn that there were several judgments against Joe Johnson, one being that he was arrested for drug trafficking in 2000 but not convicted. You also learn that Joe Johnson is an alias for Sam Carter. Upon further investigation, you find that Sam Carter is James Carter's brother. As a result of your analysis, you believe that Quick Copy and Global Cash Connections are fronts for the Carter brothers' drug activities. You now have enough information to pass on to one of your agents/fraud examiners in the field.
Since you know that the agent/auditor/accountant who will work on this investigation does not have i2 Analyst's Notebook, you save the Dun & Bradstreet Report and LexisNexis Investigative Portal visualizations as .anb files using i2 Analyst's Notebook Chart Reader so that others can view the final Analyst's Notebook chart in Chart Reader. With the chart, you also send a brief narrative on how the information was pulled together along with all of the information that was collected for analysis.
IBM i2 Analyst's Notebook is capable of providing the most accurate results in fraud analysis. It gives the user insight into the relationships among perpetrators, providers of fraud rings, and the like. It rapidly identifies patterns, links, and relationships that connect the entities. It provides visualizations that illustrate the scope of the fraud, generates leads, provides documentation for evidentiary purposes, and enhances the progress in furtherance of prosecutorial measures.10
Chapter 9 will focus on additional fraud analytical tools that are essential to detection and prevention of fraudulent transactions—SAS Visual Analytics and Actionable Intelligence Technologies' Financial Investigative System.
NOTES
1. www-03.ibm.com/software/products/us/en/fraud-intelligence-analysis/
2. Ibid.
3. IBM, “IBM i2 Analyst's Notebook,” white paper, October 2012. http://public.dhe.ibm.com/common/ssi/ecm/en/zzw03172usen/ZZW03172USEN.PDF
4. IBM, “IBM i2 Analyst's Notebook,” Industry Solutions paper, November 2012. http://public.dhe.ibm.com/common/ssi/ecm/en/zzd03127usen/ZZD03127USEN.PDF
5. IBM, “IBM i2 Fraud Intelligence Analysis,” Industry Solutions paper, November 2012. http://public.dhe.ibm.com/common/ssi/ecm/en/zzd03127usen/ZZD03127USEN.PDF
6. Ibid.
7. Ibid.
8. “Analyst's Notebook Guide,” i2 Limited, 2009.
9. Ibid.
10. Ibid.