
The Power to Know Big Data:
SAS Visual Analytics and Actionable Intelligence Technologies' Financial Investigative Software
ONE CHALLENGE when working with big data is how to display results of data exploration and analysis in a way that is meaningful but not overwhelming.
 THE SAS WAY
As stated in a 2012 SAS white paper:
A picture is worth a thousand words—especially when you are trying to understand and gain insights from data. It is especially relevant when you are trying to find relationships among thousands or even millions of variables and determine their relative importance.
Organizations of all kinds generate huge amounts of data each minute, hour, and day. Everyone—including executives, departmental decision makers, call center workers, and employees on production lines—hopes to learn things from collected data that can help them make better decisions, take smarter actions, and operate more efficiently.
If your data has billions of rows, one of the best ways to discern important relationships is through advanced analysis and high-performance data visualization. If sophisticated analyses can be performed quickly, even immediately, and results presented in ways that showcase patterns and allow querying and exploration, people across all levels in your organization can make faster, more effective decisions.
To create meaningful visuals of your data, there are some tips and techniques you should consider. Data size and column composition play an important role when selecting graphs to represent your data. This [section] discusses some of the issues concerning data visualization and provides suggestions for addressing those issues.
In addition, big data brings a unique set of challenges for creating visualizations. [This section] covers some of those challenges and potential solutions as well. If you are working with large data, one challenge is how to display results of data exploration and analysis in a way that is not overwhelming. You may need a new way to look at the data that collapses and condenses the results in an intuitive fashion but still displays graphs and charts that decision makers are accustomed to seeing. You may also need to make the results available quickly via mobile devices and provide users with the ability to easily explore data on their own in real time.1
While the term “big data” is typically used to encompass the ever-increasing volume, variety, and velocity of data that organizations are seeing, SAS, in the 2012 white paper, considers two other dimensions when thinking about big data: variability and complexity.2
Visualizing Big Data
Big data brings new challenges to visualization because there are large volumes, different varieties, and varying velocities that must be taken into account. The cardinality of the columns you are trying to visualize should also be considered.
One of the most common definitions of big data is data that is of such volume, variety, and velocity that an organization must move beyond its comfort zone technologically to derive intelligence for effective decisions.
- “Volume” refers to the size of the data.
- “Variety” describes whether the data is structured, semistructured, or unstructured.
- “Velocity” is the speed at which data pours in and how frequently it changes.
Building upon basic graphing and visualization techniques, SAS Visual Analytics has taken an innovative approach to addressing the challenges associated with visualizing big data. Using innovative, in-memory capabilities combined with SAS Analytics and data discovery, SAS provides new techniques based on core fundamentals of data analysis and presentation of results.
Large Data Volumes
One challenge when working with big data is how to display results of data exploration and analysis in a way that is meaningful and not overwhelming. You may need a new way to look at the data that collapses and condenses the results in an intuitive fashion but still displays graphs and charts that decision makers are accustomed to seeing. You may also need to make the results available quickly via mobile devices and provide users with the ability to easily explore data on their own in real time.
When working with massive amounts of data, it can be difficult to immediately grasp what visual might be the best to use. Autocharting takes a look at all of the data you are trying to examine and then, based on the amount of data and the type of data, it presents the most appropriate visualization technique. SAS Visual Analytics uses intelligent autocharting to help business analysts and nontechnical users easily visualize their data. With this functionality they can build hierarchies on the fly, interactively explore the data, and display data in many different ways to answer specific questions or solve specific problems without having to rely on constant assistance from [the information technology department] to provide new views of information. . . .
For example, what if you have a billion rows in a data set and want to create a scatter plot on two measures? The user trying to view a billion points in a scatter plot will have a hard time seeing so many data points. And the application creating the visual may not be able to plot a billion points in a timely or effective manner. One potential solution is to use binning (the grouping together of data) on both axes so that you can effectively visualize the big data. . . .
Visualizing your data can be both fun and challenging. If you are working with big data, it is easier to understand information in a visual way as compared to a large table with lots of rows and columns.
However, with the many visually exciting choices available, it is possible that the visual creator may end up presenting the information using the wrong visualization. In some cases, there are specific visuals you should use for certain data. In other instances, your audience may dictate which visualization you present. In the latter scenario, showing your audience an alternative visual that conveys the data more clearly may provide just the information that's needed to truly understand the data.
You can choose the most appropriate visualization by understanding the data and its composition, what information you are trying to convey visually to your audience, and how viewers process visual information. And products such as SAS Visual Analytics can help provide the best, fastest visualizations possible.
Dealing with billions of records on a regular basis is just a reality of doing business today, and SAS understands that. SAS Visual Analytics allows you to explore all of your data using visual techniques combined with industry-leading analytics. Visualizations such as box plots and correlation matrices help you quickly understand the composition and relationships in your data.
With SAS Visual Analytics, large numbers of users (including those with limited analytical and technical skills) can quickly view and interact with reports via the Web or mobile devices, while IT maintains control of the underlying data and security. The net effect is the ability to accelerate the analytics life cycle and to perform the process more often, with more data—all the data, if that's what best serves the purpose. By using all available data, users can quickly view more options, make more precise decisions, and succeed even faster than before.3
ACTIONABLE INTELLIGENCE TECHNOLOGIES' FINANCIAL INVESTIGATIVE SOFTWARE
Financial Investigative Software (FIS) is a financial analysis tool used frequently by the federal government on sophisticated financial crimes cases; however, of late, this tool has become important to the private sector as well due to its multifaceted capabilities of analysis, scanning, and importing tedious financial documentation. The FIS platform from Actionable Intelligence Technologies (AIT) provides significant productivity enhancements on the data import side, combined with an ability to link payers, payees, individuals, assets, organizations, and accounts—of any size or type (can be multiples of each)—all in one single database.
FIS is the only solution on the market that automatically captures and reconciles data from hard copy or electronic records including (but not limited to) bank accounts, brokerage accounts, cash management accounts, credit card accounts, e-mails, invoices, mortgage documents, HUD1, truth in lending, good faith estimates, wire transfer reports, automated clearinghouse reports, FedWire, contracts, billing documents, deposited items, checks, cashier's checks, profit and loss statements, capitalization tables, transaction detail reports, journal reports, medical prescriptions—as well as virtually any proprietary financial industry mainframe format. The FIS tool can support data capture and automated analysis from applications such as QuickBooks, Quicken, Access, Sage, Peachtree, and Excel as well as larger business management platforms such as SAP and Oracle.
It is a fact that within financial investigations, the better (more comprehensive and accurate) the work, the better the outcome. The problem exists with the labor required to reformat hard copy or electronic files source records (bank/brokerage statements, etc.). Manually entering data for analysis is tremendously time consuming and expensive, which can have a negative impact on budgets and results.
FIS provides the means to increase revenues, lower costs, and streamline operations. These enhancements increase investigative success while simultaneously decreasing case cycle times and the cost to conduct these investigations. Follow the money is a noted cliché. However, nevertheless, it is a true fact. One of the most challenging problems within the financial investigation area is that, even when you can trace the funds, can you still recover the monies? FIS finds the money and assists in seizing assets. FIS is better utilized in case preparation, in-depth financial analysis, and prosecutorial support tasks. “FIS allows . . . investigators to rapidly process and analyze the voluminous amount of data contained in both hard copy and electronic financial records.”4 A 2010 article in Informant discussed in detail this essential feature of AIT's FIS:
In some client businesses, paper documents still prevail. However, documentation of data and financial transactions has gone green. Technology has reduced dependence on paper documents, allowing the creation of data in more detail without requiring as much space as paper requires. . . .
Typically the process of organizing and analyzing data and documents involves searching file cabinets and storage cartons for paper financial records that will be entered manually into an electronic database along with electronic files and documents that will be reformatted manually. These data and documents end up in spreadsheets and databases to be analyzed.
According to AIT, “An average human can enter 1,500 transactions per week, reconciled.” When investigating possible criminal activity, the accountant's manual input, along with that of his or her associates, might involve identifying, recording, extracting, sorting, reporting and verifying financial data or other accounting documents. The volume of data may vary, depending on the case. AIT says that “The range is typically in the thousands or tens of thousands,” although cases involving money laundering and narcotics “can produce millions of transactions for analysis.
AIT's FIS helps to streamline the process with proprietary routines that automatically convert paper and electronic financial records into “real-time actionable intelligence.” The accuracy and speed of FIS allow investigation of comprehensive data rather than just a statistical sampling. According to one AIT client, IRS Criminal Investigation (CI), the FIS software enables them to do a typical [human] year of work in 24 hours.
The FIS software uses AIT's “intelligence parsing” technology. This application accommodates all electronic formats, including the proprietary formats of financial institutions, electronic images, and hard copy financial documents to be analyzed by a software tool designed for financial investigations. In addition to comprehensive financial analysis, the software's functions include identifying sources and destinations and illustrating activity patterns and fund flows (see Figure 9.1).5
A CASE IN POINT
The Informant article continues with a case study:
Consider how beneficial the FIS software was to the El Dorado Task Force, a Department of Homeland Security initiative, in its investigation of Broadway National Bank in New York. Eventually Broadway pleaded guilty to not following anti-money laundering rules. The bank's failure to do so helped drug dealers and other criminals to launder more than $120 million. The task force uncovered the criminal activity. [An Immigration and Customs Enforcement agent] said more than $80 million in drug proceeds were moved through the bank after some criminal organizations learned the bank was not following proper procedures.
Launderers' MO
The methods of operation of money laundering patrons of Broadway National Bank, a privately held community bank in Manhattan, illustrate the benefit of FIS software in identifying fund flows and activity patterns. One customer sent a “runner” into the bank carrying a duffel bag packed with $660,000 in cash, which was quickly transferred overseas. In most cases, the money was wired to several different countries, including Colombia, Panama, Switzerland, Lebanon, and Pakistan. Other customers would make a flurry of deposits just below the $10,000 amount that requires reporting to federal regulators. By doing so, they would be perpetrating a crime known as structuring or smurfing.
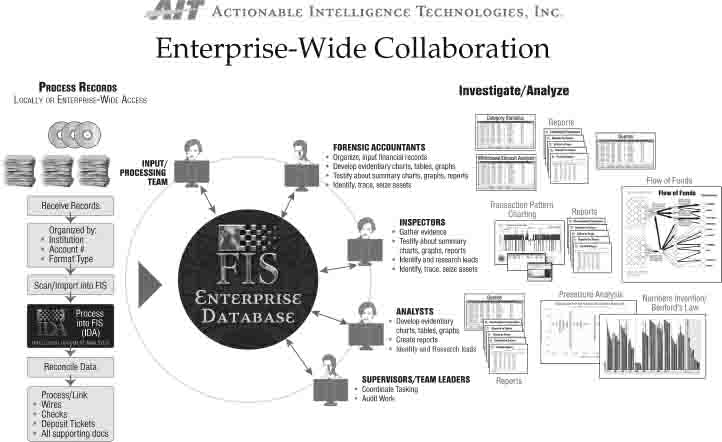
FIGURE 9.1 FIS Hierarchy/Analytical Chart
Source: Actionable Intelligence Technologies, Inc. Reprinted with permission of Actionable Intelligence Technologies.
Broadway National pleaded guilty to failing to maintain a sufficient anti-laundering program. Required by the Bank Secrecy Act, such programs include control mechanisms, the designation of a compliance officer, and ongoing employee training on how to identify suspicious transactions. The Office of the Comptroller of the Currency repeatedly warned Broadway National about its laxity in complying with the required program.
The U.S. District Court in Manhattan fined Broadway National Bank $4,000,000 on three counts of a felony indictment.6
Who Uses FIS?
Many federal agencies attest to productivity increases resulting from FIS software. New York's Homeland Security Investigations stated that
the software provided a 60-fold productivity increase in an average investigation. Their investigations usually include case preparation, prosecutorial support, and in-depth financial analysis involving voluminous amounts of data in both paper and electronic financial records. . . .
By increasing productivity, the FIS application helps firms cut turnaround times and costs, take on more engagements, and delegate employees to functions most suitable for them. . . . In an analysis of two months' of financial documents that took place in one afternoon, the FIS software illustrated how much money was being embezzled and where it was going. FIS demonstrated very quickly that [a client's] suspicions were founded.7
The FIS approach has been put to the test in some of the most demanding applications worldwide and has proven to be highly effective. If analysts, fraud examiners, or investigators are able to gain access to critical data in support of their investigation, if they can identify hidden relationships within massive data sets, if they can notify others of results, the identification process is improved while also enhancing detection, reporting, and issue resolution.8
Because of these benefits and the enormous information challenges organizations face today, fraud analytics is taking on new meaning worldwide as fraud analysts, intelligence analysts, cybersecurity analysts, and law enforcement leverage technology to efficiently and effectively identify fraud.9
NOTES
1. SAS, “Data Visualization Techniques: From Basics to Big Data with SAS Visual Analytics,” white paper, 2012, p. 1. http://smartest-it.com/sites/default/files/Data%20Visualization_SAS.pdf
2. International Data Corporation, “Big Data Analytics: Analyzing the Future,” September 2011.
3. SAS, “Data Visualization Techniques,” pp. 8–9, 18.
4. Actionable Intelligence Technologies, “FIS: Follow the Money.” www.aitfis.com/FIS.htm
5. William J. Moran, “Executing Efficient Forensic Investigations,” Informant (January–June 2010): 18.
6. Ibid., pp. 18–19.
7. Ibid., p. 19.
8. “Guide to Using FIS,” Actionable Intelligence Technologies, 2012.
9. Centrifuge Systems, Inc, “Data Visualization Techniques for Fraud Analytics,” 2010, http://govwin.com/attachment/getfile/0/51538c61914b9/Data%20Visualization%20for%20Fraud%20Analysis.pdf