CHAPTER OVERVIEW
We define instructional graphics as pictorial expressions of content designed to promote learning and improve performance in work settings. The learning value of any visual will depend on three interactive factors: (1) the features of the visual, (2) the content and goal of the lesson, and (3) characteristics of the learners. We introduce three views of graphics based on their surface features, their communication functions, and their interactions with psychological learning processes. To get the most learning value from visuals, we recommend that you design and select instructional graphics based on their communication and psychological functions rather than on their surface features. We acknowledge that decisions about graphics cannot be made on psychological factors alone. They must also take into consideration the entire instructional landscape including delivery media, learning environment, and pragmatic factors such as schedules and budget.
Our guiding principles underlying the recommendations throughout the book are:
Graphic effectiveness depends on graphic functionality
Guidelines for graphics should be based on research evidence
Context will influence the best use of visuals in any specific training or job support product
Words and graphics are your two basic tools to help learners build new knowledge and skills. Of these two, most of us have greater expertise with words since we are trained to read and to write from an early age. The use and interpretation of graphics is a more neglected skill. Often graphics in instructional materials are afterthoughts used to add visual interest to the page or screen. Consequently, the power of illustrations to promote learning is often unrealized. In fact, some instructional materials include graphics that actually depress learning!
How effective are the graphics in your organizations' reference and training materials? Mayer, Sims, and Tajika (1995) and Woodward (1993) independently found that only a small proportion of the visuals included in textbooks serve any important instructional purpose. In a recent analysis of 52 software and 52 hardware manuals published between 1991 and 1998, Van derMeij, Blijleven, and Jansen (2003) report that 80 percent of the screen captures in software manuals are suboptimal in that they consist of flat pictures that are not labeled and that do not illustrate an activity flow. The hardware manuals included a higher proportion of more effective visuals. Even so, 48 percent of the pictures in hardware manuals lacked labels or user action flows. In summary, more often than not, graphics are either underutilized or misapplied in a range of instructional media from books to e-learning.
This book is about graphics and learning. Our goal is to help you plan or select the types of visuals proved to improve learning and to avoid the types of visuals shown to disrupt learning. Although a great deal of research has been done on visuals and learning in the last 30 years, most guidelines published prior to 1990 are ambiguous. For example, a summary of hundreds of research experiments conducted in the 1970s and 1980s that involved over 48,000 students concluded that "visuals are effective some of the time under some conditions" (Rieber, 1994, p. 132).
In the last 15 years, however, research on visuals has yielded significantly more useful guidelines. Unfortunately, most of this research is scattered in diverse academic journals not typically read by practitioners. To make this knowledge accessible, we summarize guidelines based on recent research that direct you toward graphics proved effective to promote learning and away from visuals proved to depress learning. The increasing use of highly visual media such as computers, combined with easy access to visuals through online clip art, make this an ideal time to translate this research for individuals who plan, develop, or select instructional materials.
For the purposes of this book, we use the terms graphics, pictures, visuals, and illustrations interchangeably. Graphics specialists of course have very specific meaning for these terms. But we will use them here interchangeably to reference most any non-textual element added to training materials. We include a wide range of iconic displays commonly found in instructional materials including photographs, line drawings, animations, graphs such as pie charts, and video. Specifically we focus on visuals designed to improve learning and performance on the job.
For the purpose of this book, we formally define graphics as iconic expressions of content that are designed to optimize learning and performance in ways that improve the bottom-line performance of organizations. Our definition incorporates three ideas:
By iconic we refer to representations of content that are pictorial. As shown in Table 1.1, the surface features of such visuals may be static or dynamic and they may have high or low degrees of correspondence to real things. Thus a photograph is a highly realistic representation that is static, whereas an animation is a dynamic visual that may be realistic or abstract.
The second idea in our definition, "designed to optimize learning and performance," refers to the purpose of the visual. We focus on graphics that are intended to support learning or improve performance in the workplace. Thus we include examples from a range of instructional materials such as text pages and online screens as well as from work aids such as job cards and Web screens designed to help workers complete job tasks more effectively.
Table 1.1. Surface Features of Graphics.
Types
Salient Feature
Definition
Example
Static Art
Illustration
Depiction of visual elements, using various media and techniques such as pen and ink, watercolor, and computer drawing packages.
Pen and ink outline art
Two-dimensional watercolor of flower parts
Diagrams and charts
Photographic
Captured image, using photographic or digital technologies
Screen capture of a software screen
Photo of person answering phones
Modeled
Computer Generated (CG)-A faithful reproduction of reality, using various media, included computer-assisted drawing packages
Three-dimensional representation of an office
Three-dimensional representation of combustion engine
Dynamic Art
Animation
Series of images that simulate motion
Demonstration of steps in a software procedure
Process of ammunition detonation shown through line art
Video
Series of images, captured as they occur, digitally or on film or magnetic tape, displayed serially, over time
Capture of the hydrogen bomb test explosion at White Sands, New Mexico
Film of Human Resources Director interviewing a job applicant
Virtual Reality
Interactive three-dimensional world that dynamically changes as the "user" moves through and views it
Simulated walkthrough of the human heart.
Finally, by "bottom-line performance" we mean visuals that improve learning or performance in ways that pay off in improved organizational results. Visuals are often more expensive to produce than words. To achieve a return on investment from your visuals or work aids, you must be sure that they fill a gap in knowledge or skills or support work tasks that align with organizational goals. All too often training is used as a silver bullet to solve organizational problems that are not related to knowledge and skill gaps. As we describe the best use of visuals for learning we assume that a performance analysis has shown that training or job support is an appropriate intervention. For more information on performance analysis, see the book First Things Fast (Rossett, 1999).
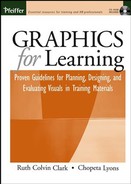
Unfortunately, there is no simple formula you can use to design or select visuals that improve learning and performance. The learning value of a visual will depend on three interactive factors summarized in Figure 1.1, including (1) the communication and psychological functions of the visual, (2) the content and goal of the instruction, and (3) individual differences among learners.
In describing graphics, most of us use terms such as line art or photograph that refer to their surface features. But for learning purposes, the functional characteristics that affect how the illustration communicates information or how it facilitates psychological learning processes are more important than its surface features. Therefore we present three different views of visuals based on their (1) surface features that focus on what they look like and how they are created, (2) communication functions that focus on how they convey information, and (3) psychological functions that focus on how they facilitate human learning processes. Table 1.2 summarizes these three views.
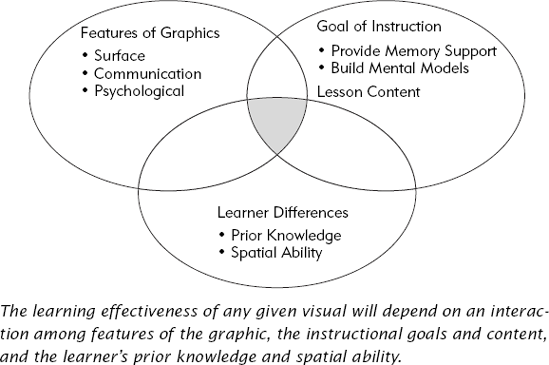
Much research on visuals prior to 1990 that focused on their surface features did not give us very helpful guidance. For example, older experiments might compare the effectiveness of an animation with a static line graphic. However, recent research shows that it's not surface features that determine the effectiveness of a visual for learning purposes. For example, Hegarty, Narayanan, and Freitas (2002) found that when they designed visuals to illustrate a mechanical process based on a model of human learning, learning was the same whether the illustrations were presented in a multimedia animated format or presented as several still drawings on paper. Conversely, they found that a commercial, slickly produced animated version of the same mechanical process that did not apply a model of human learning, did not result in as good learning as either of their versions. Similarly, Michas and Berry (2000) found that people could learn to perform a simple procedure equally well from the three graphics shown in Figure 1.2 A, B, and C. These graphics include line art that explains the actions in words, line art that adds arrows to indicate movement, and video that shows the actions. In summary, the learning effectiveness of a visual is more about planning graphics that work psychologically than about the surface features or delivery media of those visuals.
Table 1.2. Three Views of Graphics for Instruction.
View | Classification Based on: |
|---|---|
Surface | The salient features of visuals such as static art (illustration, rendered, photograph), dynamic art (video, animation) and true virtual reality |
Communication Function | The communication purpose such as to show motion or to illustrate quantitative relationships |
Psychological Function | How visuals interact with human learning processes such as attention or retrieval |
Just as we rely on language grammars to help us assemble words correctly, we need classification systems for visuals that go beyond surface features. To help you plan graphics based on their functional properties, we describe our adaptation of a taxonomy of illustration recently summarized by Carney and Levin (2002) and illustrated by Lohr (2003). The taxonomy is summarized in Table. 1.3. This taxonomy will help you plan visuals based on their communicative functions—not just their surface features. Later in this chapter, we describe the communication taxonomy in greater detail.
In addition to communicating effectively, your visuals also must support critical psychological learning processes. Visuals that disrupt these processes have been shown to depress learning. For example, Harp and Mayer (1998) found that adding visuals and text that were topically related to the lesson but extraneous to the lesson goal depressed learning. They created two versions of a lesson that taught the process of lightning formation. The basic lesson version used words and relevant visuals to depict the process. The enhanced lesson version added short vignettes with visuals such as a video of lightning striking trees, an ambulance arriving near the trees, and a lightning victim being carried in a stretcher to the ambulance. At the same time, the narrator said: "Approximately 10,000 Americans are injured by lightning every year...." (p. 415). Learning was about 30 percent better for students using the basic lesson version lacking the graphic enhancements. The enhancements actually depressed learning because they interfered with the psychological processes involved in learning how lightning forms.
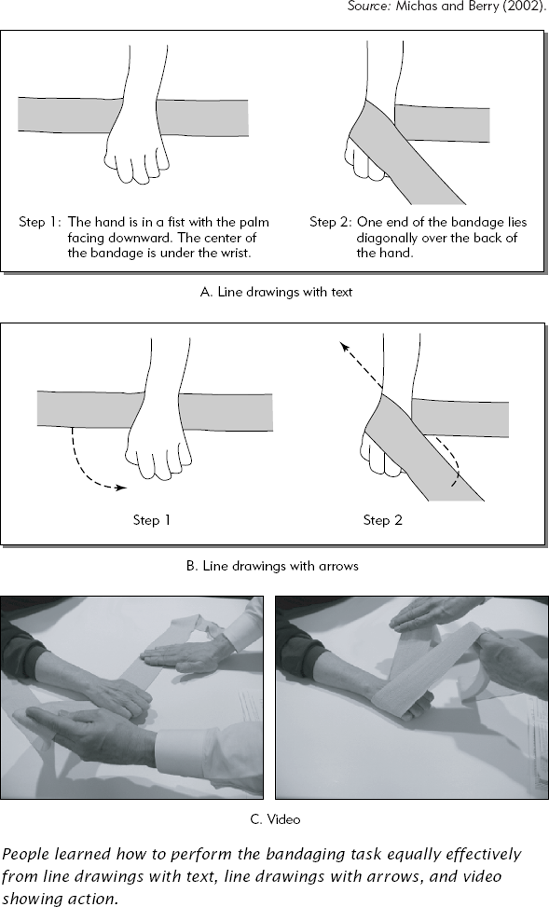
Table 1.3. Communication Functions of Graphics.
Function | A Graphic Used to | Examples |
|---|---|---|
Decorative | Add aesthetic appeal or humor |
|
Representational | Depict an object in a realistic fashion |
|
Mnemonic | Provide retrieval cues for factual information |
|
Organizational | Show qualitative relationships among content |
|
Relational | Show quantitative relationships among two or more variables |
|
Transformational | Show changes in objects over time or space |
|
Interpretive | Illustrate a theory, principle, or cause-and-effect relationships |
|
To promote the design and planning of graphics that work with rather than against human learning processes, we describe a third way to catalog illustrations based on learning processes. This classification system summarized in Table 1.4 organizes graphics according to how they support the six psychological events of learning that are overviewed later in this chapter and described in greater detail in Chapter Three.
Table 1.4. Psychological Functions of Graphics.
Instructional Event | Definition | Example |
|---|---|---|
Support Attention | Graphics and graphic design that draw attention to important elements in an instructional display and that minimize divided attention |
|
Activate or Build Prior Knowledge | Graphics that engage existing mental models or provide high-level content overview to support acquisition of new information |
|
Minimize Cognitive Load | Graphics and graphic design that minimize extraneous mental work imposed on working memory during learning |
|
Build Mental Models | Graphics that help learners construct new memories in long-term memory that support deeper understanding of content |
|
Support Transfer of Learning | Graphics that incorporate key features of the work environment; graphics that promote deeper understanding |
|
Support Motivation | Graphics that make material interesting and at the same time do not depress learning |
|
The goal of the training is a second factor that influences the value of a given graphic. Certain kinds of visuals support memory for content. Other kinds of visuals help learners see the relationships among information in a lesson and in turn help learners build mental models that are the basis for higherlevel thinking and problem solving. Therefore, the value of a particular visual depends on your instructional goal.
In addition, visuals should be selected based on the type of content included in your learning materials. In Section Three of this book, we describe the selection of visuals to support five content types that make up much of the information included in training for work settings.
The same visual treatment may be more helpful to some learners than to others, depending on their prior knowledge and on their spatial abilities. For example, Gyselinck and her colleagues (2002) compared the learning of high and low spatial ability students from physics lessons that distributed explanatory text with and without illustrations over several screens. To learn the lesson concepts, students needed to integrate the information spread among the screens.
The researchers found that adding relevant illustrations to the text significantly increased learning of high but not low spatial ability students. Figure 1.3 summarizes part of their results. They conclude that "altogether, these results suggest that a high spatial capacity could help subjects integrate pictorial and verbal information efficiently" (p. 675). In Chapter Ten we summarize what is known about individual differences in the processing of and learning from graphics.
In summary, we see that several factors interact to determine the influence of any given visual on learning. These include the surface and functional features of the graphics, the intended learning outcome (such as memory for content or application of content), as well as the type of content taught and the learners' profile, including their prior knowledge of the lesson content and their spatial abilities. Because it is the interplay of these various elements that determines the instructional effectiveness of a graphic, there are no simple rules for deciding on the best visual for your training materials. Throughout the book we provide guidelines that will help you plan or select visuals that are likely to improve learning. You will need to adapt these guidelines to your own unique mix of learners, learning goals, and lesson content.
Table 1.1 organizes visuals based on their surface features, which are how graphics are most commonly described. Therefore, we will not elaborate on surface features beyond the definitions and examples illustrated in Table 1.1. Although surface features are not the primary determinants of learning effectiveness, they do have important technical, cost, and production implications. For example, to create and deploy an animated visual typically requires greater bandwidth, greater cost, and involves different production issues than using a static illustration. Therefore, when planning more elaborate visuals such as animations, you want to be sure that you get learning payoff from their functional features. In the next sections we describe in more detail the communication and psychological functions of visuals.
Visuals of very different surface features can be equally effective as long as they convey the message relevant to the instructional goal. Table 1.3 summarizes our adaptation of Carney and Levin's taxonomy of visuals based on their communication functions. The key communication functions of graphics are decorative, representational, mnemonic, organizational, relational, transformational, and interpretive. We briefly describe each of these here.
Decorative graphics like the one shown in the Introduction (Figure I.3) are added to instruction for aesthetic, humorous, or motivational purposes. Although they may be related topically to the content of the lesson, they are largely extraneous to its goals. Often, decorative graphics are included to add visual appeal or interest to a lesson.
Self-paced multimedia lessons, in particular, are subject to high learner attrition, so decorative eye candy is often added to spice up the materials. However, excessive use of decorative graphics risks interfering with essential cognitive learning processes needed to promote learning. Therefore, we discourage their use.
Representational visuals portray the appearance of lesson content. The goal is to illustrate what the content looks like in a realistic manner. Some examples include illustrations of a keyboard, a new DVD player, or a software application screen. These kinds of visuals often have a high degree of fidelity as in photographs or screen captures. They can also omit extraneous detail as in a line drawing. The key to representational graphics is that they are intended to faithfully represent the "real" object.
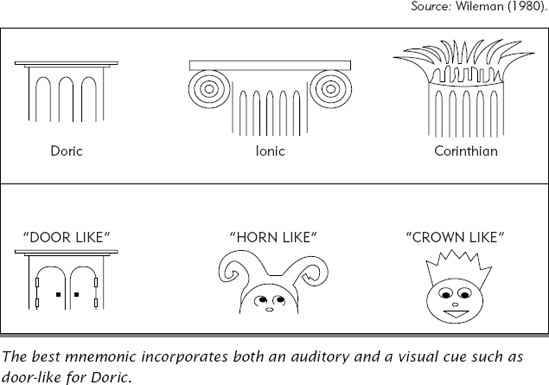
Mnemonic visuals aid in the recall of lesson facts and concepts. For example, Figure 1.4 shows a visual mnemonic used to illustrate the concepts of three types of columns: Doric, Ionic, and Corinthian.
Mnemonic graphics capture the meaning of facts or concepts and link them visually to a different concept that provides a bridge to their meaning, a visual analogy. Thus, we see the visual representation of a "door" in the mnemonic visual that leads you to the name and look of a Doric column. Mnemonics have proved to be very powerful memory retrieval devices (Carney and Levin, 2002). One limitation to mnemonics is their cultural or linguistic specificity. This specificity makes many mnemonic treatments difficult to disseminate to a global audience.
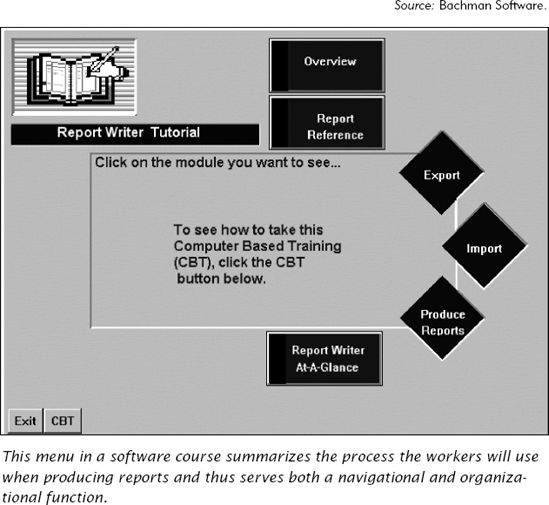
Organizational visuals illustrate qualitative relationships among lesson content. They are typically represented in trees, organizational charts, or in knowledge maps made up of nodes and links. Figure 1.5 shows an organizational graphic used to illustrate the relationship among major functions of a new software system.
Another common type of organizational visual is representation of lesson structure in a two-dimensional menu that communicates not only the topics but the relationship of topics to one another. Robinson and Molina (2002) report that some organizational visuals actually improve learning of conceptual relations better than do outlines that include the same information but lack the two-dimensional spatial representations.
Relational visuals are used to communicate quantitative relationships among two or more variables and include charts and diagrams such as pie charts, line graphs, and bar charts. Figure 1.3 is a typical example. The use of relational graphics has grown from 900 billion in 1983 to 2.2 trillion in 1994 (Jones and Careras, 1994). However, only recently has controlled research focused on the kinds of graphs and charts that are most effective for specific purposes.
Transformational visuals communicate movement and change over time or over space. The surface features of transformational graphics can include animations, video, or line drawings with movement indicators. The visuals shown in Figure 1.2 are all examples of transformational visuals with different surface features.
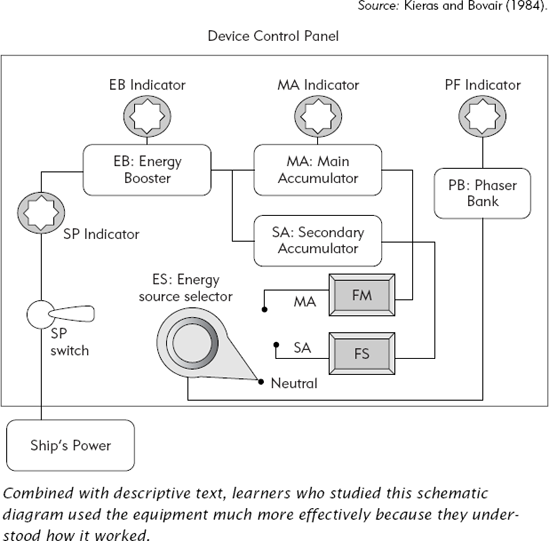
Interpretive graphics help learners build mental models of events or processes that are invisible, abstract, or both. Figure 1.6 shows an interpretive visual in the form of a schematic diagram illustrating the functionality of a mechanical control panel. Kieras and Bovair (1984) showed that a lesson using this schematic to teach how equipment worked resulted in faster and more accurate job performance compared with lessons that taught only the procedures. The schematic helped learners build a mental model of how the equipment functioned. This mental model then supported more efficient use of the equipment and better troubleshooting.
Throughout the book we will summarize research that supports the use of these functional categories of visuals for specific instructional purposes. However, we anticipate that over time, additional studies will lead to updated guidelines. We offer this taxonomy as a starting point to help you plan graphics based on how they communicate your lesson content.
For learning to occur, all instructional methods including graphics must support several critical psychological events. These include:
Directing learner attention to important information in the lesson
Activating prior knowledge in memory
Managing cognitive load to free limited memory resources for learning
Building new or expanded mental models in memory
Supporting transfer of learning after the training event
Motivating learners to initiate and complete learning goals
Visuals that support one or more of these processes will improve learning. Conversely, visuals that disrupt one or more of these processes will depress learning.
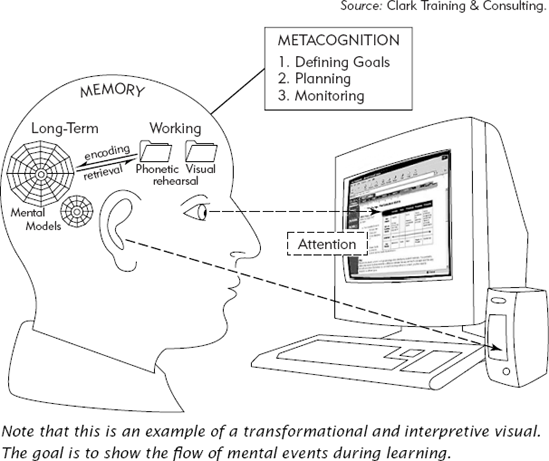
Learning is based on a transformation of new information from the environment into long-term memory as summarized in Figure 1.7. Two central memories are involved in this process: working memory and long-term memory. If attention is directed toward new incoming information, the information is stored in a visual and auditory storage area in working memory. Working memory is the center of human thought and active processing. Although it's a powerful processor, its storage capacity for information is quite limited. You may be familiar with the expression 7 plus or minus 2. This expression refers to the limits of working memory. Learning takes place when new content stored in the visual and in the phonetic components of working memory are integrated. First, the visual and phonetic information must be organized to form a cohesive idea. Then this idea must be integrated with activated prior knowledge from long-term memory. The outcome is an updated mental model stored in long-term memory.
Good instructional methods promote the processes that mediate the transformation of environmental information into new knowledge and skills in long-term memory. In Chapter Three we describe these events in greater detail.
Although we have stressed selecting visuals based on their communication and psychological functions, we cannot ignore the context in which those graphics will be displayed and used. The landscape of your instructional program and the placement of visuals in that landscape will be influenced by several factors including technological parameters such as bandwidth; pragmatic constraints such as budget and graphics resources; and even organizational standards and style guides for print and online designs. Therefore, we will discuss how decisions about graphics are influenced by other components of your instructional program such as requirements and conventions for on-screen text, narrated words, and screen design. All of these components make up an instructional context. Your selection of graphics will shape and be shaped by this overall context.
There are currently few universal guidelines for the use of graphics that are applicable for all learning purposes and for all learners. However, we make our recommendations throughout the book based on three assumptions regarding best design and selection of graphics.
First we emphasize selection and design of graphics based on their communication and psychological functions—not as commonly done, solely on their surface features. To guide you toward the communication and psychological functions of graphics, we will refer to categories from all three views of graphics summarized in Table 1.2. These taxonomies will provide you with an expanded way to think about and invest resources in graphics that will provide the most cost-effective outcomes for your instructional goals. We recommend that you make a copy of the tables in this chapter from our CD-ROM to use as a convenient memory aid as you read the book.
Second, we draw our recommendations from research evidence. We believe that the training and human performance field is moving toward a professional practice in which decisions will be based on scientific evidence as well as on pragmatic, technical, and political factors. Throughout the book we summarize what recent research tells us about how best to use visuals to support learning processes and communicate information needed to teach lesson content.
Most of the research we include is recent and drawn from experimental studies conducted with adult learners. In an experimental study, a large group is randomly assigned to a control condition and a treatment condition. For example, twenty-five individuals are randomly assigned to read a lesson consisting of just text (the control group) and another twenty-five are assigned to read the same lesson with graphics added (the treatment group). The random assignment of a large number of individuals to the control and experimental groups ensures that individual differences such as specific interests or abilities are evenly distributed between control and treatment groups and thus are not a factor in the results. After completing the lesson assignment, the subjects are tested. For the most part we have reported transfer test results rather than memory test results. That's because workers in organizations must be able to apply information—not just memorize it—and therefore application tests are more relevant to the instructional goals of organizations.
Keep in mind that most of the research we report has been conducted with college-age subjects. Although research on the impact of visuals on children's learning does exist, for the most part, we have excluded it. Also most of the graphic treatments used in the research studies are quite simple—often just line drawings like the ones illustrated in Figure 1.2A. and B. Because research that showed that different surface features for example—animated versus static versions—did not affect learning outcomes, we feel confident in making generalizations about graphics based on the visuals used in these studies. Naturally we will need to update our guidelines in the future based on emerging research.
Third, we recognize that decisions about graphics cannot be made independently of the entire instructional context. The selection or design of graphics is influenced by decisions regarding whether words will be included and in what format, for example, text or audio, and the delivery medium such as computers or books. Likewise pragmatic factors including project deadlines and budgets will influence visual treatments. In Section Four of this book we summarize a systematic process for design of graphics as part of an instructional landscape that must factor in these types of variables.
If you are responsible for planning or designing visuals for an instructional product—whether on your own or as part of a production team—you will be interested in Chapter Two. Here we overview a graphics design model that summarizes the various stages needed to plan and design visuals for instructional products. This model is expanded in Section Four. If you are not involved in the production of visuals, you may want to bypass Chapter Two and move to either Sections Two or Three that provide guidelines for selection of visuals based on their psychological functionality (Section Two) and on the content included in the lesson (Section Three).
Carney, R.N., and Levin, J.R. (2002). "Pictorial Illustrations Still Improve Students' Learning fromText." Educational Psychology Review, 14 (1), 5–26.
Rossett, A. (1999). First Things Fast: A Handbook for Performance Analysis. San Francisco: Pfeiffer.
CHAPTER OUTLINE
What Can Happen Without a Systematic Approach
What Happens When Instructional Designers Follow a Systematic Process
A Visual Design Model
Define the Goal
Define the Visual Context
Design the Visual Approach
Identify Communication Function of Visuals to Match Content Types
Apply Principles of Psychological Instructional Events to Visual