
Understanding how sound works (within an enclosed space) helps determine how to design recording studios properly. You pick up the best speakers you can afford—special amplifiers—all made specifically for recording studio environments, all designed to avoid adding color to your mix. Then you place them inside a room that colors the sound anyway. Room modes can lead to uneven levels in frequency and longer sound decays than normal. In a critical listening room, like the control room in your studio, you need to hear exactly what’s coming out of those speakers. You don’t want to have the levels affected by anything other than how you set them on the board. But the room you’re in can do just that—make some notes louder, some softer, and some go away completely. Understanding what causes this discrepancy, and how to avoid it (or at least minimize the problem), is an important part of designing a room in which you will enjoy working. Let’s look at how all of this works together.
All frequencies act in waves; however, lower frequencies tend to be less directional than higher frequencies. If you think about your setup on a stage, you’ll see that this is true. No matter where you are on the stage, including sitting behind a set of drums, you can feel the bass even if you don’t hear it. That’s because the bass frequencies get into the stage (the building), and they envelop everything around them.
But unless you have monitors, you won’t be able to hear the vocals, the keyboard, or the lead guitar. The drummer especially suffers from this problem. Let’s look at how this affects you in a room and take a brief look at sound itself.
Music is made up of a series of tones (frequencies) that contain amplitude (volume). There is a third variable, velocity (the speed of sound), but for the purposes of small rooms and this book, we won’t worry about calculating this. I say “calculating” because the speed of sound is not a constant thing, it changes (quite drastically) with variations in temperature, humidity, barometric pressure, and elevation, all of which are conditions that exist in relation to your room. In this book, we will just use the conventional speed of 1,130fps (feet per second) for any calculations we might make.
Amplitude refers to the difference between the maximum and minimum pressures within a soundwave. Pressure fluctuations in these waves are symmetrical about the current atmospheric pressure. In order to keep things simple, we will use a reference value of zero and show maximum pressure as a positive value above zero and the minimum pressure as a negative value (see Figure 2.1).
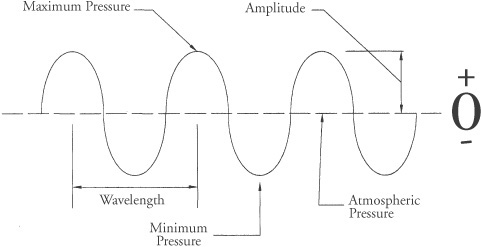
Frequency refers to the number of waves (pressure peaks) that travel a distance in one second. For example, low E on a four-string bass is 41.2Hz (based on A440 tuning) and thus has 41.2 waves traveling 1,130 feet in one second, while a 1kHz (1,000Hz) sound would have 1,000 waves traveling at 1,130 feet in that same second.
Wavelength refers to the physical distance between successive pressure maxima and is thus dependent on the speed of sound in the medium divided by the frequency of the wave. The equation for this is:
λ=V/f[1]
Where:
λ = wavelength (feet)
V = velocity (speed of sound)
f = frequency (Hz)
Thus, the 41.2Hz frequency has a wavelength (distance between peaks) of 27.43 feet (8.37m) rounded to two decimal places 1,130/41.2 = 27.427, while a 1kHz frequency has a wavelength of 1.13 feet (0.344m) 1,130/1,000 = 1.13.
Every room, including even the most professional studio, has what are called “room modes.” Let’s begin with an understanding of what our real concern is here, which is frequencies from 200Hz and below. (I know Everest[2] says 300, but I think 200 is a more reasonable cutoff, since this is roughly G below middle C—certainly a midrange note in my book—and frequencies above this can easily be absorbed with fiberglass.) For now, let’s walk through what creates room problems acoustically. We’ll deal with how to treat them in Chapter 10, “Putting It All Together.”
A room mode is created by a room dimension coinciding with a particular frequency’s distance of travel. This sounds quite simple, but in reality gets a little more involved if you are really going to understand it. All rooms have a unique distribution of low frequency standing waves, also known as modes. Modes are resonances of a room governed directly by the dimensions of a room. The math for figuring out the modes of a room is[3]:
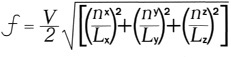
Where:
f = resonant frequency in Hz
V = 1130 ft/sec or 344 m/s (speed of sound in air)
nx, ny, nz = room mode numbers ≥ 0
Lx, Ly, Lz = room dimensions in ft or m
The reason you need to know this is due to what can happen when room dimensions are the same as wavelengths (also ½ wavelengths, ¼ wavelengths, etc.). As mentioned previously, one of the goals of recording is to capture the song being played as truly as you possibly can. Once this is completed, you want to mix the final product down, while hearing the mix reflect exactly what is coming out of the speakers on your system (hopefully, an accurate reproduction of what you recorded). Room modes can affect the amplitude (volume) (see Figure 2.1) of a note by increasing or decreasing it.
This phenomenon occurs when a room dimension coincides with the wavelength and the distance of travel is not great enough to allow the wave to decay naturally to the point that the incidence of it crossing itself (head-on) is neither constructive nor destructive.
A constructive action boosts the amplitude of a wave, while a destructive action reduces that amplitude. Destructive areas within a wave are referred to as nodes. Nodes are areas where the sound decreases in amplitude. Constructive areas are referred to as antinodes. Antinodes are found between nodes and are the locations where the sound increases in amplitude. All of this becomes more problematic the smaller and more reverberant the room is. A room that is dead (anechoic) will suffer this to a lesser degree. However, due to the fact that it will have no natural reverb or life within it, it will end up being a very boring room.
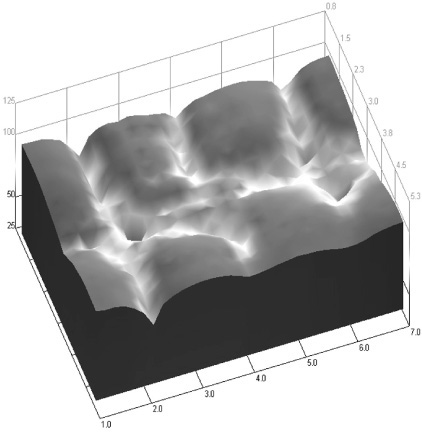
When a tangential mode is excited in a room, the resonant standing wave is “set up” and the resulting pressure distribution will be similar to that shown in Figure 2.2. The dark gray shades in the contour in Figure 2.2 are areas where sound pressure is at a maximum. The lighter areas in the “troughs” of the contour are areas of minimum pressure. This contour would correlate directly to what is heard when this particular room is excited by a frequency near the {3,1,0} tangential mode. In the case of this room, the dimensions are roughly 6m x 4m x 2.8m, and the frequency in question is roughly 96Hz. This response is dependent on the location of the loudspeakers. The loudspeakers for this model were placed very near a wall. If the speakers were located in or near the “trough” areas (nodes) instead, the darker areas (antinodes) would not be nearly as “hot” with sound energy because the loudspeaker would be unable to excite this particular mode. Likewise, if listeners were seated in or near the “trough” areas, their perception would be that the bass in the 96Hz range was “thin” or somehow lacking. The frequency in Figure 2.2 roughly corresponds to G2 on the musical scale, or G an octave and a half below middle C. Mixing songs where this note is played frequently by a guitarist or bassist (in a room with these dimensions) may sound “thin.” Not knowing that this is a room problem, the person mixing may overcompensate by boosting the low-frequency EQ in this range. Consequently, the mix would not translate well, and it would probably sound “muddy” or even distorted on the low end when played back on another system.
Let’s back up and look at our 41.2Hz example for a moment. The wavelength is 27.43. If the room length, width, or height is that same dimension, the sound pressure within the room will create a standing wave. If the listener were walking around the room, there would be a series of peaks (antin-odes) and nulls (nodes), which would correspond to the wave itself. Depending on the position of the listener in relation to the wavelength, he might hear a peak, null or normal amplitude in the tone.
Where this begins to get a little more involved (like we needed that) is that frequencies that are harmonics of a prime frequency related to a room dimension can also be excited. Any whole number multiple of the frequency will also be a problem. So if 55Hz is a problem, then 110 is a problem, 165, 220, 275, etc. This corresponds to ½ of the room length, ⅓ of the room length, ¼ of the room length, ⅕ of the room length, and so on.
By the same token, constructing a room with a dimension of 13.72′ (½ of the room dimension above) will provide exactly the right conditions for all of those frequencies to still get excited, causing the same problem.
If you haven’t thought about all of this before now, you’re probably wondering why any of this matters to you. The answer is that standing waves, or any wave that acts like a standing wave (more on that in a moment), can affect the amount of a particular frequency that you add (or subtract) during mix-down, due to the fact that it sounds louder or softer than it really is in the mix. It can also cause various musical parts of an instrument being played to vary in amplitude, if you used a room mic for ambiance.
One of the ways of attempting to deal with this problem when recording in small rooms is to close mic the instrument or amplifier. When doing this, you can lower instrument volumes, which at least helps to take some of the room out of the equation. However, if your mic sits in a null, nothing can help you capture a note that isn’t heard. However, in the control room, you do not have that option. In the control room, you generally want to lie back, set your mix levels, and generate the sound you would hear if you took this to another room to play it back. You could always wear headphones (to take the control room out of the equation), but this is not the preferred method of mixing down a recording.
On the issue of headphone use: Although you can use them, they become awkward to work with for any real length of time. Also, they do not really represent a listening area. By this I mean that a good listening room brings a sense of spaciousness into the listening experience, and even the average listening room creates a feel that cannot be duplicated with headphones. It is, however, not necessarily a bad idea to check your mix with them occasionally. It gives you another tool in your arsenal to see how your mix will translate in the real world, but that is a world of difference from working with them exclusively.
Suppose for a moment that your listening position is in a location where that same E (41.2Hz) we’ve been discussing here has a peak of 6dB. (We’ll look at exactly how we get this 6dB peak in a moment.) Because the room is artificially amplifying this sound in your mixing spot, you would naturally lower the levels until the mix sounded right. But when you walked out of that room and began to play this in another location—one that this phenomenon did not exist in—you would suddenly find that your mix had holes in it where the bass belonged. For example, a 6dB cut would sound like the bottom just fell out. In reverse, should you be sitting in a null, the mix would end up being bass heavy because you would compensate for it by boosting that frequency. The design goal for a mixing room is to be able to hear exactly what’s coming out of your speakers without the room affecting the outcome.
Now to understand this all in greater depth, compare a mode to a series of colliding balls, also known as Newton’s Cradle (see Figure 2.3). We’ve all seen this one time or another in various forms.
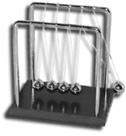
It’s a case of an outer ball (or multiple of balls) being swung so that it impacts an adjacent ball—with the result being an equal number of balls on the opposite side being propelled at (apparently) the same speed and distance—with this repeating from side-to-side once set into motion. The balls in the middle never seem to move. They are actually being placed in a state of compression, transferring this energy to an adjacent ball, at which point they are in a state of rest until they are again compressed and do the same in reverse.
Now picture a wall sitting on either side of those central balls—with the walls moving in and out (to impart the energy), instead of having those outside balls in motion. To the viewer (in either case), those balls in the middle don’t move.
If you could physically see the excited mode of a room, you would be amazed to see virtually the same thing. The wave doesn’t move—it just sits there and grows in level.
In the case of the balls, you have impact, compression, transfer of energy, and then a period of rest. In the case of the room mode, you have a spring effect, thus you have compression, tension, compression, tension, with no point of rest.
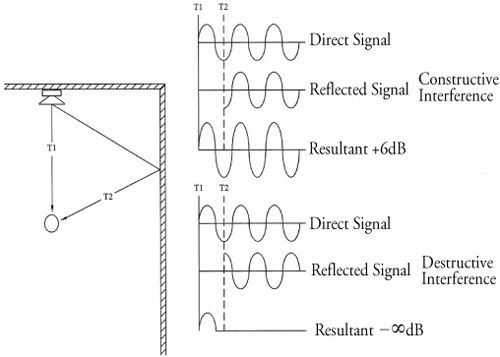
With sound then, you have a source point sending a soundwave, which strikes a boundary, and the signal is returned toward the source. While this is taking place—at the exact point in time as the original signal is being returned—a second wave is being sent from the original source location. They meet in the middle of the room and pass one another. We now have two waves passing in opposite directions from one another—perfectly in sync. This is the point where the wave becomes standing. The points of pressure and velocity become essentially locked in place and do not move. They simply begin to build within the space.
At the initial intersection of one another, the amplitude is increased or decreased by 6dB, depending on the particular location of the listener within the space. But if the duration of the tone generated is long enough, this can grow quite dramatically. It isn’t unusual during room testing to see peaks and dips greater than 20dB.
OK, before you say anything, let me clarify. “This would be the case if the speaker were perfectly flush with the face of the wall. But if it isn’t, how would this still work?” (You were thinking that, weren’t you?) Remember when I said earlier that bass frequencies traveled in waves? I explained that they permeate that which is around them. For example, they build up within a space similar to the way waves spread out in a pond when you throw a rock into the water. So, even if the speakers aren’t at the edge of the room, soundwaves can still create a standing wave by exciting a room mode. It doesn’t matter whether the completion of the cycle occurs at the edge of the room or 1′ from that edge. When a soundwave meets itself head on, it will create a standing wave. I do want to point out to you that a mode is able to be excited to a greater extent from the room boundaries, and because of this, you can minimize the level of this phenomenon by proper speaker placement. However, regardless of the source of a wave, if its dimension relates to a room dimension, it can generate a standing wave.
Although technically only a room mode creates a standing wave, I like to use the term non-modal waves to describe a phenomenon that is similar to a room mode but has different causes. Whereas a standing wave is related directly to room dimensions, non-modal waves can be related to the distance of a speaker to a surface, an instrument to a surface, and so on. Let’s look at a few examples of non-modal standing waves.
Back wall interference (reflections off the wall behind the listener) is probably as significant an issue as modal standing waves. In this case, where the listener is located, between the speaker and the interfering boundary, becomes important. As the listener moves forward and backward, he will hear peaks/dips at different frequencies. In this case, as the listener moves forward in the room, the effect of this interference on the various frequencies will become less apparent. When we look at room design, we will examine speaker placement and seating positions to minimize this problem.
So, now we have room modes, nodes, antinodes, non-modal standing waves, speaker placement, listener location—and all of these are problematic issues to contend with. Could it get any more challenging?
Yes, it could, and it does. In addition to all of this, you can have nulls created by something called “speaker boundary interference response.”
SBIR (speaker boundary interference response) is the coupling of the listener and the loudspeakers to reflections from surfaces adjacent to the speaker. (The speaker is sitting between the boundary and the listener, in this case.) This problem again exists primarily with (but is not necessarily limited to) low frequencies. It is a combination of the interference (both constructive and destructive) from the loudspeaker’s direct sound and reflections from the room boundaries that can cause severe peaks and nulls. When a sound is transmitted from a speaker, the waves reflect off a nearby surface and the reflected wave is coupled with the direct wave. Treatments between the speaker and the problem surface can generally deal with this.
You also have reflected sounds that can destroy the stereo imagery of your recording. Although these effects are easier to deal with than the modal issues that plague small rooms, they will have to be dealt with nonetheless.
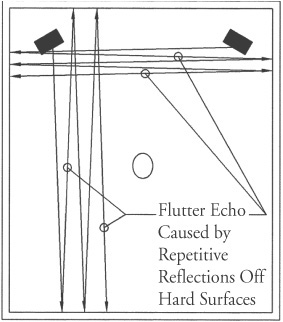
Flutter echo is a distinctive ringing sound caused by echoes bouncing back and forth between hard, parallel surfaces, following a percussive sound, such as a handclap.
To minimize flutter echoes, which can plague even a studio having a perfect RT60 across the band, certain precautions can be taken. If you’re building from scratch, facing walls can be constructed out of parallel by at least 1 in 10 (6%), but if this isn’t possible, some form of mid/high absorber can be applied to one or both walls to reduce the problem. Figure 2.4 indicates causes of flutter echo.
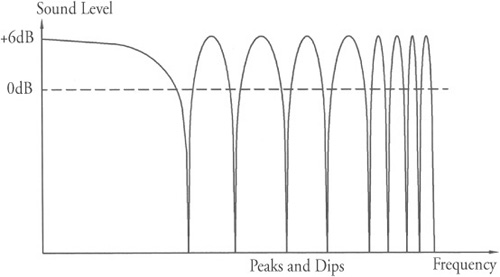
Another form of acoustic distortion introduced by room reflections is comb filtering. Comb filtering occurs due to interferences that exist between a direct sound and the reflected sound from the same source. In control rooms, you are primarily concerned with the interaction between direct sounds and their first-order (i.e., single-bounce) reflections. These reflections cause time delays because the reflected path length between your ear and the source is longer than the direct sound path. Thus, when the direct sound is combined with the reflected sound, you’ll experience notching and peaks, referred to as comb filtering. The term “comb filtering” comes from the plot that this data provides, which resembles a comb. Figure 2.5 indicates the cause of comb filtering. Figure 2.6 is a graphical representation of the comb-filtering effect.
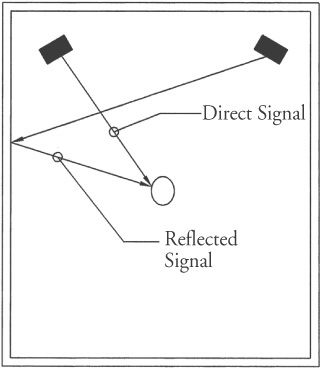
You can also have the stereo image destroyed by early reflections from the wrong speaker. This takes place when a sound from one speaker bounces off a sidewall and enters the ear a split second after the direct sound from that ear’s speaker. Because the delay is only a split second, the mind does not differentiate between the two sources. It tricks the brain into believing the sound came from the speaker located on that side of the room. This occurrence destroys proper stereo imaging. For example, your left ear believes that it hears (from the left speaker) sounds that are actually emanating from the right speaker, which makes it impossible for you to properly mix a true stereo image of your recording. Figure 2.7 shows you the cause of this early reflection issue.
Because of the fact that this problem exists within the mid- to high-frequency range, it is another quirk that can be handled fairly easy. You will treat this by creating a reflection-free zone within the room.
“Rod, I used one of the ‘best’ room modes to design my room, I paid attention to detail, everything is constructed, and I ran a test on my room, but the modes are not what were predicted with mode analysis. What did I do wrong?”
It is very possible that you could design a room properly, completely test it after construction, never make a mistake, and yet have different results with modal behavior than you expected, based on an analysis with a room mode calculator.
I have never seen this situation completely explained anywhere, but when I think about it, at least one contributing factor comes to mind. Keep in mind that this is my own conclusion based on my understanding of this subject, and it has not been proven by any tests I know of to date. But the conclusion is perfectly logical to me, so I offer it for your consideration. At some point in time, I am going to have to develop a construction model for this and have it tested.
I believe that part of the reason for this is due to the fact that a modal analysis of any space makes certain assumptions of that space. One is that the room is rectangular in shape. Another is that the modal boundaries are an infinitely rigid dense material that sound is incapable of escaping from. Although the math works from the perspective of calculating the effects (if these infinitely dense walls really existed in your room) in the vast majority of cases, this is not anywhere near reality, especially with small home studios.
We all construct walls from which sound escapes. In fact, we might build a wall that has a center frequency, which allows sound at that frequency to strike a boundary directly on the other side of the wall and then re-enter the room through that same wall.
Let’s take a look at a basement studio for a moment. Suppose that you have a basement with a wall-to-wall dimension of 36′ 7⅜″. Within this space, you construct a “room within a room” studio, with the walls 1” clear from the face of foundation wall, 2x4 construction with drywall over that, and when completed the walls have a center frequency of 30.87Hz (which just happens to coincide with the low B string on a five-string bass guitar). In this case, a note from that B string would pass through the wall “like a hot knife going through butter” and be reflected off the outer boundary back into the room. Because your concrete walls are 36′ 7⅜″ from one another, which coincides with the wavelength of that B string, you could have a room mode you can’t account for if you base the mode analysis strictly on the room itself.
Now understand, I am not suggesting that you ignore room modes during design, nor am I suggesting that an analysis of room modes never makes sense. Nothing could be farther from the truth. I am simply explaining that there is much more to this than analysis, math, and acoustic theories because when it comes to the predictive models in the acoustic world, things once constructed do not always behave exactly as predicted. Testing after the fact is always required to verify the treatments you will require within the space.
This is one of the reasons that many thousands of dollars are spent testing isolating assemblies, room treatments, etc. The math involved is a good thing because it gives you a fairly good idea of whether you’re headed in the right direction. However, the only way you can ever know with any degree of certainty whether your predictions were correct or not is to perform tests. So begin with the best you can, build it the best that can be built, and then test for actual conditions before you begin any room treatments.
By the way, all of this becomes more problematic the smaller the room is. Modal activity in relatively large rooms might be small in nature due to the natural decay rate of waves. As rooms become smaller, the amplitude of the wave has less decay time during its travel and thus exhibits greater constructive/destructive interference. Let’s look at these rooms a little more closely.
For home studios, I would describe large rooms as rooms with minimum lengths of around 30′, widths of around 20′, and average room heights of not less than 12′″or combinations thereof equaling greater than 5,000c.f. (cubic feet). In large rooms, there is generally enough travel distance so that sound has a chance to decay to the point that constructive/destructive actions in the room will begin to be minimized. What effect there is, ends up being fairly easy to manage from a treatment point of view. In addition, large rooms have the advantage of being able to institute designs, including splayed walls, which, if the splay is large enough, can create a modal zone that spans multiple frequencies in any given wall dimension. You can construct a room with acoustic qualities rivaling most professional studios if you can provide this much volume in your room.
Medium-sized rooms—and by this I mean rooms of 2,000 to 5,000c.f. in size—tend to exhibit more modal activities, but are generally large enough that some care can be taken to alleviate problems relating to modes without having to go to extremes.
Small rooms, however, (rooms less than 2,000c.f. in size) become more and more problematic as you decrease the room area. And in some small rooms, there can be dimensions that cause even more problems than you might expect.
Occasionally, I have people come and ask how to deal with rooms that are cubed dimensionally, for example, 8x8x8 or 103. I tell them that these rooms are to be avoided like the plague. Not only are they small in area (512c.f. to 1,000c.f.), but they also have exactly the same modes in all three dimensions—a modal nightmare that will drive you crazy. The only advice I can give them if they can’t make physical changes to the room dimensions is to either find a new room or make the room completely dead.
You should know that there are also problems inherent with making rooms completely dead. The first is a matter of human comfort. We are not accustomed to existing in a space that is without any amount of reverb, and thus we tend to tire quite quickly when confronted with working in this environment. The next problem is that one tends to overcompensate for the lack of natural reverb by adding too much artificial reverb into the mix. Having said that, I would like to clarify one thing: you can learn to compensate for a lack of natural reverb.
You can learn to compensate for a mode, non-modal standing waves, and any other acoustic anomaly that might exist in a room. If you truly pay attention to what is going on in your mix and learn your room, you can make the adjustments necessary to mix right, even if your room is wrong. It’s been done before, and some real great music has come out of some really bad rooms. But, if you do this as a hobby—for example, if you don’t do this day in and day out—you may never really “get it,” and even if you do, it will still never sound “perfect” to you while you’re in the room, even if it sounds great when you finally play it outside. Besides, that all sounds (to me) like a little bit too much work, and I don’t know about you, but I do this for fun. It’s better if we can make rooms that minimize these problems. (Even if I did it for a living, I would want to enjoy the experience.)
All of our work so far has been to focus on sound moving side-to-side, front-to-back, or top-to-bottom. However, this is only one type of room mode. There are actually three types of room modes: axial modes, tangential modes, and oblique modes.
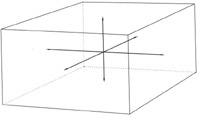
The first mode is the axial mode, which is exactly the concept we were discussing earlier. This mode is based on the simple dimensions of walls opposite one another and the dimension of the floor to ceiling.
Take a look at Figure 2.8, which is an example of axial modes in a simple rectangular room. The mode is created by reflections between two opposite surfaces. Understand that this is not an either/or situation. You will have modal activity from all of these surfaces. That’s why it’s so important to make certain that your room ratios are such that they reinforce modes in multiple directions.
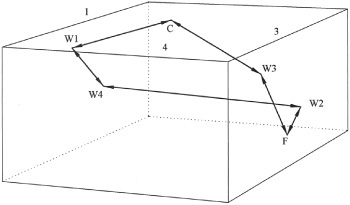
Tangential modes are formed by the relationship of any four surfaces within a room. When the travel distance formed by the four surfaces coincides with a frequency wavelength, the tangential mode can become excited. Tangential modes require two times the power of an axial mode to produce the same change in amplitude (pressure level). In Figure 2.9, you can see an example of a tangential mode in a rectangular room. In this case, you see one modal activity in play (for clarity’s sake), which includes only the four walls, but it could just as easily be any two walls with the ceiling and floor in play as well.

Oblique modes are formed by the relationship of all six surfaces within the room. When a travel distance formed by these six surfaces coincides with a frequency wavelength, the oblique mode can become excited. Oblique modes require four times the power of an axial mode to produce the same change in amplitude (sound pressure).
Figure 2.10 indicates the sound travel required to produce an oblique mode. As shown, this mode becomes excited when the travel of the sound takes all six surfaces into account. Because of the power requirements of this mode in relation to an axial mode, this will generally create much less interference— even in small rooms—than either axial or tangential modes.
Figures 2.8 through 2.10 are simplified, to say the least. They are intended to help you understand the manner in which these modes work, but they are also slightly deceptive because they paint a picture of a very tight soundwave. A laser beam, with properly placed mirrors, would travel as shown above, but soundwaves are not that directional, especially low-frequency (LF) soundwaves. As discussed in the beginning of this chapter, LF waves are very broad and tend to permeate the room. Thus, although ray tracing (as shown above) can help to understand how this works, in general, it is not really representative of LF modal behavior.
In properly designed large- and medium-sized rooms, I do not become overly concerned with oblique and tangential modes. Because mixing is generally done around 85dB (this is about the maximum sound level that can be used without tiring one’s self out quickly), the decay rate of the sound should allow for very little amplitude interference. This is due to the distance of travel within the space. Treatment of any interference that exists is relatively easy to handle. But small rooms are a different story. In small rooms, I would recommend that any modal analysis include all three modes.
For the purposes of small room design, there have been numerous studies of the effects that room ratios have in relation to modal activity. Next, we will look at some of the outcomes of those studies.
In order to design rooms in which these types of problems can be minimized, a series of ratios have been established over the years specifically for small room designs.
Some of the more popular ratios are as follows:
(In all cases, 1 is equal to ceiling height, and walls are represented as a ratio relating to the ceiling height; thus, Height × Width × Length.)
W | L | ||
L. W. Sepmeyer:[4] | 1: | 1.14: | 1.39 |
1: | 1.28: | 1.54 | |
1: | 1.60: | 2.33 | |
M. M. Louden:[5] | 1: | 1.40: | 1.90 |
1: | 1.30: | 1.90 | |
1: | 1.50: | 2.10 |
Please note that the orders listed above are (top to bottom) the first to third best ratios in both cases. There are many other ratios that can be found, but the listed “first best” by both Sepmeyer and Louden are two of the more widely used in professional studios worldwide.
I want to touch on the subject of mode calculators for a moment. There are literally hundreds of these on the Internet. Some are much better than others. Personally, I don’t use them. The reality is (especially in small rooms) that in the end you are going to have to treat your room to make it right. If you use known room ratios to begin with, then you are that much ahead of the game. If you do not have the space to do that—for example, if you have such a small space that you just can’t afford to give up any real-estate to make these adjustments—then just build your room and deal with what treatments you have to in the end. Although running a mode calculator is easy, understanding it is altogether different. You could be building your room for a long time before you figure out what it’s about.
However, should you decide to get into it and calculate room modes beforehand, don’t get nervous if you use the ratios listed here (or some other of the famous room ratios) when you check your room modes. Because when you do, you’ll see a lot of excited modes. This is to be expected for small rooms. One of the things that makes these rooms work is that when you have enough modes excited, things tend to smooth out. If you could create a room (for example) in which all frequencies were modes—and all were excited equally—then for all intents and purpose, the modes would not exist.
To make it easier for you to identify frequencies with distance, I have included a frequency chart in the following pages.
These tables were created using A4 = 440Hz
Speed of sound = 1130ft/s
(“Middle C” is C4)
Note | Frequency (Hz) | Wavelength (cm) | Wavelength (ft) |
|---|---|---|---|
CO | 16.35 | 2100 | 69.11 |
C#0/DbO | 17.32 | 1990 | 65.24 |
DO | 18.35 | 1870 | 61.58 |
D#0/EbO | 19.45 | 1770 | 58.10 |
EO | 20.6 | 1670 | 54.85 |
FO | 21.83 | 1580 | 51.76 |
F#0/GbO | 23.12 | 1490 | 48.88 |
GO | 24.5 | 1400 | 46.12 |
G#0/AbO | 25.96 | 1320 | 43.53 |
AO | 27.5 | 1250 | 41.09 |
A#0/BbO | 29.14 | 1180 | 38.78 |
BO | 30.87 | 1110 | 36.61 |
C1 | 32.7 | 1050 | 34.56 |
C#1/Db1 | 34.65 | 996 | 32.61 |
D1 | 36.71 | 940 | 30.78 |
D#1/Eb1 | 38.89 | 887 | 29.06 |
E1 | 41.2 | 837 | 27.43 |
F1 | 43.65 | 790 | 25.89 |
F#1/Gb1 | 46.25 | 746 | 24.43 |
G1 | 49 | 704 | 23.06 |
G#1/Ab1 | 51.91 | 665 | 21.77 |
A1 | 55 | 627 | 20.55 |
A#1/Bb1 | 58.27 | 592 | 19.39 |
B1 | 61.74 | 559 | 18.30 |
C2 | 65.41 | 527 | 17.28 |
C#2/Db2 | 69.3 | 498 | 16.31 |
D2 | 73.42 | 470 | 15.39 |
D#2/Eb2 | 77.78 | 444 | 14.53 |
E2 | 82.41 | 419 | 13.71 |
F2 | 87.31 | 395 | 12.94 |
F#2/Gb2 | 92.5 | 373 | 12.22 |
G2 | 98 | 352 | 11.53 |
G#2/Ab2 | 103.83 | 332 | 10.88 |
A2 | 110 | 314 | 10.27 |
A#2/Bb2 | 116.54 | 296 | 9.70 |
B2 | 123.47 | 279 | 9.15 |
C3 | 130.81 | 264 | 8.64 |
C#3/Db3 | 138.59 | 249 | 8.15 |
D3 | 146.83 | 235 | 7.70 |
D#3/Eb3 | 155.56 | 222 | 7.26 |
E3 | 164.81 | 209 | 6.86 |
F3 | 174.61 | 198 | 6.47 |
F#3/Gb3 | 185 | 186 | 6.11 |
G3 | 196 | 176 | 5.77 |
G#3/Ab3 | 207.65 | 166 | 5.44 |
A3 | 220 | 157 | 5.14 |
A#3/Bb3 | 233.08 | 148 | 4.85 |
B3 | 246.94 | 140 | 4.58 |
C4 | 261.63 | 132 | 4.32 |
C#4/Db4 | 277.18 | 124 | 4.08 |
D4 | 293.66 | 117 | 3.85 |
D#4/Eb4 | 311.13 | 111 | 3.63 |
E4 | 329.63 | 105 | 3.43 |
F4 | 349.23 | 98.8 | 3.24 |
F#4/Gb4 | 369.99 | 93.2 | 3.05 |
G4 | 392 | 88 | 2.88 |
G#4/Ab4 | 415.3 | 83.1 | 2.72 |
A4 | 440 | 78.4 | 2.57 |
A#4/Bb4 | 466.16 | 74 | 2.42 |
B4 | 493.88 | 69.9 | 2.29 |
C5 | 523.25 | 65.9 | 2.16 |
C#5/Db5 | 554.37 | 62.2 | 2.04 |
D5 | 587.33 | 58.7 | 1.92 |
D#5/Eb5 | 622.25 | 55.4 | 1.82 |
E5 | 659.26 | 52.3 | 1.71 |
F5 | 698.46 | 49.4 | 1.62 |
F#5/Gb5 | 739.99 | 46.6 | 1.53 |
G5 | 783.99 | 44 | 1.44 |
G#5/Ab5 | 830.61 | 41.5 | 1.36 |
A5 | 880 | 39.2 | 1.28 |
A#5/Bb5 | 932.33 | 37 | 1.21 |
B5 | 987.77 | 34.9 | 1.14 |
C6 | 1046.5 | 33 | 1.08 |
C#6/Db6 | 1108.73 | 31.1 | 1.02 |
D6 | 1174.66 | 29.4 | 0.96 |
D#6/Eb6 | 1244.51 | 27.7 | 0.91 |
E6 | 1318.51 | 26.2 | 0.86 |
F6 | 1396.91 | 24.7 | 0.81 |
F#6/Gb6 | 1479.98 | 23.3 | 0.76 |
G6 | 1567.98 | 22 | 0.72 |
G#6/Ab6 | 1661.22 | 20.8 | 0.68 |
A6 | 1760 | 19.6 | 0.64 |
A#6/Bb6 | 1864.66 | 18.5 | 0.61 |
B6 | 1975.53 | 17.5 | 0.57 |
C7 | 2093 | 16.5 | 0.54 |
C#7/Db7 | 2217.46 | 15.6 | 0.51 |
D7 | 2349.32 | 14.7 | 0.48 |
D#7/Eb7 | 2489.02 | 13.9 | 0.45 |
E7 | 2637.02 | 13.1 | 0.43 |
F7 | 2793.83 | 12.3 | 0.40 |
F#7/Gb7 | 2959.96 | 11.7 | 0.38 |
G7 | 3135.96 | 11 | 0.36 |
G#7/Ab7 | 3322.44 | 10.4 | 0.34 |
A7 | 3520 | 9.8 | 0.32 |
A#7/Bb7 | 3729.31 | 9.3 | 0.30 |
B7 | 3951.07 | 8.7 | 0.29 |
C8 | 4186.01 | 8.2 | 0.27 |
C#8/Db8 | 4434.92 | 7.8 | 0.25 |
D8 | 4698.64 | 7.3 | 0.24 |
D#8/Eb8 | 4978.03 | 6.9 | 0.23 |
Now let’s head into the next chapter and learn a bit about sound-isolating construction techniques.