

Chapter 4. Administering EWLM 111
Figure 4-31 Managed server details report
Figure 4-32 Managed server details
4.4.3 Application and server topology reports
The application and server topology reports are built by EWLM dynamically following the flow
of your transaction or your process. The
application topology is the logical representation of
the application flow while the
server topology is the physical representation of which server
you application has been going through during its processing. You can obtain these reports
by selecting Application topology or Server topology from the pull-down menu and clicking
Go.
Following are samples of these reports.
112 IBM Enterprise Workload Manager
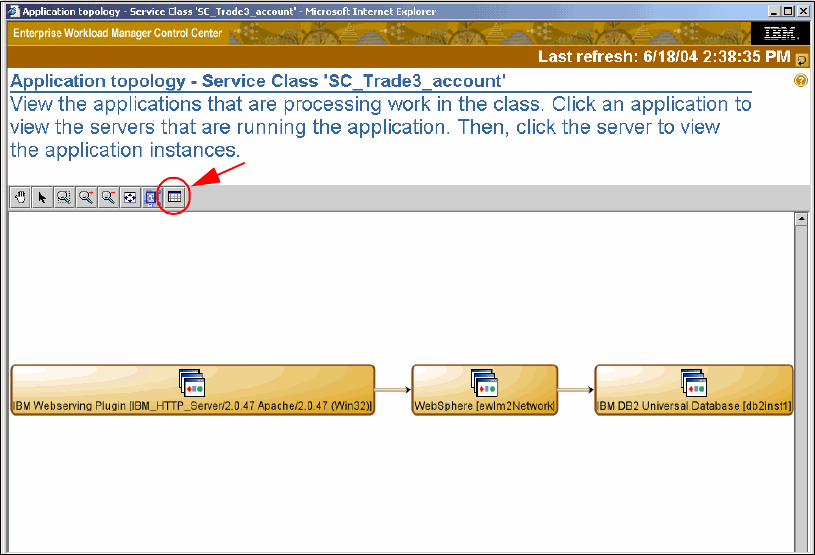
Application topology
Figure 4-33 is an example of the application topology graphic. EWLM, as it detects
instrumented data from the various applications, makes this graphic possible. The graphic on
the far left represents the “hop0” or edge server where the transactions originate. This is
where the end-to-end response time is measured and represents the round trip for the
transaction. Hop0 is the place where the EWLM classification takes place, and an ARM
correlator is assigned to the transaction and flows with the transaction through the
subsequent hops. So, what EWLM is mainly doing in the application topology is building a
logical view of your application showing all the middleware that your application’s flow is going
through from start to end. In order to have a complete topology view of your application all the
middleware elements must be ARM instrumented. If you click the logical view of the
application’s icon, you can zoom in on the physical server’s icon and furthermore, if you click
the server’s icon, you can see the application instances.
From the application topology, you can obtain an additional report called the Tableview by
clicking on the matrix icon as shown in Figure 4-33.
Figure 4-33 Application topology report
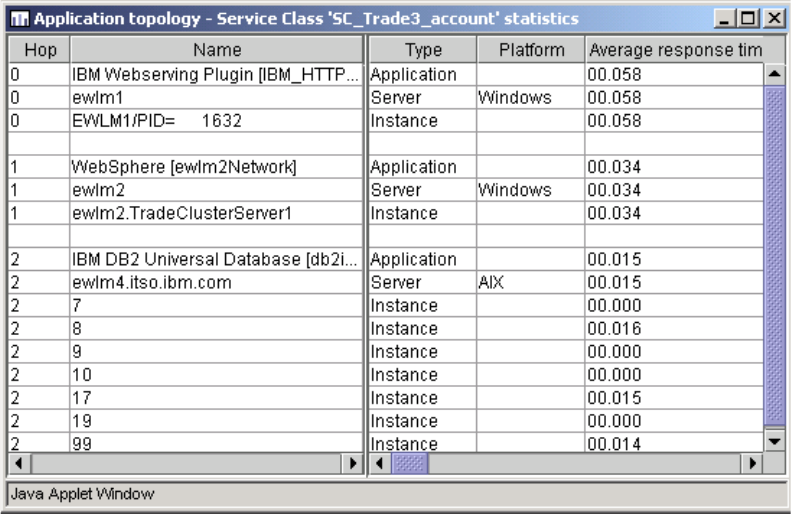
The example in Figure 4-34 is a partial view of the Topology tableview. The first column lists
the hops (0,1 and 2): these represent the individual segments where the transactions are
processed. Hop0 identifies the edge server that is the starting and end point for the
transactions, where the EWLM classification takes place. For each Hop, information is
provided at application, server, and each instance level. This makes the flow of the
transaction and where the time is being spent very apparent.
The data in the tableview is retained for a maximum of one hour.
The following information can be seen in the Tableview by scrolling to the right:
• Average response time
• Active time (seconds)
Table V iew
Chapter 4. Administering EWLM 113
• Processor time (microseconds)
• Processor delay %
• Processor using %
• Stopped transaction
• Failed transactions
• Successful transactions
• I/O delay %
• Page delay %
• Idle %
• Other %
• Topology uncertainly count
• Reporting gap count
• Hard page faults
• Queue time (milliseconds)
• Standard deviation
Figure 4-34 Tableview report
Server topology
Figure 4-35 is an example of a server topology report. If you click on a server icon, the ARM
instrumented middleware running on that server is displayed. The server to the left is
considered the “hop0” or edge server and is the server where the transaction is classified to
EWLM. The topology displayed here should be what you’d expect. If not, then there’s most
likely work that should be classified that was not known previously.
..................Content has been hidden....................
You can't read the all page of ebook, please click here login for view all page.