

Implementing a storage monitoring system
Monitoring in a storage environment is crucial and it is part of what usually is called storage governance.
With a robust and reliable storage monitoring system, you can save significant money and minimize pain in your operation, by monitoring and predicting utilization bottlenecks in your storage environment.
This chapter provides suggestions and the basic concepts of how to implement a storage monitoring system for IBM FlashSystem, using specific functions or external IBM Tools.
This chapter includes the following topics:
9.1 Generic monitoring
With IBM FlashSystem, you can implement generic monitoring using IBM FlashSystem-specific functions that are integrated with the product without adding external tools or cost.
9.1.1 Monitoring by using the GUI
The management GUI is the primary tool that is used to service your system. Regularly monitor the status of the system by using the management GUI. If you suspect a problem, use the management GUI first to diagnose and resolve the problem.
Use the views that are available in the management GUI to verify the status of the system, the hardware devices, the physical storage and the available volumes. The Events window provides access to all problems that exist on the system. Use the Recommended Actions filter to display the most important events that need to be resolved.
If a service error code exists for the alert, you can run a fix procedure that assists you in resolving the problem. These fix procedures analyze the system and provide more information about the problem. These actions also ensure that the required changes do not cause volumes to be inaccessible to the hosts and automatically perform configuration changes that are required to return the system to its optimum state.
If any interaction is required, they suggest actions to take and guide you through those actions that automatically manage the system where necessary. If the problem is fixed, the alert is excluded.
Call Home
Call Home connects your system to service representatives who can monitor issues and respond to problems efficiently and quickly to keep your system up and running. The Call Home feature transmits operational and event-related data to you and IBM through a Simple Mail Transfer Protocol (SMTP) server or cloud services connection through Representational State Transfer (RESTful) APIs.
The SMTP sends notifications through an email server to support to fix errors, to internal users or services that monitor activity on the system.
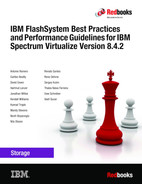
Multiple email addresses can be added to receive notifications from the storage. You also can set notification options for each email box that you added with different sets of information (see Figure 9-1).
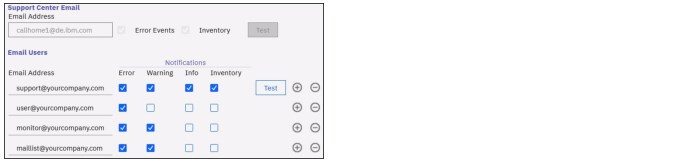
Figure 9-1 Email users
Representational State Transfer (RESTful) APIs transmitting data through web services. You can also specify an internal proxy server to manage outbound connections with the support center (see Figure 9-2).

Figure 9-2 Call Home with cloud services
From a monitoring perspective, email notification is one of the most common and important tools that you can use and set up. From the notification events, you can validate if your system is running under normal status or needs attention.
SNMP notification
Simple Network Management Protocol (SNMP) is a standard protocol for managing networks and exchanging messages. The system can send SNMP messages that notify personnel about an event. You can use an SNMP manager to view the SNMP messages that are sent by the IBM FlashSystem system.
The Management Information Base (MIB) file describes the format of the SNMP messages that are sent by IBM FlashSystem. Use the MIB file to configure a network management program to receive SNMP event notifications that are sent from an IBM FlashSystem system. This MIB file is suitable for use with SNMP messages from all versions of IBM FlashSystem.
For more information about IBM FlashSystem MIB file for 8.4.2 FlashSystem devices, see this IBM Support web page.
Syslog notification
The syslog protocol is a standard protocol for forwarding log messages from a sender to a receiver on an IP network. The IP network can be IPv4 or IPv6. The system can send Syslog messages that notify personnel about an event. You can configure a syslog server to receive log messages from various systems and store them in a central repository.
Figure 9-3 shows the new syslog grid layout from the IBM FlashSystem GUI. You can configure multiple syslog servers and monitor the communication between IBM FlashSystem to the syslog server from the syslog window.
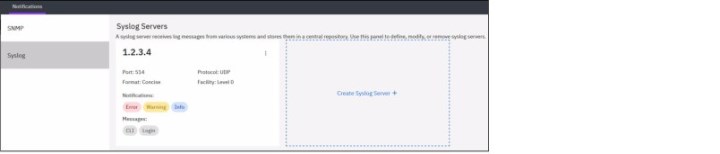
Figure 9-3 Syslog layout
|
Note: Starting with version 8.4, it is possible to use FQDN for services, such as Syslog, LDAP, and NTP.
|
9.1.2 Monitoring using quotas and alert
In an IBM Spectrum Virtualize system, the space use of storage pools and thin provisioned or compressed VDisks can be monitored by setting some specific quota alerts. These quota alerts can be defined in the management GUI and through the CLI.
Storage pool
At the storage pool level, an integer defines a threshold at which a warning is generated. The warning is generated the first time that the threshold is exceeded by the used disk capacity in the storage pool. The threshold can be specified with a percentage (see Figure 9-4) or size (see Example 9-1) value.

Figure 9-4 Pool threshold
Example 9-1 Threshold specified as a size
IBM_FlashSystem:FS9200:superuser>svctask chmdiskgrp -warning 1 -unit tb 3
VDisk
At the VDisk level, a warning is generated when the used disk capacity on the thin-provisioned or compressed copy first exceeds the specified threshold. The threshold can be specified with a percentage (see Figure 9-5) or size (see Example 9-2) value.

Figure 9-5 VDisk threshold
Example 9-2 Threshold specified as a value
IBM_FlashSystem:FS9200:superuser>svctask chvdisk -copy 0 -warning 1 -unit gb 0
|
Note: You can specify a disk_size integer, which defaults to megabytes (MB) unless the -unit parameter is specified. Or, you can specify a disk_size%, which is a percentage of the storage pool size. To disable warnings, specify 0 or 0%. The default value is 0.
|
9.2 Performance monitoring
The ability to collect historical performance metrics is essential to properly monitor and manage storage subsystems and IBM FlashSystem. During troubleshooting and performance tuning, the historical data can be used as a parameter for changes and fixes.
The next sections show which performance analysis tools are integrated with IBM FlashSystem and which IBM external tools are available to collect performance statistics for historical retention.
Remember that performance statistics are useful to debug or prevent some potential bottlenecks, and make capacity planning for future growth easier.
9.2.1 On-board performance monitoring
In IBM FlashSystem, real-time performance statistics provide short-term status information for your systems. The statistics are shown as graphs in the management GUI.
You can use system statistics to monitor the bandwidth of all the volumes, interfaces, and MDisks that are used on your system. You can also monitor the overall CPUs usage for the system. These statistics also summarize the overall performance health of the system.
You can monitor changes to stable values or differences between related statistics, such as the latency between volumes and MDisks. These differences can then be further evaluated by performance diagnostic tools.
With system-level statistics, you also can quickly view bandwidth of volumes, interfaces, and MDisks. Each of these graphs displays the current bandwidth in megabytes per second and a view of bandwidth over time.
Each data point can be accessed to determine its individual bandwidth use and to evaluate whether a specific data point might represent performance impacts. For example, you can monitor the interfaces, such as for Fibre Channel or SAS interfaces, to determine whether the host data-transfer rate is different from the expected rate.
You can also select node-level statistics, which can help you determine the performance effect of a specific node. As with system statistics, node statistics help you to evaluate whether the node is operating within normal performance metrics.
The CPU utilization graph shows the current percentage of CPU usage and specific data points on the graph that show peaks in utilization. If compression is being used, you can monitor the amount of CPU resources that are being used for compression and the amount that is available to the rest of the system.
The Interfaces graph displays data points for Fibre Channel (FC), iSCSI, serial-attached SCSI (SAS), and IP Remote Copy interfaces. You can use this information to help determine connectivity issues that might affect performance.
The Volumes and MDisks graphs in the Performance window show four metrics: Read, Write, Read latency, and Write latency. You can use these metrics to help determine the overall performance health of the volumes and MDisks on your system. Consistent unexpected results can indicate errors in configuration, system faults, or connectivity issues.
Each graph represents 5 minutes of collected statistics, which are updated every 5 seconds. They also provide a means of assessing the overall performance of your system, as shown in Figure 9-6.
Figure 9-6 Monitoring/Performance overview
You can then choose the metrics that you want to be displayed, as shown in Figure 9-7.

Figure 9-7 Metrics
You can also obtain a quick overview by using the GUI option by selecting System → Dashboard (see Figure 9-8).
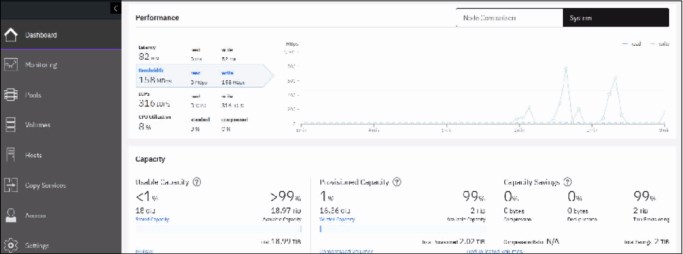
Figure 9-8 Management GUI Dashboard
9.2.2 Performance monitoring with IBM Spectrum Control
IBM Spectrum Control is an on-premises storage management, monitoring, and reporting solution. It uses the metadata that it collects about vendors’ storage devices to provide services such as custom alerting, analytics, and replication management. Both IBM Spectrum Control and IBM Storage Insights monitor storage systems, but IBM Spectrum Control also monitors hypervisors, fabrics, and switches to provide you with unique analytics and insights into the topology of your storage network.
It also provides more granular collection of performance data, with 1-minute intervals rather than the 5-minute intervals in IBM Storage Insights or IBM Storage Insights Pro.
Because IBM Spectrum Control is an on-premises tool, it does not send the metadata about monitored devices offsite, which is ideal for dark shops and sites that do not want to open ports to the cloud.
For more information about the capabilities of IBM Spectrum Control, see this IBM Documentation web page.
For more information about pricing and purchasing, see this web page.
For more information about IBM Storage Insights, see Getting Started with IBM Storage Insights.
|
Note: If you use IBM Spectrum Control or manage IBM block storage systems, you can access the free of charge version of IBM Storage Insights.
|
IBM Spectrum Control offers several reports that you can use to monitor IBM FlashSystem systems to identify performance problems. IBM Spectrum Control provides improvements to the web-based user interface that is designed to offer easy access to your storage environment.
IBM Spectrum Control provides a large amount of detailed information about IBM FlashSystem. The next sections provide basic suggestions about the metrics that need to be monitored and analyzed to debug potential bottleneck problems.
In addition, which alerts need to be set to be notified when some specific metrics exceed limits that are considered important for this specific environment.
For more information about the installation, configuration, and administration of IBM Spectrum Control (including how to add a storage system), see this IBM Documentation web page.
|
Note: IBM Spectrum Control 5.3.0 or higher is recommended for monitoring IBM FlashSystem Version 8.4.2.
|
IBM Spectrum Control dashboard
The IBM Spectrum Control dashboard provides a status overview of all monitored resources and identifies potential problem areas in a storage environment:
•Condition and usage of resources.
•Entities that consume storage on those resources.
•Number and status of unacknowledged alert conditions that are detected on the monitored resources.
•Most active storage systems in your environment.
Figure 9-9 shows the Spectrum Control dashboard.

Figure 9-9 Spectrum Control Dashboard
Key Performance Indicators
IBM Spectrum Control provides Key Performance Indicators (in earlier releases, Best Practice Performance Guidelines) for the critical monitoring metrics. These guidelines do not represent the maximum operating limits of the related components. Instead, they suggest limits that are selected with an emphasis on maintaining a stable and predictable performance profile.
The Key Performance Indicators web interface of IBM Spectrum Control (see Figure 9-10 on page 395) displays by default the last 24 hours from the active viewing time and date. Selecting an element from the chart overlays the corresponding 24 hours for the previous day and seven days prior. This display allows for an immediate historical comparison of the respective metric. The day of reference can also be changed to allow historical comparison of previous days.
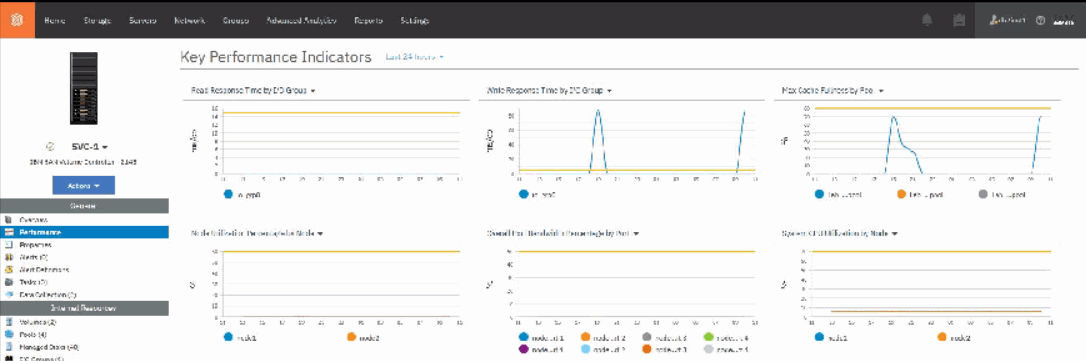
Figure 9-10 Key Performance Indicators
|
Note: The window was renamed to Key Performance Indicators.
|
The yellow line indicates the best practice value for the metric. These guidelines are established as the levels that allow for a diverse set of workload characteristics while maintaining a stable performance profile. The other lines on each chart represent the measured values for the metric for the resources on your storage system: I/O groups, ports, or nodes.
You can use the lines to compare how close your resources are to potentially becoming overloaded. If your storage system is responding poorly and the charts indicate overloaded resources, the workload might need to be better balanced. You can balance the workload between the hardware of the cluster, which can add hardware to the cluster, or move some workload to other storage systems.
The charts show the hourly performance data that is measured for each resource on the selected day. Use the following charts to compare the workloads on your storage system with the best practice guidelines:
•Node Utilization Percentage by Node
Compare the guideline value for this metric (for example, 60% utilization) with the measured value from your system. The average of the bandwidth percentages of those ports in the node that are actively used for host and MDisk send and receive operations. The average is weighted by port speed and adjusted according to the technology limitations of the node hardware. This chart is empty for clusters without FC ports (or when no host I/O is occurring).
•Overall Port Bandwidth Percentage by Port
Compare the guideline value for this metric (for example, 50%) with the measured value from your system. Because a cluster can have many ports, the chart shows only the eight ports with the highest average bandwidth over the selected day.
•Port-to-Local Node Send Response Time by Node
Compare the guideline value for this metric (for example, 0.6 ms/op) with the measured value from your system.
•Port-to-Remote Node Send Response Time by Node
Because latencies for copy-services operations can vary widely, a guideline is not established for this metric. Use this chart to identify any discrepancies between the data rates of different nodes.
•Read Response Time by I/O Group:
Compare the guideline value for this metric (for example, 15 ms/op) with the measured value from your system. When this metric is constantly breached, an issue with the hardware might exist.
•System CPU Utilization by Node
Compare the guideline value for this metric (for example, 70% utilization) with the measured value from your system.
•Total Data Rate by I/O Group
Because data rates can vary widely, a guideline is not established for this metric. Use this chart to identify any significant discrepancies between the data rates of different I/O groups because these discrepancies indicate that the workload is not balanced.
•Write Response Time by I/O Group
Compare the guideline value for this metric (for example, 5 ms/op) with the measured value from your system.
•Zero Buffer Credit Percentage by Node
Compare the guideline value for this metric (for example, 20%) with the measured value from your system.
Figure 9-11 shows an example of the Write Response Time by I/O Group, which exceeded the best practice limit (yellow line). The drop-down menu provides more options.

Figure 9-11 Write Response Time by I/O Group
|
Note: The guidelines are not thresholds and they are not related to the alerting feature in IBM Spectrum Control. To create performance alerts that use the guidelines as thresholds, open a resource detail window in the web-based GUI, click Alerts in the General section and then, click Definitions.
|
9.2.3 Performance monitoring with IBM Storage Insights
IBM Storage Insights (ISI) is an off-premises, IBM Cloud service that provides cognitive support capabilities, monitoring, and reporting for storage systems. Because it is an IBM Cloud service, getting started is simple and upgrades are handled automatically.
By using the IBM Cloud infrastructure, IBM Support can monitor your storage environment to help minimize the time to resolution of problems and collect diagnostic packages without requiring you to manually upload them. This wraparound support experience, from environment to instance, is unique to IBM Storage Insights and transforms how and when you get help.
IBM Storage Insights is a SaaS (Software as a Service) offering with its core running over IBM Cloud. IBM Storage Insights provides an unparalleled level of visibility across your storage environment to help you manage complex storage infrastructures and make cost-saving decisions. It combines proven IBM data management leadership with IBM analytics leadership from IBM Research® and a rich history of storage management expertise with a cloud delivery model, enabling you to take control of your storage environment.
As a cloud-based service, it enables you to deploy quickly and save storage administration time while optimizing your storage. It also helps automate aspects of the support process to enable faster resolution of issues. ISI optimizes storage infrastructure using cloud-based storage management and support platform with predictive analytics.
It allows you to optimize performance and to tier your data and storage systems for the right combination of speed, capacity, and economy. IBM Storage Insights provides comprehensive storage management, helps to keep costs low, and can prevent downtime and loss of data or revenue. IBM Storage Insights Key features are:
•Rapid results when you need them
•Single-pane view across your storage environment
•Performance analyses at your fingertips
•Valuable insight from predictive analytics
•Two editions that meet your needs
•Simplified, comprehensive, and proactive product support
Figure 9-12 shows an IBM Storage Insight® example window.

Figure 9-12 Storage Insights dashboard
Understanding the security and data collection features of IBM Storage Insights Pro and IBM Storage Insights can help address the concerns of administrators and IT professionals who deploy the products in their environments and want to learn more about security and data collection. For more information, see this IBM Documentation web page.
|
Note: IBM strongly recommends the use of IBM Storage Insights or IBM Spectrum Control for a better user experience. IBM Storage Insights requires the use of data collectors. The method of data collection has recently changed to improve security and ease of management. It is no longer required that you have a user with admin privileges for data collectors. A simple monitor user can get status information from the management node.
|
Licensing and editions of IBM Storage Insights
Several editions of IBM Storage Insights enable you to select the capabilities that serve your needs best. Licensing is implemented through different subscription levels.
•The free of charge version is called IBM Storage Insights and provides a unified view of a storage environment with a diagnostic events feed, an integrated support experience, and key capacity and performance metrics. IBM Storage Insights is available at no cost to IBM Storage Insights Pro subscribers and owners of IBM block storage systems who sign up. IBM Storage Insights provides an environment overview, integration in support processes, and shows you IBM analysis results.
•The capacity-based, subscription version is called IBM Storage Insights Pro and includes all of the features of IBM Storage Insights plus a more comprehensive view of the performance, capacity, and health of storage resources. It also helps you reduce storage costs and optimize your data center by providing features like intelligent capacity planning, storage reclamation, storage tiering, and advanced performance metrics.
The storage systems that you can monitor are expanded to include IBM file, object, software-defined storage (SDS) systems, and non-IBM block and file storage systems, such as EMC storage systems.
In both versions, when problems occur on your storage, you can get help to identify and resolve those problems and minimize potential downtime, where and when you need it.
Table 9-1 lists the different features of both versions.
Table 9-1 Features in IBM Storage Insights and IBM Storage Insights Pro
|
Resource Management
|
Functions
|
IBM Storage Insights (free)
|
IBM Storage Insights Pro (subscription)
|
|
Monitoring
|
Inventory management
|
IBM block storage
|
IBM and non-IBM block storage, file storage, and object storage
|
|
Logical configuration
|
Basic
|
Advanced
| |
|
Health
|
Call Home events
|
Call Home events
| |
|
Performance
|
Basic:
•Three storage system metrics: I/O rate, data rate, and response times aggregated for storage systems
•Four switches metrics: port saturation, port congestion, port hardware errors, and port logical errors
|
Advanced:
•100+ metrics for storage systems and their components
•40+ metrics for switches and related components
| |
|
Capacity
|
Basic
Four metrics: allocated space, available space, total space, and compression savings aggregated for storage systems
|
Advanced
(25+ metrics for storage systems and their components)
| |
|
Drill down performance workflows to enable deep troubleshooting
|
|
| |
|
Explore virtualization relationships
|
|
| |
|
Explore replication relationships
|
|
| |
|
Retention of configuration and capacity data
|
Only the last 24 hours is shown
|
2 years
| |
|
Retention of performance data
|
Only the last 24 hours is shown
|
1 year
| |
|
Reporting
|
|
| |
|
Service
|
Filter events to quickly isolate trouble spots
|
|
|
|
Hassle-free log collection
|
*
|
| |
|
Simplified ticketing
|
|
| |
|
Show active PMRs and ticket history
|
*
|
| |
|
Reporting
|
Inventory, capacity, performance, and storage consumption reports
|
•Capacity reports for block storage systems and pools
•Inventory reports for block storage systems
|
All reports
|
|
Analytics and optimization
|
Predictive Alerts
|
|
|
|
Customizable, multi-conditional alerting, including alert policies
|
|
| |
|
Performance planning
|
|
| |
|
Capacity planning
|
|
| |
|
Business impact analysis (applications, departments, and groups)
|
|
| |
|
Optimize data placement with tiering
|
|
| |
|
Optimize capacity with reclamation
|
|
| |
|
Security
|
ISO/IEC 27001 Information Security Management standards certified
|
|
|
|
Entitlements
|
|
Free
|
Capacity-based subscription
|
|
Restriction: If you can access IBM Storage Insights but are not an IBM Storage Insights Pro subscriber, you must have a warranty or maintenance agreement for an IBM block storage system to open tickets and send log packages.
|
IBM Storage Insights for IBM Spectrum Control
IBM Storage Insights for IBM Spectrum Control is an IBM Cloud service that can help you predict and prevent storage problems before they impact your business. It is complementary to IBM Spectrum Control and is available at no additional cost if you have an active license with a current subscription and support agreement for IBM Virtual Storage Center, IBM Spectrum Storage Suite, or any edition of IBM Spectrum Control.
As an on-premises application, IBM Spectrum Control doesn’t send the metadata about monitored devices offsite, which is ideal for dark shops and sites that do not want to open ports to the cloud. However, if your organization allows for communication between its network and the cloud, you can use IBM Storage Insights for IBM Spectrum Control to transform your support experience for IBM block storage.
IBM Storage Insights for IBM Spectrum Control and IBM Spectrum Control work hand in hand to monitor your storage environment. IBM Storage Insights for IBM Spectrum Control can transform your monitoring and support experiences:
•Open, update, and track IBM Support tickets easily for your IBM block storage devices.
•Get hassle-free log collection by allowing IBM Support to collect diagnostic packages for devices so you do not have to collect such information.
•Use Call Home to monitor devices, get best practice recommendations, and filter events to quickly isolate trouble spots.
•Use IBM Support’s ability to view the current and historical performance of your storage systems and help reduce the time-to-resolution of problems.
You can use IBM Storage Insights for IBM Spectrum Control for as long as you have an active license with a current subscription and support agreement for IBM Spectrum Control license. If your subscription and support lapses, you’re no longer eligible for IBM Storage Insights for IBM Spectrum Control. To continue using IBM Storage Insights for IBM Spectrum Control, simply renew your IBM Spectrum Control license. You can also choose to subscribe to IBM Storage Insights Pro.
IBM Spectrum Control and IBM Storage Insights for IBM Spectrum Control feature comparison
To understand the usability of IBM Spectrum Control and IBM Storage Insights for IBM Spectrum Control for your environment, we compare the features of IBM Spectrum Control and IBM Storage Insights for IBM Spectrum Control.
Table 9-2 lists the features in IBM Spectrum Control and IBM Storage Insights for IBM Spectrum Control.
Table 9-2 IBM Spectrum Control and IBM Storage Insights for IBM Spectrum Control comparison
|
Resource Management
|
Features
|
IBM Spectrum Control (Advanced edition)
|
IBM Storage Insights for IBM Spectrum Control
|
|
Monitoring
|
Inventory
|
IBM and non-IBM block storage, file storage, object storage, hypervisors, fabrics, switches
|
IBM and non-IBM block storage, file storage, and object storage
|
|
Call Home events
|
|
| |
|
Performance
|
(1-minute intervals)
|
(5-minute intervals)
| |
|
Capacity
|
|
| |
|
Drill down performance workflow to troubleshoot bottlenecks
|
|
| |
|
Explore virtualization relationships
|
|
| |
|
Explore replication relationships
|
|
| |
|
Retain performance data
|
|
| |
|
Service
|
Deployment method
|
|
|
|
Filter Call Home events to quickly isolate trouble spots
|
|
| |
|
Hassle-free log collection
|
|
| |
|
Simplified ticketing
|
|
| |
|
Show active PMRs and ticket history
|
|
| |
|
Active directory and LDAP integration for managing users
|
|
| |
|
Reporting
|
Inventory, capacity, performance, and storage consumption reports
|
|
|
|
Rollup reporting
|
|
| |
|
REST API
|
|
| |
|
Alerting
|
Predictive Alerts
|
|
|
|
Customizable, multi-conditional alerting, including alert policies
|
|
| |
|
Analytics
|
Performance planning
|
|
|
|
Capacity planning
|
|
| |
|
Business impact analysis (applications, departments, and groups)
|
|
| |
|
Provisioning with service classes and capacity pools
|
|
| |
|
Balance workload across pools
|
|
| |
|
Optimize data placement with tiering
|
|
| |
|
Optimize capacity with reclamation
|
|
| |
|
Transform and convert volumes
|
|
| |
|
Pricing
|
|
On-premises licensing
|
No charge for IBM Spectrum Control customers
|
You can upgrade IBM Storage Insights to IBM Storage Insights for IBM Spectrum Control if you have an active license of IBM Spectrum Control. For more information, see this web page. At this web page, choose the option for IBM Spectrum Control (log in required).
IBM Storage Insights for IBM Spectrum Control does not include the service level agreement for IBM Storage Insights Pro. Terms and conditions for IBM Storage Insights for IBM Spectrum Control are available at this IBM Support web page.
IBM Storage Insights, IBM Storage Insights Pro, and IBM Storage Insights for IBM Spectrum Control show some similarities, but there are differences:
•IBM Storage Insights is an off-premises, IBM Cloud service that is available free of charge if you own IBM block storage systems. It provides a unified dashboard for IBM block storage systems with a diagnostic events feed, a streamlined support experience, and key capacity and performance information.
•IBM Storage Insights Pro is an off-premises, IBM Cloud service that is available on subscription and expands the capabilities of IBM Storage Insights. You can monitor IBM file, object, and software-defined storage (SDS) systems, and non-IBM block and file storage systems such as Dell/EMC storage systems.
It also includes configurable alerts and predictive analytics that help you to reduce costs, plan capacity, and detect and investigate performance issues. You get recommendations for reclaiming unused storage, recommendations for optimizing the placement of tiered data, capacity planning analytics, and performance troubleshooting tools.
•IBM Storage Insights for IBM Spectrum Control is similar to IBM Storage Insights Pro in capability and is available for no additional cost if you have an active license with a current subscription and support agreement for IBM Virtual Storage Center, IBM Spectrum Storage Suite, or any edition of IBM Spectrum Control.
IBM Spectrum Storage Suite
IBM Spectrum Storage Suite gives you unlimited access to the IBM Spectrum Storage software family and IBM Cloud Object Storage software with licensing on a flat, cost-per-TB basis to make pricing easy to understand and predictable as capacity grows.
Structured specifically to meet changing storage needs, the suite is ideal for organizations just starting out with software-defined storage, and for those with established infrastructures who need to expand their capabilities. The IBM Spectrum Storage Suite consists of the following products:
•IBM Spectrum Control: Analytics-driven hybrid cloud data management to reduce costs
•IBM Spectrum Protect: Optimized hybrid cloud data protection to reduce backup costs
•IBM Spectrum Protect Plus: Complete VM protection and availability that is easy to set up and manage yet scalable for the enterprise
•IBM Spectrum Archive: Fast data retention that reduces total cost of ownership for active archive data
•IBM Spectrum Virtualize: Virtualization of mixed block environments to increase data storage
•IBM Spectrum Accelerate: Enterprise block storage for hybrid cloud
•IBM Spectrum Scale: High-performance, highly scalable hybrid cloud storage for unstructured data driving cognitive applications
•IBM Cloud Object Storage: Flexible, scalable, and simple object storage with geo dispersed enterprise availability and security for hybrid cloud workloads
Because IBM Spectrum Storage Suite includes IBM Spectrum Control, you can deploy IBM Storage Insight for IBM Spectrum Control.
|
Tip: Alerts are a good way to be notified of conditions and potential problems that are detected on your storage. If you use IBM Spectrum Control and IBM Storage Insights for IBM Spectrum Control together to enhance your monitoring capabilities, it is recommended that you define alerts in one of the offerings, but not both.
By defining all your alerts in one offering, you can avoid receiving duplicate or conflicting notifications when alert conditions are detected.
|
Implementation and set up of IBM Storage Insights
To use IBM Storage Insights with the IBM Spectrum Virtualize, you must sign up. For more information, see this web page.
Sign up process
Consider the following points about the sign-up process:
•For the sign-up process, you need an IBM ID. If you do not have such an ID, create your IBM account and complete the short form.
•When you register, specify an owner for IBM Storage Insights. The owner manages access for other users and acts as the main contact.
•You receive a Welcome email when IBM Storage Insights is ready. The email contains a direct link to your dashboard.
Figure 9-13 shows the IBM Storage Insight registration window.

Figure 9-13 IBM Storage Insight registration window
Figure 9-14 shows the registration website when you scroll down. You can select whether you want to register for IBM Storage Insights or IBM Storage Insights for Spectrum Controls.

Figure 9-14 Choose IBM Storage Insights or IBM Storage Insights for Spectrum Control
Figure 9-15 shows the log in window in the registration process. If you have your credentials, enter your ID and click Continue to proceed. If you do not have an ID, click Create an IBMid.
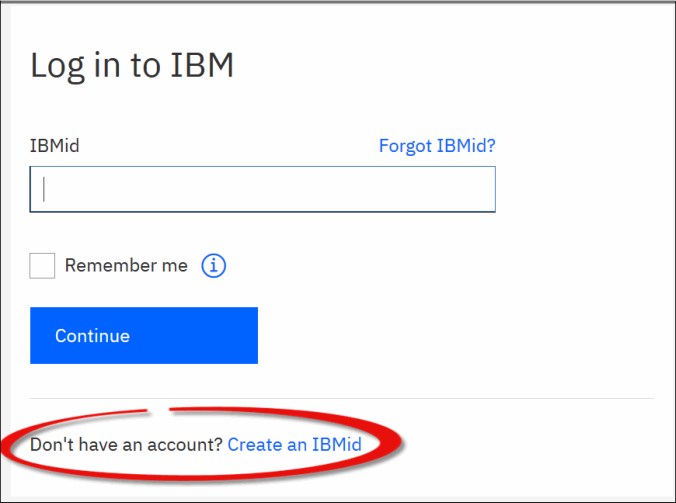
Figure 9-15 Registration login window
If you want to create an IBMid, provide the following information (see Figure 9-16 on page 407):
•Email
•First name
•Last name
•Country or region
•Password
Select the option if you want to receive Information from IBM to keep you informed of products, services, and offerings. You can withdraw your marketing consent at any time by sending an email to [email protected]. Also, you can unsubscribe from receiving marketing emails by clicking the unsubscribe link in an email.
For more information, see IBM Privacy Statement.
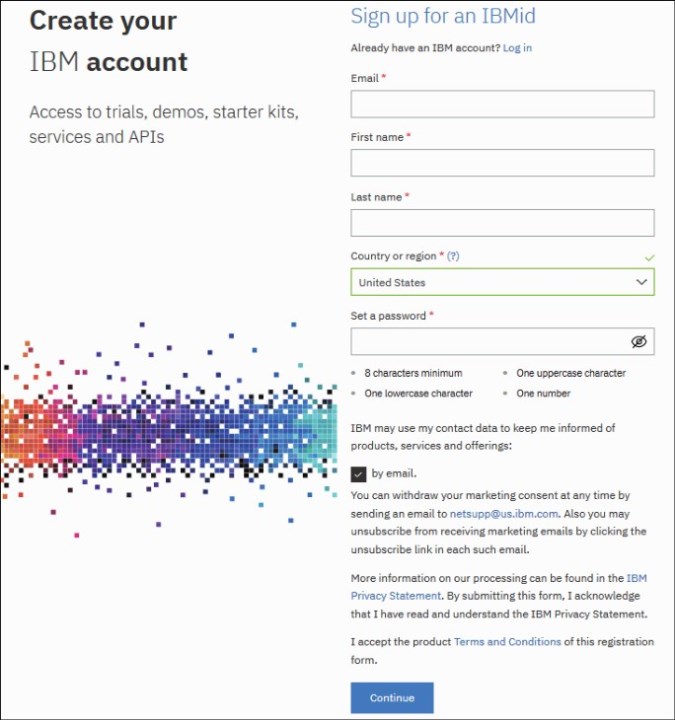
Figure 9-16 Creating an IBM account
In the next window, sign in with your IBM Account and password.
Complete the following information in the IBM Storage Insights registration form (see Figure 9-17 on page 408):
•Company name (must be unique).
•You might complete other identifying features, such as a location or department:
– Owner details
– Email address / ID
– The person who registered for IBM Storage Insights
– Access granted for storage trends, health of storage and access to support
– First and last name

Figure 9-17 IBM Storage Insights registration form
After registration for Storage Insights is complete, download and install the data collector for your system. Extract the data collector, run the data collector installer script, and ensure that your server (or virtual machine) can access the host_name:port that is specific to your instance of Storage Insights. After the data collector is installed on the system, you can add your storage devices to a Storage Insights dashboard.
|
Note: To connect to your instance of Storage Insights, you must configure your firewall to allow outbound communication on the default HTTPS port 443 using Transmission Control Protocol (TCP). User Datagram Protocol (UDP) is not supported.
|
Deploy a data collector
To deploy a lightweight data collector in your data center to stream performance, capacity, and configuration metadata to IBM Storage Insights:
1. Log in to IBM Storage Insights (the link is in your Welcome email).
2. From the Configuration > Data Collector page, download the data collector for your operating system (Windows, Linux, or AIX).
3. Extract the contents of the data collector file on the virtual machine or physical server where you want it to run.
4. For Windows, run installDataCollectorService.bat.
For Linux or AIX, run installDataCollectorService.sh.
After the data collector is deployed, it attempts to establish a connection to IBM Storage Insights. When the connection is complete, you are ready to start adding your storage systems for monitoring.
|
Requirements: The following requirements must be met:
•1 GB RAM
•1 GB disk space
•Windows, AIX, or Linux (x86-64 systems only)
|
For more information, see this IBM Documentation web page.
|
Note: To avoid potential problems, ensure that the operating system on the server or virtual machine where you install the data collector has general or extended support for maintenance and security.
|
Storage system metadata is sent to IBM Storage Insights, such as the following examples:
•Information about the configuration of the storage system, such as name, firmware, and capacity.
•Information about the internal resources of the storage system, such as volumes, pools, nodes, ports, and disks. This includes the names and the configuration and capacity information for each internal resource.
•Information about the performance of storage system resources and internal resources such as pools and volumes.
For more information on how the metadata is collected and used, see the following resources:
Adding a storage system
Complete the following steps to connect IBM Storage Insights to the storage systems that you want to monitor:
1. On the Operations dashboard in IBM Storage Insights, look for the button to add storage systems.
2. Click Add Storage Systems and follow the prompts. You can add one or more storage systems at a time.
For more information, see this IBM Documentation web page.
Dashboard
The operations dashboard provides a full view of your storage inventory and metadata. It also includes a diagnostic feed that tells you which storage systems require attention.
The dashboard includes the following key elements:
•Storage systems that are being monitored.
•A dynamic diagnostic feed that tells you which storage systems require attention.
•Key capacity metrics so you know whether you have enough capacity to meet your storage demands.
•Key performance metrics so that you know whether the performance of your storage systems meets operational requirements.
For more information, see this IBM Documentation web page.
Enable Call Home
Get the most out of IBM Storage Insights by enabling Call Home on your IBM block storage systems. With Call Home, your dashboard includes a diagnostic feed of events and notifications about their health and status.
Stay informed so you can act quickly to resolve incidents before they affect critical storage operations.
For more information, see this IBM Documentation web page.
Adding users to your dashboard
Users, such as other storage administrators, IBM Technical Advisors, and IBM Business Partners, can be added at any time so that they can access your IBM Storage Insights dashboard. Complete the following steps:
1. In IBM Storage Insights, click your username in the upper-right of the dashboard.
2. Click Manage Users.
3. On your MYIBM page, ensure that IBM Storage Insights is selected.
4. Click Add new user.
For more information, see this IBM Documentation web page.
9.3 Capacity metrics for block storage systems
Effective and exact capacity management is based on fundamental knowledge of capacity metrics in the IBM SAN Volume Controller system. Data reduction pools (DRPs), thin provisioning, compression, and deduplication add many metrics to the IBM SAN Volume Controller management GUI, IBM Spectrum Control, and IBM Storage Insights.
This section describes capacity monitoring by using:
•Management GUI
•IBM Spectrum Control
•IBM Storage Insights
Figure 9-18 shows how to interpret the capacity and savings in a storage environment.

Figure 9-18 Understanding capacity information
9.3.1 Capacity monitoring by using the management GUI
The Capacity section of the Dashboard provides an overall view of system capacity. This section displays usable capacity, provisioned capacity, and capacity savings.
Usable capacity
Usable capacity (see Figure 9-19) indicates the total capacity in all storage on the system and includes all of the storage the system that can be virtualized and assigned to pools. Usable capacity is displayed in a bar graph and is divided into three categories: Stored Capacity, Available Capacity, and Total.
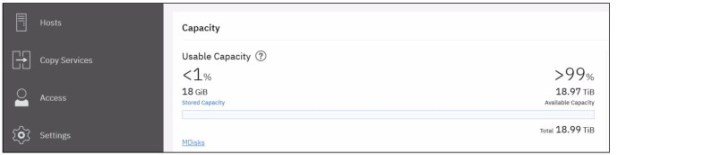
Figure 9-19 Usable Capacity display
|
Note: If a DRP on IBM SAN Volume Controller level is using back-end storage that also compresses data (FCM drives or storage that uses FCMs) it is important to note that data sent to the back end from DRP is already compressed and the back end will not be able to compress it further. This makes it important to not allocate more than the total capacity of the back-end device to a DRP.
|
Stored capacity
Stored capacity (see Figure 9-19) indicates the amount of capacity that is used on the system after capacity savings. The system calculates the stored capacity by subtracting the available capacity and any reclaimable capacity from the total capacity that is allocated to MDisks. To calculate the percentage, the stored capacity is divided by the total capacity that is allocated to MDisks. On the left side of the bar graph, the stored capacity is displayed in the total capacity and as a percentage.
Available capacity
The total Available capacity (see Figure 9-19) displays on the right side of the bar graph. Available capacity is calculated by adding the available capacity and the total reclaimable capacity. To calculate the percentage of available capacity on the system, the available capacity is divided by the total amount of capacity that is allocated to MDisks.
Total capacity
The Total capacity (see Figure 9-19) displays on the right under the bar graph and shows all the capacity available on the system. The bar graph is a visual representation of capacity usage and availability and can be used to determine whether storage must be added to the system. Select MDisks to view more information about the usable capacity of the system on the MDisks by Pools page. You can also select Compressed Volumes, Deduplicated Volumes, or Thin-Provisioned Volumes.
If you use the command-line interface to determine usable capacity on your system, several parameter values are used from the lssystem command to calculate stored, available, and total capacities.
Stored capacity is calculated with the values in the total_mdisk_capacity, total_free_space, total_reclaimable_capacity by using the following formula:
Total stored capacity =
total_mdisk_capacity - total_free_space - total_reclaimable_capacity
To calculate the available capacity, use the values in total_free_space and total_reclaimable_capacity, as shown in the following formula:
Total available capacity = total_free_space + total_reclaimable_capacity
An example of determining the usable capacity is shown in Example 9-3.
Example 9-3 Determining usable capacity
IBM_FlashSystem:FS9200:superuser>lssystem |grep total_mdisk
total_mdisk_capacity 5.3TB
IBM_FlashSystem:FS9200:superuser>lssystem |grep total_free
total_free_space 5.3TB
IBM_FlashSystem:FS9200:superuser>lssystem |grep total_reclaim
total_reclaimable_capacity 0.00MB
IBM_FlashSystem:FS9200:superuser>
Provisioned capacity
Provisioned capacity (see Figure 9-20) is the total capacity of all virtualized storage on the system. Provisioned capacity is displayed in a bar graph and is divided into two categories: Written Capacity and Available Capacity.

Figure 9-20 Provisioned Capacity
Written Capacity (see Figure 9-20) displays on the left side of the bar graph and indicates the amount of capacity that has data that is written to all the configured volumes on the system. The system calculates the written capacity for volumes by adding the stored capacity to capacity savings. The percentage of written capacity for volumes is calculated by dividing the written capacity by the total provisioned capacity for volumes on the system.
The Available Capacity (see Figure 9-20) displays on the right side of the bar graph and indicates the capacity on all configured volumes that is available to write new data. The available capacity is calculated by subtracting the written capacity for volumes from the total amount of capacity that is provisioned for volumes.
The percentage of available capacity is calculated by dividing the available capacity for volumes by the total amount of capacity that is provisioned to volumes on the system.
The Total Provisioned capacity displays under the Available Capacity and indicates the total amount of capacity that is allocated to volumes. The Provisioned Capacity also displays the percentage for over-provisioned volumes. The Overprovisioned value indicates the percentage of provisioned capacity that is increased because of capacity savings.
Capacity Savings (see Figure 9-21 and Example 9-4) indicates the amount of capacity that is saved on the system by using compression, deduplication, and thin-provisioning. The percentage value for each of these capacity savings methods compares the stored capacity before capacity savings are applied to the stored capacity after capacity savings is applied.
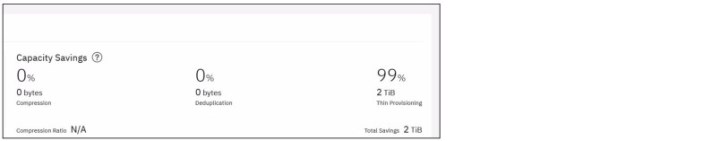
Figure 9-21 Capacity Savings
Compression shows the total capacity savings gained from the use of compression on the system. Deduplication indicates the total capacity savings that the system is saved from all deduplicated volumes.
Thin-Provisioning displays the total capacity savings for all thin-provisioned volumes on the system. You can view all of the volumes that use each of these technologies. Different system models can have more requirements to use compression or deduplication. Verify all system requirements before these functions are used.
Example 9-4 Capacity savings
IBM_FlashSystem:FS9200:superuser>lssystem |grep deduplication
deduplication_capacity_saving 0.00MB
IBM_FlashSystem:FS9200:superuser>lssystem |grep compression
compression_active no
compression_virtual_capacity 0.00MB
compression_compressed_capacity 0.00MB
compression_uncompressed_capacity 0.00MB
compression_destage_mode off
IBM_FlashSystem:FS9200:superuser>lssystem |grep reduction
used_capacity_before_reduction 0.00MB
used_capacity_after_reduction 0.00MB
9.4 Capacity monitoring by using IBM Spectrum Control or IBM Storage Insights
The Capacity section of IBM Spectrum Control and IBM Storage Insights provides an overall view of system capacity. This section displays usable capacity, provisioned capacity, and capacity savings.
The Capacity chart (see Figure 9-22) of IBM Spectrum Control at the top of the Overview page (select Spectrum Control GUI → Storage → Block Storage Systems and then, double-click the device) shows how much capacity is used and how much capacity is available for storing data.

Figure 9-22 Spectrum Control overview page
In IBM Storage Insights, the Capacity chart shows the capacity usage (see Figure 9-23) on the Dashboards page (select Storage Insights GUI → Dashboards → and then, click the device).

Figure 9-23 Storage Insights overview page
The Provisioned Capacity chart shows the written capacity values in relation to the total provisioned capacity values before data reduction techniques are applied. The following values are shown:
•The capacity of the data that is written to the volumes as a percentage of the total provisioned capacity of the volumes.
•The amount of capacity that is still available for writing data to the thin-provisioned volumes in relation to the total provisioned capacity of the volumes. Available capacity is the difference between the provisioned capacity and the written capacity, which is the thin-provisioning savings.
•A breakdown of the total capacity savings that are achieved when the written capacity is stored on the thin-provisioned volumes.
In the capacity overview chart, a horizontal bar is shown when a capacity limit is set for the storage system. Mouse over the chart to determine the capacity limit and how much capacity is left before the limit is reached.
For a breakdown of the capacity usage by pool or volume, click the links on the page.
Capacity view and their metrics
In this section, we describe the metrics of the Capacity View of IBM Spectrum Control and IBM Storage Insights for block storage systems.
To open the Capacity View in IBM Spectrum Control, you can start from the Storage menu and click Block Storage Systems. Then, right-click one or more storage systems and click View Capacity (Figure 9-24).
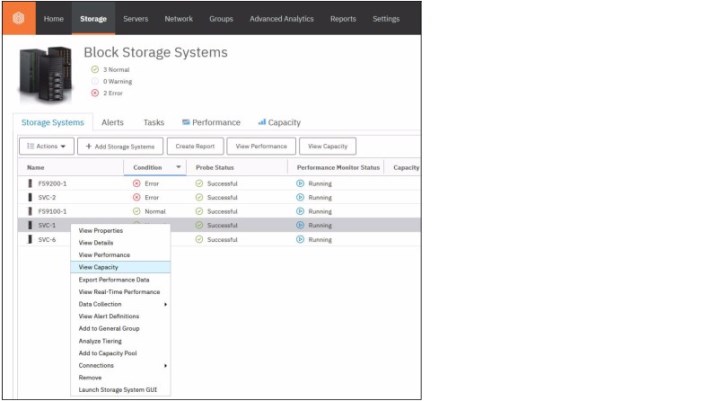
Figure 9-24 IBM Spectrum Control and IBM Storage Insights Block Storage Systems overview

Figure 9-25 Overview Storage System
To open the Capacity View in IBM Storage Insights, click Resources → Block Storage Systems. Then, right-click one or more storage systems and click View Capacity (see Figure ).

Figure 9-26 Used Capacity
|
Note: Used Capacity (%) was previously known as Physical Allocation.
|
Storage system, Pool capacity, and Volume capacity metrics
Used Capacity (%) shows the percentage of physical capacity in the pools that is used by the standard-provisioned volumes, thin-provisioned volumes, and volumes in child pools. Check the value for used capacity percentage to see the following information:
•Whether the physical capacity of the pools is fully allocated; that is, the value for used capacity is 100%.
•Whether you have sufficient capacity to:
– Provision new volumes with storage
– Allocate to the compressed and thin-provisioned volumes in the pools
The following formula (see the example that is shown in Figure ) is used to calculate Used Capacity (%):
[(Used Capacity ÷ Capacity)*100]
Used Capacity (GiB) shows the amount of space that is used by the standard- and thin-provisioned volumes in the pools. If the pool is a parent pool, the amount of space that is used by the volumes in the child pools is also calculated.
The capacity that is used by for thin-provisioned volumes is less than their provisioned capacity, which is shown in the Provisioned Capacity (GiB) column. If a pool does not have thin-provisioned volumes, the value for used capacity is the same as the value for provisioned capacity.
|
Note: Used Capacity (GiB) was previously known as Allocated Space.
|
Adjusted Used Capacity (%) shows the amount of capacity that can be used without exceeding the capacity limit.
The following formula is used to calculate Adjusted Used Capacity (%):
[(Used Capacity in GiB ÷ Capacity Limit in GiB)*100]
For example, if the capacity is 100 GiB, the used capacity is 40 GiB, and the capacity limit is 80% or 80 GiB, the value for Adjusted Used Capacity (%) is (40 GiB/80 GiB)* 100 or 50%.
In this example, you can use 30% or 40 GiB of the usable capacity of the resource before you reach the capacity limit (see Figure 9-27).
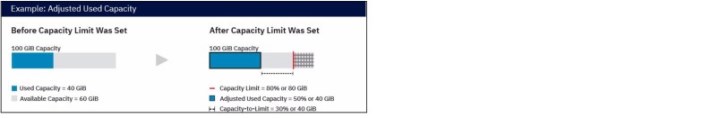
Figure 9-27 Adjusted Used Capacity example
If the used capacity exceeds the capacity limit, the value for Adjusted Used Capacity (%) is over 100%.
To add the Adjusted Used Capacity (%) column, right-click any column heading on the Block Storage Systems page.
Available Capacity (GiB) shows the total amount of the space in the pools that is not used by the volumes in the pools. To calculate available capacity, the following formula is used:
[pool capacity - used capacity]
|
Note: Available Capacity was previously known as Available Pool Space.
|
Available Volume Capacity (GiB) shows the total amount of remaining space that can be used by the volumes in the pools. The following formula is used to calculate this value:
[provisioned capacity − used capacity]
The capacity that is used by thin-provisioned volumes is typically less than their provisioned capacity. Therefore, the available capacity represents the difference between the provisioned capacity and the used capacity for all the volumes in the pools. For Hitachi VSP non-thin provisioned pool capacity, the available capacity is always zero.
|
Note: Available Volume Capacity (GiB) is previously known as Effective Unallocated Volume Space.
|
Capacity (GiB) shows the total amount of storage space in the pools. For XIV systems and IBM Spectrum Accelerate, capacity represents the physical (“hard”) capacity of the pool, not the provisioned (“soft”) capacity. Pools that are allocated from other pools are not included in the total pool space.
|
Note: Capacity is previously known as Pool Capacity.
|
Capacity Limit (%) and Capacity Limit (GiB) can be set on the capacity that is used by your storage systems. For example, the policy of your company is to keep 20% of the usable capacity of your storage systems in reserve. Therefore, you log in to the GUI as Administrator and set the capacity limit to 80% (see Figure 9-28).
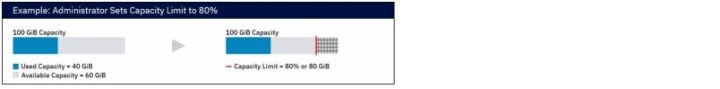
Figure 9-28 Capacity limit example
Capacity-to-Limit (GiB) shows the amount of capacity that is available before the capacity limit is reached.
The formula for calculating Capacity-to-Limit (GiB) is:
Capacity Limit in GiB - Used Capacity in GiB)
For example, if the capacity limit is 80% or 80 GiB and the used capacity is 40 GiB, the value for Capacity-to-Limit (GiB) is (80 GiB - 40 GiB or 80% - 50%) which is 30% or 40 GiB (see Figure 9-29).

Figure 9-29 Capacity-to-Limit
|
Note: This metric is not available for all storage systems, such as FlashSystem A9000, FlashSystem A9000R, and Dell EMC VMAX.
|
Compression Savings (%) are the estimated amount and percentage of capacity that is saved by using data compression across all pools on the storage system. The percentage is calculated across all compressed volumes in the pools and does not include the capacity of noncompressed volumes.
For storage systems with drives that use inline data compression technology, the Compression Savings does not include the capacity savings that are achieved at the drive level.
The following formula is used to calculate the amount of storage space that is saved:
[written capacity − compressed size]
The following formula is used to calculate the percentage of capacity that is saved:
[(written capacity − compressed size) ÷ written capacity] × 100
For example, the written capacity, which is the amount of data that is written to the volumes before compression, is 40 GiB. The compressed size, which reflects the size of compressed data that is written to disk, is only 10 GiB. Therefore, the compression savings percentage across all compressed volumes is 75%.
|
Note: Compression Savings (%) metric is available for FlashSystem A9000 and FlashSystem A9000R, IBM Spectrum Accelerate, XIV storage systems with firmware version 11.6 or later, and resources that run IBM Spectrum Virtualize.
For FlashSystem A9000 and FlashSystem A9000R, all volumes in the pools are compressed.
The exception is for compressed volumes that are also deduplicated on storage systems that run IBM Spectrum Virtualize. This column is blank.
|
Deduplication Savings (%) shows the estimated amount and percentage of capacity that is saved by using data deduplication across all DRPs on the storage system. The percentage is calculated across all deduplicated volumes in the pools and does not include the capacity of volumes that are not deduplicated.
The following formula is used to calculate the amount of storage space that is saved:
[written capacity − deduplicated size]
The following formula is used to calculate the percentage of capacity that is saved:
[(written capacity − deduplicated size) ÷ written capacity] × 100
For example, the written capacity, which is the amount of data that is written to the volumes before deduplication, is 40 GiB. The deduplicated size, which reflects the size of deduplicated data that is written to disk, is just 10 GB. Therefore, data deduplication reduced the size of the data that is written by 75%.
|
Note: Deduplication Savings (%) metric is available for FlashSystem A9000, FlashSystem A9000R, and resources that run IBM Spectrum Virtualize version 8.1.3 or later.
|
Drive Compression Savings (%) shows amount and percentage of capacity that is saved with drives that use inline data compression technology. The percentage is calculated across all compressed drives in the pools.
The amount of storage space that is saved is the sum of drive compression savings.
The following formula is used to calculate the percentage of capacity that is saved:
[(used written capacity − compressed size) ÷ used written capacity] × 100
|
Note: Drive Compression Savings (%) metric is available for Storage systems that contain IBM FlashCore Modules with hardware compression.
|
Mapped Capacity (GiB) shows the total volume space in the storage system that is mapped or assigned to host systems, including child pool capacity.
|
Note: Mapped Capacity (GiB) is previously known as Assigned Volume Space.
|
Overprovisioned Capacity (GiB) shows the capacity that cannot be used by volumes because the physical capacity of the pools cannot meet the demands for provisioned capacity. The following formula is used to calculate this value:
[Provisioned Capacity − Capacity]
|
Note: Overprovisioned Capacity (GiB) is previously known as Unallocatable Volume Space.
|
Shortfall (%) shows the difference between the remaining unused volume capacity and the available capacity of the associated pool, expressed as a percentage of the remaining unused volume capacity. The shortfall represents the relative risk of running out of space for overallocated thin-provisioned volumes.
If the pool has sufficient available capacity to satisfy the remaining unused volume capacity, no shortfall exists. As the remaining unused volume capacity grows, or as the available pool capacity decreases, the shortfall increases and the risk of running out of space becomes higher. If the available capacity of the pool is exhausted, the shortfall is 100% and any volumes that are not yet fully allocated run out of space.
If the pool is not thin-provisioned, the shortfall percentage equals zero. If shortfall percentage isn't calculated for the storage system, the field is left blank.
The following formula is used to calculate this value:
[Overprovisioned Capacity ÷ Committed but Unused Capacity]
You can use this percentage to determine when the amount of over-committed space in a pool is at a critically high level. Specifically, if the physical space in a pool is less than the committed provisioned capacity, the pool does not have enough space to fulfill the commitment to provisioned capacity. This value represents the percentage of the committed provisioned capacity that is not available in a pool. As more space is used over time by volumes while the pool capacity remains the same, this percentage increases.
Next, we consider Shortfall (%) based on example values. The remaining physical capacity of a pool is 70 GiB, but 150 GiB of provisioned capacity was committed to thin-provisioned volumes. If the volumes use 50 GiB, 100 GiB is still committed to the volumes
(150 GiB − 50 GiB) with a shortfall of 30 GiB (70 GiB remaining pool space − 100 GiB remaining commitment of volume space to the volumes). Because the volumes are overcommitted by 30 GiB based on the available capacity in the pool, the shortfall is 30% when the following calculation is used:
(150 GiB − 50 GiB) with a shortfall of 30 GiB (70 GiB remaining pool space − 100 GiB remaining commitment of volume space to the volumes). Because the volumes are overcommitted by 30 GiB based on the available capacity in the pool, the shortfall is 30% when the following calculation is used:
[(100 GiB unused volume capacity − 70 GiB remaining pool capacity) ÷ 100 GiB unused volume capacity] × 100
For more information, see this video.
|
Note: Shortfall (%) is available for DS8000, Hitachi Virtual Storage Platform, and storage systems that run IBM Spectrum Virtualize.
This value is not available for FlashSystem A9000 and FlashSystem A9000R.
|
Provisioned Capacity (%) shows the percentage of the physical capacity that is committed to the provisioned capacity of the volumes in the pools. If the value exceeds 100%, the physical capacity does not meet the demands for provisioned capacity. To calculate provisioned capacity percentage, the following formula is used:
[(provisioned capacity ÷ pool capacity) × 100]
For example, if the provisioned capacity percentage is 200% for a storage pool with a physical capacity of 15 GiB, the provisioned capacity that is committed to the volumes in the pools is 30 GiB. Twice as much space is committed to the pools than is physically available to the pools.
If the provisioned capacity percentage is 100% and the physical capacity is 15 GiB, the provisioned capacity that is committed to the pools is 15 GiB. The total physical capacity that is available to the pools is used by the volumes in the pools.
A provisioned capacity percentage that is higher than 100% is considered to be aggressive because insufficient physical capacity is available to the pools to satisfy the allocation of the committed space to the compressed and thin-provisioned volumes in the pools. In such cases, you can check the Shortfall (%) value to determine how critical the shortage of space is for the storage system pools.
|
Note: Provisioned Capacity (%) is previously known as Virtual Allocation.
|
Provisioned Capacity (GiB) shows the total amount of provisioned capacity of volumes within the pool. If the pool is a parent pool, it also includes the storage space that can be made available to the volumes in the child pools.
|
Note: Provisioned Capacity (GiB) is previously known as Total Volume Capacity.
|
Safeguarded Capacity (GiB) shows the total amount of capacity that is used to store volume backups that are created by the Safeguarded Copy feature in DS8000.
Total Capacity Savings (%) shows the estimated amount and percentage of capacity that is saved by using data deduplication, pool compression, thin provisioning, and drive compression, across all volumes in the pool.
The following formula is used to calculate the amount of storage space that is saved:
[Provisioned Capacity − Used Capacity]
The following formula is used to calculate the percentage of capacity that is saved:
[(Provisioned Capacity − Used Capacity) ÷ Provisioned Capacity] × 100
|
Note: Total Capacity Savings (%) is previously known as Total Data Reduction Savings and is available for: FlashSystem A9000 and FlashSystem A9000R, IBM Spectrum Accelerate, XIV storage systems with firmware version 11.6 or later, and resources that run IBM Spectrum Virtualize.
|
Unmapped Capacity (GiB) shows the total amount of space in the volumes that are not assigned to hosts.
|
Note: Unmapped Capacity (GiB) is previously known as Unassigned Volume Space.
|
In the Zero Capacity column (see Figure 9-30) on the Pools page, you can see the date, which is based on the storage usage trends for the pool, for when the pool runs out of available capacity.
|
Zero Capacity: The capacity information that is collected over 180 days is analyzed to determine, based on historical storage consumption, when the pools are to run out of capacity. The pools ran out of capacity are marked as Depleted. For the other pools, a date is provided so that you know when the pools are projected to run out of capacity. If sufficient information is not collected to analyze the storage usage of the pool, None is shown as the value for zero capacity.
If a capacity limit is set for the pool, the date that is shown in the Zero Capacity column is the date when the available capacity based on the capacity limit is to be depleted. For example, if the capacity limit for a 100 GiB pool is 80%, it is the date when the available capacity of the pool is less than 20 GiB. Depleted is shown in the column when the capacity limit is reached.
|

Figure 9-30 Zero Capacity
The following values can be shown in the Zero Capacity column:
•A date
The data that is based on space usage trends for the pool when the capacity runs out (projected).
•None
Based on the current trend, no date can be calculated for when the pool is to be filled (for example, if the trend is negative) as data is moved out of the pool.
•Depleted
The pool is full.
The metrics that are described next can be added to capacity charts for storage systems within capacity planning. Use the charts to detect capacity shortages and space usage trends.
Available Repository Capacity (GiB) shows the available, unallocated storage space in the repository for Track Space-Efficient (TSE) thin-provisioning.
|
Note: Available for: DS8000 thin-provisioned pools.
|
Soft Capacity (GiB) shows the amount of virtual storage space that is configured for the pool.
|
Note: Soft Capacity (GiB) is available for XIV systems and IBM Spectrum Accelerate storage systems.
|
Available Soft Capacity (GiB) shows the amount of virtual storage space that is available to allocate to volumes in a storage pool.
|
Note: Available for: XIV systems, and IBM Spectrum Accelerate storage systems.
|
Written Capacity (GiB) shows the amount of data that is written from the assigned hosts to the volume before compression or data deduplication are used to reduce the size of the data. For example, the written capacity for a volume is 40 GiB. After compression, the volume used space, which reflects the size of compressed data that is written to disk, is only 10 GiB.
|
Note: Written Capacity (GiB) is previously known as Written Space.
|
Available Written Capacity (GiB) shows the amount of capacity that can be written to the pools before inline compression is applied. If the pools are not compressed, this value is the same as Available Capacity.
|
Note: Available Written Capacity (GiB) is previously known as Effective Used Capacity.
Because data compression is efficient, a pool can run out of Available Written Capacity while physical capacity is still available. To stay aware of your capacity needs, monitor this value and Available Capacity.
|
Enterprise HDD Available Capacity (GiB) shows the amount of storage space that is available on the Enterprise hard disk drives that can be used by Easy Tier for retiering the volume extents in the pool.
|
Note: Enterprise HDD Available Capacity (GiB) is available for DS8000 and storage systems that run IBM Spectrum Virtualize.
|
Enterprise HDD Capacity (GiB) shows the total amount of storage space on the Enterprise hard disk drives that can be used by Easy Tier for retiering the volume extents in the pool.
|
Note: Enterprise HDD Capacity (GiB) is available for DS8000 and storage systems that run IBM Spectrum Virtualize.
|
Nearline HDD Available Capacity (GiB) shows the amount of storage space that is available on the Nearline hard disk drives that can be used by Easy Tier for retiering the volume extents in the pool.
|
Note: Nearline HDD Available Capacity (GiB) is available for DS8000 and storage systems that run IBM Spectrum Virtualize.
|
Nearline HDD Capacity (GiB) shows the total amount of storage space on the Nearline hard disk drives that can be used by Easy Tier for retiering the volume extents in the pool.
|
Note: Nearline HDD Available Capacity (GiB) is available for DS8000 and storage systems that run IBM Spectrum Virtualize.
|
Repository Capacity (GiB) shows the total storage capacity of the repository for Track Space-Efficient (TSE) thin-provisioning.
|
Note: Repository Capacity (GiB) is available for DS8000 thin-provisioned pools.
|
Reserved Volume Capacity shows the amount of pool capacity that is reserved but has not been used yet to store data on the thin-provisioned volume.
|
Note: Reserved Volume Capacity is previously known as Unused Space and is available for resources that run IBM Spectrum Virtualize.
|
SCM Available Capacity (GiB) shows the available capacity on Storage Class Memory (SCM) drives in the pool. Easy Tier can use these drives to retier the volume extents in the pool.
|
Note: SCM Available Capacity (GiB) is available for IBM Spectrum Virtualize systems, such as FlashSystem 9200, FlashSystem 7200, and Storwize family storage systems that are configured with block storage.
|
SCM Capacity (GiB) shows the total capacity on Storage Class Memory (SCM) drives in the pool. Easy Tier can use these drives to retier the volume extents in the pool.
|
Note: SCM Capacity (GiB) is available for IBM Spectrum Virtualize systems, such as FlashSystem 9200, FlashSystem 7200, and Storwize family storage systems that are
configured with block storage. |
Tier 0 Flash Available Capacity (GiB) shows the amount of storage space that is available on the Tier 0 flash solid-state drives that can be used by Easy Tier for retiering the volume extents in the pool.
|
Note: Tier 0 Flash Available Capacity (GiB) is available for DS8000 and storage systems that run IBM Spectrum Virtualize.
|
Tier 0 Flash Capacity (GiB) shows the total amount of storage space on the Tier 0 flash solid-state drives that can be used by Easy Tier for retiering the volume extents in the pool.
|
Note: Tier 0 Flash Capacity (GiB) is available for DS8000 and storage systems that run IBM Spectrum Virtualize.
|
Tier 1 Flash Available Capacity (GiB) shows the amount of storage space that is available on the Tier 1 flash, read-intensive solid-state drives that can be used by Easy Tier for retiering the volume extents in the pool.
|
Note: Tier 1 Flash Available Capacity (GiB) is available for DS8000 and storage systems that run IBM Spectrum Virtualize.
|
Tier 1 Flash Capacity (GiB) shows the total amount of storage space on the Tier 1 flash, read-intensive solid-state drives that can be used by Easy Tier for retiering the volume extents in the pool.
|
Note: Tier 1Flash Capacity (GiB) is available for DS8000 and storage systems that run IBM Spectrum Virtualize.
|
Tier 2 Flash Available Capacity (GiB) shows the available capacity on Tier 2 flash, high-capacity drives in the pool. Easy Tier can use these drives to retier the volume extents in the pool.
|
Note: Tier 2 Flash Available Capacity (GiB) is available for: DS8000 storage systems.
|
Tier 2 Flash Capacity (GiB) shows the total capacity on Tier 2 flash, high-capacity drives in the pool. Easy Tier can use these drives to retier the volume extents in the pool.
|
Note: Tier 2 Flash Capacity (GiB) is available for DS8000 storage systems.
|
9.5 Creating alerts for IBM Spectrum Control and IBM Storage Insights
In this section, we provide information about alerting with IBM Spectrum Control and IBM Storage Insights. The free version of IBM Storage Insights does not support alerting.
New data reduction technologies add intelligence and capacity savings to your environment. If you use data reduction on different layers, such as hardware compression in the IBM FlashSystem 9200 Flash Core Modules (if an FS9200 is virtualized by the IBM SAN Volume Controller) and in the DRPs, you must pay more attention in preventing insufficient space remaining in the back-end storage device.
First, it is important to distinguish between thin provisioning and over-allocation (over-provisioning). Thin provisioning is a method for optimizing the use of available storage. It relies on allocation of blocks of data on-demand versus the traditional method of allocating all of the blocks up front. This method eliminates almost all white space, which helps avoid the poor usage rates (often as low as 10%) that occur in the traditional storage allocation method. Traditionally, large pools of storage capacity are allocated to individual servers, but remain unused (not written to).
Over provisioning means that more space is being assigned and promised to the hosts in total. They can try to store more data on the storage subsystem as physical capacity is available. However, an out-of-space condition can result.
|
Remember: You must constantly monitor your environment to avoid over-provisioning situations that can be harmful to the environment and can cause data loss.
It is also important to keep at least 15% free space for Garbage Collection in the background.
|
Data reduction technologies return back some space. If the space that is used for the data can be reduced, the saved up space can be used for other data. However, depending on the type of data, deleting might not result in freeing up much space.
Consider the example in which if you have three identical or almost identical files on a file system that were deduplicated. This issue resulted in getting a good compression ratio (three files, but stored only once). If you now delete one file, you do not gain more space because the deduplicated data must stay on the storage (because two other versions refer to the data). Similar results can be seen when several FlashCopies of one source are used.
9.5.1 Alert examples
Table 9-3 lists alerts for IBM FlashSystem systems that are based on Array or Pool level.
Table 9-3 Event examples for IBM FlashSystem
|
System
|
Entity
|
Resource Type
|
Event
|
|
FlashSystem
with FCM |
Array
|
Usable capacity
|
Available Physical Space <= nn%
(* Example shown in 9.5.2, “Alert to monitor back-end capacity: Available Physical Space (%)” on page 426) |
|
|
Pool
|
Efficient Capacity
|
Physical allocation >= nn%
|
|
FlashSystem
other media |
Pool
|
Usable Capacity
|
Physical allocation >= nn%
|
Other alerts are possible as well; percentage alerts often are best suited because the alert definition applies to all pool in a storage system.
9.5.2 Alert to monitor back-end capacity: Available Physical Space (%)
In this section, we show how to deploy IBM Spectrum Control or IBM Storage Insights to monitor storage capacity and set up thresholds to notify and prevent us from running out of space.
The following example shows how to create an alert to get status Information about the remaining physical space on an IBM FlashSystem.
First, assign a severity to an alert. Assigning a severity can help you quickly identify and address the critical conditions that are detected on resources. The severity that you assign depends on the guidelines and procedures within your organization. Default assignments are provided for each alert.
Table 9-4 lists the possible alert severities.
Table 9-4 Alert severities
|
Option
|
Description
|
|
Critical
|
Alert is critical and needs to be resolved. For example, alerts that notify you when the amount of available space on a file system falls below a specified threshold.
|
|
Warning
|
Alerts that are not critical but represent potential problems. For example, alerts that notify you when the status of a data collection job is not normal.
|
|
Informational
|
Alerts that might not require any action to resolve and are primarily for informational purposes. For example, alerts that are generated when a new pool is added to a storage system
|
In this example, we created three thresholds:
•Critical (15% Available Physical Capacity (%) left)
•Warning (20% Available Physical Capacity (%) left)
•Information (30% Available Physical Capacity (%) left)
Adjust the percentage levels to the required levels as needed. The process to extend storage might take some time (ordering, installation, provisioning, and so on).
The advantage of this way to set up an Alert Policy is that you can add various IBM FlashSystem to this customized alert.
Figure 9-31 shows how to start creating an Alert Policy in Spectrum Control.
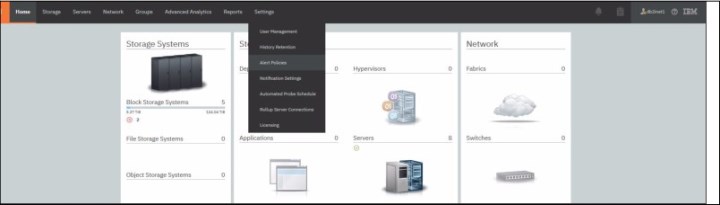
Figure 9-31 Spectrum Control Alert Policies
For Storage Insights, Figure 9-32 shows how to start creating an Alert Policy.

Figure 9-32 Storage Insights Alert Policies
The following example shows how to create an Alert Policy by copying the existing policy. You might need to change an existing Alert Policy (in our example the Default Policy) as well. Consider that a storage subsystem can be active in only one Alert Policy.
|
Note: No difference exists from IBM Spectrum Control to IBM Storage Insights for the steps that are presented next.
|
Figure 9-33 shows the Default Policy of IBM SAN Volume Controller in IBM Spectrum Control.

Figure 9-33 All Policies in Spectrum Control
Figure 9-34 shows how to copy a policy to create a policy. Mouse over the policy that you want to copy and then, left-click and choose Copy Policy.

Figure 9-34 Copying a Policy in Spectrum Control
Figure 9-35 shows how to rename the previously copied policy. The new policy is stored as another policy. One IBM FlashSystem system can be added to a single policy only. You can add the system later on if you are not sure now (optional: Select Resource and select the option).

Figure 9-35 Copy Policy process
Figure 9-36 shows the newly created Alert Policy FS9200-1 with all alerts that were inherited from the Default Policy.
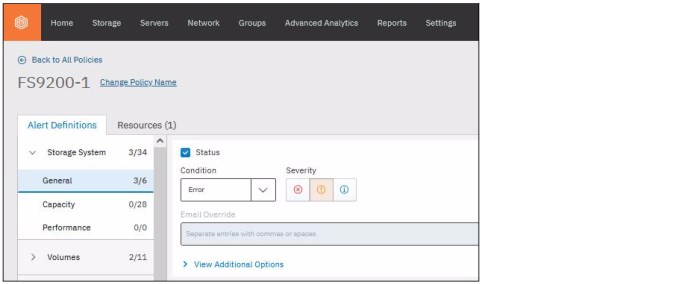
Figure 9-36 Spectrum Control - New Policy with inherited Alert Definitions
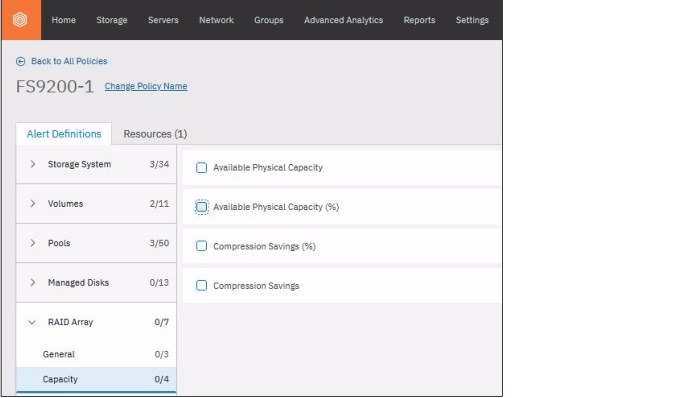
Figure 9-37 Alert Definitions
Figure 9-38 shows the tasks for setting up the Critical definition by monitoring the Used Capacity (%) and releasing Policy Notifications at 15%.
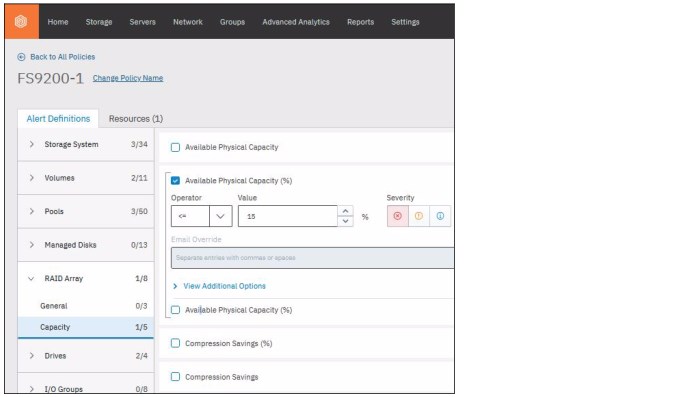
Figure 9-38 Spectrum Control - Alert Definition 15% Available Physical Capacity (%) - Critical
Predefined methods can be one of the following options:
•Email Addresses
•SNMP
•IBM Netcool/OMNIbus
•Windows Event Log or UNIX syslog
These methods must be defined before you can choose them. If your environment does not have predefined methods (see Figure 9-38 on page 430).
Figure 9-39 shows how to change the Frequency of the notification. You can choose here to get more frequent notification for the Critical Threshold “15% Available Physical Capacity (%)”. In this example, we choose to set the frequency to Send every 1 day.
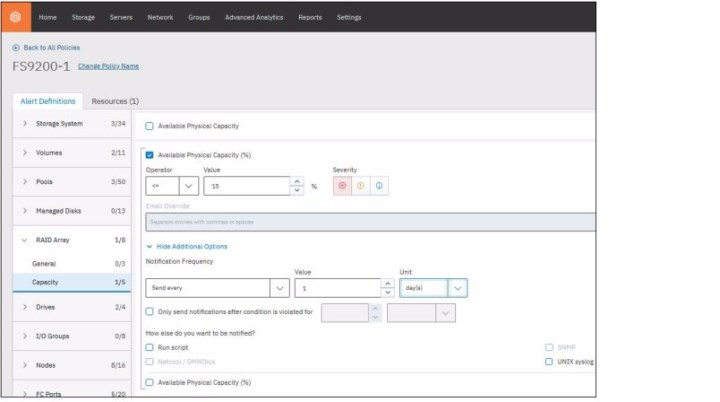
Figure 9-39 Spectrum Control - Alert Definition 15% Available Physical Capacity (%) - Frequency
Figure 9-40 shows how to set up the Warning level at 30% for Available Physical Capacity (%). To proceed, choose the plus sign at the previously defined Definition (Critical) and complete the fields in the window, as shown in Figure 9-40; that is, Operator: “<=”, Value: “30%”, and Severity “Warning”.
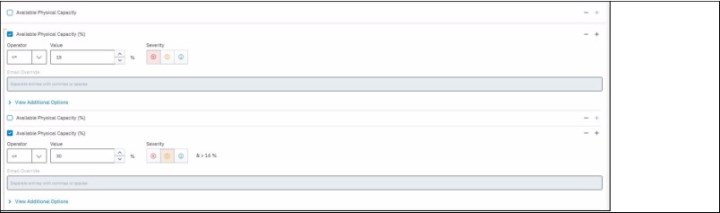
Figure 9-40 Spectrum Control - Alert Definition 30% Available Physical Capacity (%) - Warning
Figure 9-41 shows how to set up the Notification Threshold at 30%.; that is, Operator: “<=”, Value: “45%”, and Severity “Notification”.

Figure 9-41 Spectrum Control - Alert Definition 45% Available Physical Capacity (%) - Notification
Figure 9-42 shows how to open the Notification Settings in Spectrum Control.

Figure 9-42 Spectrum Control - Notification Settings
|
Note: With IBM Storage Insights, you can send emails only.
|
9.6 Error condition example
This section discusses an error condition example.
9.6.1 Offline Fibre Channel port in the management GUI
This section shows an example of an offline Fibre Channel port that is analyzed through the management GUI. It also shows how you can identify the error and drill down into the details.
By using the management GUI dashboard, you can detect errors in the System Health tile.
Each tile contains one type of component, but it can contain multiple items of the same type. For example, a Fibre Channel port is a component; therefore, it is contained in a tile. However, the Fibre Channel tile can contain multiple Fibre Channel ports.
Tiles with errors and warnings are displayed first so that components that require attention have higher visibility. Healthy tiles are sorted in order of importance in day-to-day use.
The following categories of tiles are available:
•Hardware components display the health of all components that are specific to the physical hardware.
•Logical components display the health of all logical and virtual components in the management GUI.
•Connectivity components display the health of all components that are related to the system’s connectivity and the relationship between other components or systems.
For more information, see this IBM Documentation web page.
An example of the System Health tile is shown in Figure 9-43.

Figure 9-43 System Health state FlashSystem management GUI
More information about the system health state can be displayed by expanding the components, as shown in Figure 9-44

Figure 9-44 Expanded components of the system health tiles in the FlashSystem management GUI
The More Details feature provides an overview overall Fibre Channel ports. Figure 9-45 shows an example of the management GUI that represents the physical and virtualized offline and online Fibre Channel ports.
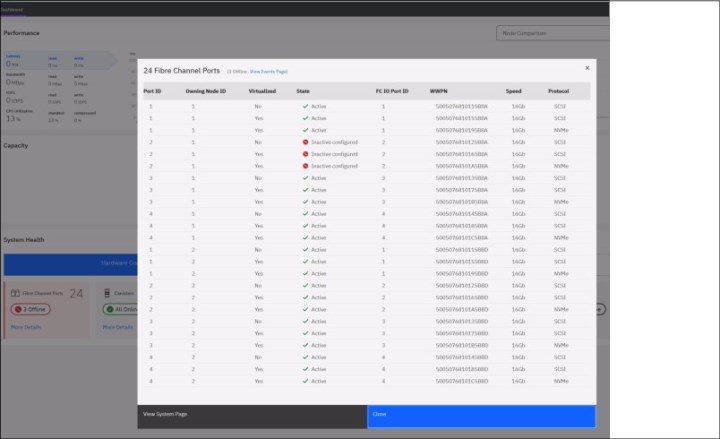
Figure 9-45 More information about expanded system health tiles in FlashSystem management GUI
Figure 9-46 shows an example of cluster error code 1061/1450: Fibre Channel ports or Fibre Channel I/O ports not operational FlashSystem management GUI.

Figure 9-46 Cluster error code 1061/1450
With all these details of the affected Fibre Channel port, the physical components (SFP of the FlashSystem, cable, and the SFP of the SAN Switch) must be checked.
9.6.2 Offline FC-Ports in IBM Spectrum Control and IBM Storage Insights
In this section, we present an example of an IBM FlashSystem with offline FC-Ports in IBM Spectrum Control and IBM Storage Insights. It represents how you can spot the error and drill down into the details.
Figure 9-47 shows the dashboard in which three errors (overall added Block Storage Systems) are detected in IBM Spectrum Control. The Block Storage Systems dashboard also shows the product in an Error condition by highlighting it with a red X in the Condition column.

Figure 9-47 Error condition in Spectrum Control
|
Note: Unless otherwise noted, there is no difference from IBM Spectrum Control to IBM Storage Insights for the steps that are shown next.
|
The overview page of the IBM FlashSystem product (double-click the device as shown in Figure 9-47) gives you more information about the error condition and the affected layer.
Figure 9-48 shows the error condition of FS9200-1 and denotes the error reported for FC Ports.
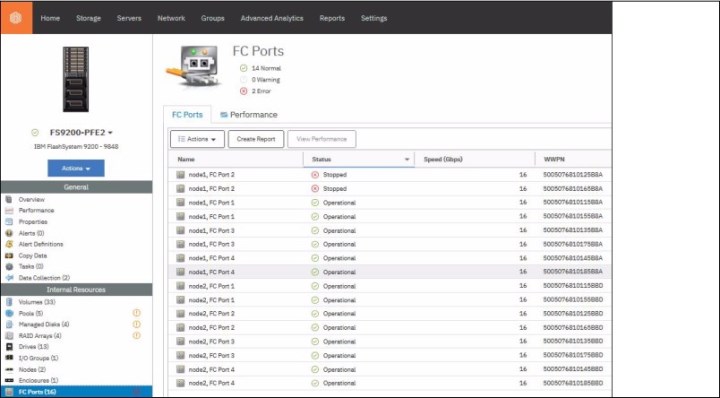
Figure 9-48 FC Ports of “FS9200-1” in Spectrum Control
Figure 9-48 also shows details of the storage subsystem and which entity is affected. In this case it is related to internal resources: ports. Two ports were stopped and caused this condition in the environment.
Figure 9-49 shows the details of one of the stopped ports.
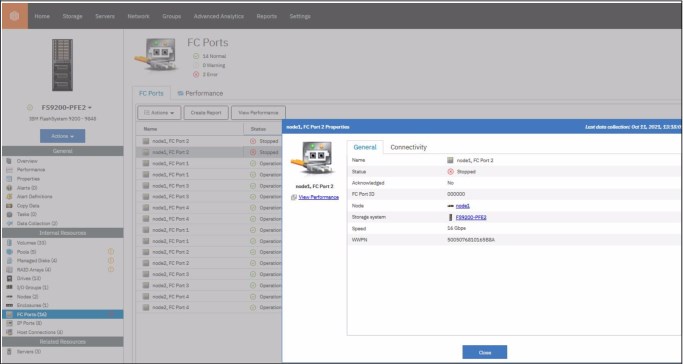
Figure 9-49 FC Ports properties of “FS9200-1” in Spectrum Control
The ports are likely stopped for a reason; therefore, from the window that is shown in Figure 9-48 on page 436 select both, click Actions and then, select Mark Status as Acknowledged (see Figure 9-50) or right-click the affected part and Mark Status as Acknowledged (Figure 9-51). The ports are still shown with the red icon, but now the icon is overlaid with a checkmark. After a short time, this change is propagated so that the storage system is shown as being in a green status again.

Figure 9-50 Mark Status as Acknowledged per Actions drop down menu in Spectrum Control

Figure 9-51 Mark Status as Acknowledged per right click in Spectrum Control
|
Note: If you have Spectrum Control and Storage Insights running, the acknowledgment needs to be done in both instances.
|
In other cases, you might have to replace hardware after you open a ticket in your internal system with the vendor. You should still acknowledge the status so that any other errors make the storage system go from green to red again and you see that a second event occurred.
9.7 Important metrics
The following metrics are some of the most important metrics that must be analyzed to understand a performance problem in IBM FlashSystem systems. Those metrics are valid to analyze the front end (by node, by host, or by volume) or the back-end (by MDisk or by Storage Pool):
|
Terminology: R/W stands for Read and Write operations.
|
•I/O Rate R/W: The term I/O is used to describe any program, operation, or device that transfers data to or from a computer, and to or from a peripheral device. Every transfer is an output from one device and an input into another. Typically measured in IOPS.
•Data Rate R/W: The data transfer rate (DTR) is the amount of digital data that is moved from one place to another in a specific time. In case of Disk or Storage Subsystem, this metric is the amount of data that is moved from a host to a specific storage device. Typically measured in MB per second.
•Response time R/W: This is the time taken for a circuit or measuring device, when subjected to a change in input signal, to change its state by a specified fraction of its total response to that change. In case of Disk or Storage Subsystem, this is the time that is used to complete an I/O operation. Typically measured in ms.
•Cache Hit R/W: This is the percentage of times that read data or write data can be found in cache or can find cache free space that it can be written to.
•Average Data Block Size R/W: The block size is the unit of work for the file system. Every read and write is done in full multiples of the block size. The block size is also the smallest size on disk that a file can have.
•Port-to-Local Node Queue Time (Send): The average time in milliseconds that a send operation spends in the queue before the operation is processed. This value represents the queue time for send operations that are issued to other nodes that are in the local cluster. A good scenario has less than 1 ms on average.
•Port Protocol Errors (Zero Buffer Credit Percentage): The amount of time, as a percentage, that the port was not able to send frames between ports because of insufficient buffer-to-buffer credit. The amount of time value is measured from the last time that the node was reset. In Fibre Channel technology, buffer-to-buffer credit is used to control the flow of frames between ports. In our experience less is better than more. However, in the real life this metric can be from 5% on average up to 20% peak without affecting performance.
•Port data rate (send and receive): The average amount of data in MBps for operations in which the port receives or sends data.
•Port Protocol Errors (Zero Buffer Credit Timer): The number of microseconds that the port is not able to send frames between ports because there is insufficient buffer-to-buffer credit. In Fibre Channel technology, buffer-to-buffer credit is used to control the flow of frames between ports. Buffer-to-buffer credit is measured from the last time that the node was reset. This value is related to the data collection sample interval.
•Port Congestion Index: The estimated degree to which frame transmission was delayed due to a lack of buffer credits. This value is generally 0 - 100. The value 0 means that there was no congestion. The value can exceed 100 if the buffer credit exhaustion persisted for an extended amount of time. When you troubleshoot a SAN, use this metric to help identify port conditions that might slow the performance of the resources to which those ports are connected.
•Global Mirror (Overlapping Write Percentage): The percentage of overlapping write operations that are issued by the Global Mirror primary site. Some overlapping writes are processed in parallel, and so they are excluded from this value.
•Global Mirror (Write I/O Rate): The average number of write operations per second that are issued to the Global Mirror secondary site. Keep in mind that IBM FlashSystem systems have a limited number of GM I/Os that can be delivered.
•Global Mirror (Secondary Write Lag): The average number of extra milliseconds that it takes to service each secondary write operation for Global Mirror. This value does not include the time to service the primary write operations. Monitor the value of Global Mirror Secondary Write Lag to identify delays that occurred during the process of writing data to the secondary site.
|
Note: The host attributed response time also is an important metric, which should be used with IBM Spectrum Control V5.3.3 or higher. Previous versions featured a calculation error.
Version 5.2.x is not supported as of September 30, 2019.
|
Many others metrics are supplied to IBM Spectrum Control from IBM SAN Volume Controller. For more information about all metrics, see this IBM Documentation web page.
9.8 Performance diagnostic information
If you experience performance issues on your system at any level (Host, Volume, Nodes, Pools, and so on), consult IBM Support, who require detailed performance data about the IBM Spectrum Virtualize system to diagnose the problem. Generate a performance support package with detailed data by collecting a Snap by using IBM Spectrum Control or IBM Storage Insights.
9.8.1 Performance diagnostic information included in a Snap
During the process of generating a snap (click Settings → Support Package → Download Support Package), all performance diagnostic statistics of each node also are captured.
A maximum of 16 files are stored in a directory at any one time for each statistics file type.
Depending on the configured startstats interval, the performance statistics are captured frequently.
Use the startstats command (see Example 9-5) to modify the interval at which per-node statistics for volumes, managed disks (MDisks), and nodes are collected.
Example 9-5 startstats command
IBM_IBM_FlashSystem:FS9200-1:superuser>lssystem |grep frequency
statistics_frequency 1
IBM_IBM_FlashSystem:FS9200-1:superuser>startstats -interval 5
IBM_IBM_FlashSystem:FS9200-1:superuser>lssystem |grep frequency
statistics_frequency 5
If an interval of 5 minutes (default value) is configured, a time frame of 80 minutes (5min*16 = 80 minutes) in the past is covered by a snap.
|
Note: The lower the value for the interval is set, the shorter is the time frame that is covered in the performance statistics of the snap. However, the statistic values are much more precise. With a large interval value, a larger time frame is covered, but the performance statistic values are to some way imprecise and some peaks might not be visible.
|
9.8.2 Performance diagnostic information exported from IBM Spectrum Control
You can export performance diagnostic data for a managed resource. You might be asked to send this data if you contact IBM Support to help you analyze a performance problem with storage systems or fabrics.
The performance data might be large, especially if the data is for storage systems that have many volumes, or the performance monitors are running with a 1-minute sampling frequency. If the time range for the data is greater than 12 hours, volume data and 1-minute sample data is automatically excluded from the performance data, even if it is available.
When you export performance data, you can specify a time range to export performance data for. The time range cannot exceed the history retention limit for sample performance data. By default, this history retention limit is two weeks.
To export hourly or daily performance data, use the exportPerformanceData script. However, the time range still cannot exceed the history retention limits for the type of performance data.
Complete the following steps:
1. In the menu bar, select the type of storage system.
For example, to create a compressed file for a block storage system, select Storage → Block → Storage Systems.
2. To create a compressed file for a fabric, click Network → Fabrics.
3. Right-click the storage resource, and then, click Export Performance Data (see Figure 9-52 on page 441).
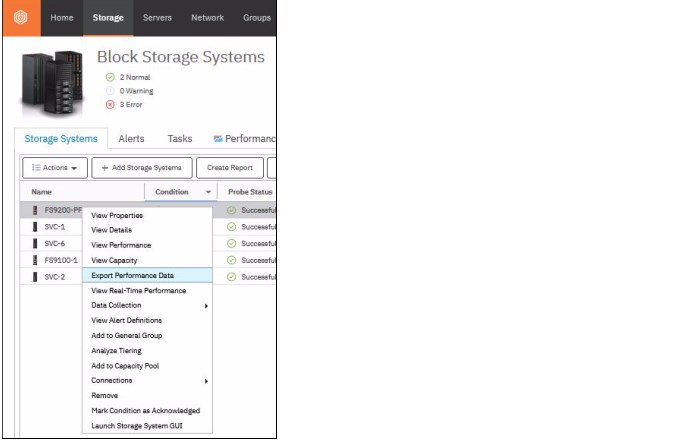
Figure 9-52 Spectrum Control - Export Performance Data
To include volume data and 1-minute sample data, select the Advanced package (see Figure 9-53) option when you export performance data.

Figure 9-53 Spectrum Control - Export Performance Data - Advanced Export
After the package is created, the .zip file can be downloaded through the browser. The package includes different reports in .csv format, as shown in Figure 9-54.

Figure 9-54 Spectrum Control - Package files example
For more information about how to create a performance support package, see this IBM Documentation web page.
9.8.3 Performance diagnostic information exported from IBM Storage Insights
To help resolve performance issues with storage systems, you can also export performance data for the resource to a compressed file from IBM Storage Insights. Complete the following steps:
1. To export the performance data, select the type of storage system in the menu bar.
For example, to create a compressed file for a block storage system, select Resources → Block Storage Systems (see Figure 9-55).

Figure 9-55 Selecting Block Storage Systems

Figure 9-56 Export Performance Data
3. Select the time range of the performance data that you want to export. You can select a time range of the previous 4, 8, or 12 hours, or specify an earlier time range by clicking the time and date.
Because the amount of performance data might be large (especially for storage systems that have many volumes), volume data is exported only if the time range is less than 12 hours. For time ranges of 12 or more hours, click Advanced export to include volume data.
4. Click Create.
A task is started and shown in the Running tasks icon in the menu bar.
5. When the task is complete, click the Download icon in the running tasks list in the task to save the file locally.
For more information about how to create a performance support package, see this IBM Documentation web page.
9.9 Metro and Global Mirror monitoring with IBM Copy Services Manager and scripts
Copy Services Manager is part of IBM Spectrum Control and controls copy services in storage environments. Copy services are features that are used by storage systems, such as IBM FlashSystem systems, to configure, manage, and monitor data-copy functions. Copy services include IBM FlashCopy, Metro Mirror, Global Mirror, and Global Mirror Change Volumes (GMCV).
You can use Copy Services Manager to complete the following data replication tasks and help reduce the downtime of critical applications:
•Plan for replication when you are provisioning storage
•Keep data on multiple related volumes consistent across storage systems if there is a planned or unplanned outage
•Monitor and track replication operations
•Automate the mapping of source volumes to target volumes
One of the most important events that needs to be monitored when IBM FlashSystem systems are implemented in a disaster recovery (DR) solution with Metro Mirror (MM) or Global Mirror (GM) functions, is to check whether MM or GM has been suspended because of a 1920 or 1720 error.
With IBM FlashSystem systems, you can suspend the MM or GM relationship to protect the performance on the primary site when MM or GM starts to affect write response time. That suspension can be caused by several factors.
IBM FlashSystem systems do not restart MM or GM automatically. They must be restarted manually.
IBM FlashSystem systems alert monitoring is explained in 9.1.1, “Monitoring by using the GUI” on page 388. When MM or GM is managed by IBM CSM and if a cluster error code 1920 occurs, IBM CSM can automatically restart MM or GM sessions, and can set the delay time on the automatic restart option. This delay allows some time for the situation to correct itself.
Alternatively, if you have several sessions, you can stagger them so that they do not all restart at the same time, which can affect system performance. Choose the set delay time feature to define a time, in seconds, for the delay between when Copy Services Manager processes the 1720/1920 event and when the automatic restart is issued.
CSM is also able to automatically restart unexpected suspends. When you select this option, the Copy Services Manager server automatically restarts the session when it unexpectedly suspends due to reason code 1720 or 1920. An automatic restart is attempted for every suspend with reason code 1720 or 1920 up to a predefined number of times within a 30-minute time period.
The number of times that a restart is attempted is determined by the storage server gmlinktolerance value. If the number of allowable automatic restarts is exceeded within the time period, the session does not restart automatically on the next unexpected suspend. Issue a Start command to restart the session, clear the automatic restart counters, and enable automatic restarts.
|
Warning: When you enable this option, the session is automatically restarted by the server. When this situation occurs, the secondary site is not consistent until the relationships are fully resynched.
|
You can specify the amount of time (in seconds) that the copy services management server waits after an unexpected suspend before automatically restarting the session. The range of possible values is 0 - 43200. The default is 0, which specifies that the session is restarted immediately following an unexpected suspend.
9.9.1 Monitoring MM and GM with scripts
The IBM FlashSystem system provides a complete command-line interface (CLI), which you can use to interact with your systems by using scripts. The scripts can run in the IBM FlashSystem shell, but with a limited script command set available, or they can run out of the shell using any preferred scripting language.
An example of script usage is one to check at a specific interval time whether MM or GM are still active, if any 1920 errors have occurred, or to react to an SNMP or email alert received. The script can then start some specific recovery action based on your recovery plan and environment.
Customers who do not use IBM Copy Service Manager have created their own scripts. These scripts are sometimes supported by IBM as part of ITS professional services or IBM System Lab services. Tell your IBM representative what kind of monitoring you want to implement with scripts, and together try to find if one exists in the IBM Intellectual Capital Management repository that can be reused.
9.10 Monitoring Tier1 solid-state drives
Monitoring Tier1 SSDs requires that special attention must be paid to the endurance events that can be triggered. For monitoring purposes, make note of the new fields that are listed in Table 9-5.
Table 9-5 Field changes to drive and array devices
|
Field
|
Description
|
|
write_endurance_used
|
Metric pulled from within drive (SAS spec) relating to the amount of data that is written across the life of the drive that is divided by the anticipated amount (2.42 PB for the 15.36 TB drive)
Starts at 0, and can continue > 100
|
|
write_endurance_usage_rate
|
Measuring/Low/Marginal/High
Takes 160 Days to get initial measurement;
Low: Approximately 5.5 Years or more
Marginal: Approximately 4.5 – 5.5 Years
High: Approximately < 4.5 years
High triggers event SS_EID_VL_ER_SSD_WRITE_ENDURANCE_USAGE_RATE_HIGH
|
|
replacement_date
|
The Current Date + Endurance Rate * Remaining Endurance
Triggers event SS_EID_VL_ER_SSD_DRIVE_WRITE_ENDURANCE_LIMITED at 6 Months before limit
|
If you see either of these triggered events, contact your IBM service representative to put an action plan in place:
SS_EID_VL_ER_SSD_WRITE_ENDURANCE_USAGE_RATE_HI4GH
SS_EID_VL_ER_SSD_DRIVE_WRITE_ENDURANCE_LIMITED
..................Content has been hidden....................
You can't read the all page of ebook, please click here login for view all page.