The Motivation for Implementing Lean
We begin this chapter by establishing the link between process lead time and work-in-process inventory. Specifically, we explain how reducing process lead time also reduces work-in-process inventory. While reducing work-in-process is a fundamental goal of some Lean projects, it is not the main goal of all projects. So in the remainder of the chapter we document how reducing lead time improves many other important business metrics in various industries.
Lead Time and Work-in-Process
We begin with an intuitive example that serves as an analogy to the business contexts that we will subsequently discuss. This analogy considers a pipe that carries water, which might be the water that fills a swimming pool or water used in making paper or another manufactured material. Specifically, consider two such pipes as shown in Figure 3. Both pipes have identical diameters and carry water at the same flow rate (gallons per minute). Since they have the same diameters and flow rates, we know that a drop of water flowing down the center of the pipe would have the same average velocity in both pipes. Thus the time to traverse the longer pipe, intuitively, takes a greater amount of time than a drop flowing down the shorter pipe.

Figure 3. Two pipes for carrying water.
Now, we ask the question, which pipe has more water in it? (No, this is not a trick question.) Of course, the longer pipe has more water in it than the shorter pipe: Although both pipes do the same work (gallons per minute delivered), the longer pipe has a greater volume. Therefore, the longer pipe holds more water and requires more time to traverse, whereas, conversely, the shorter pipe holds less water and takes less time to traverse. The correlation between amount of water in the pipe and the time to get through the pipe is not accidental and carries over generally to the business processes that we consider in the remainder of this chapter and, indeed, to all processes.
For those who prefer to think in mathematical terms, we can describe the situation with the long and short water pipes, and the relationship between lead time and work-in-process, with a mathematical formula. Little’s law is a mathematical law of physical processes (named after John Little, who proved this law) that states that the average work-in-process inventory (I) is equal to the product of the average processing rate (R) and the average process lead time (T):
I = R × T
I is measured in units of whatever entity flows through a process, T is measured in time, and R is measured in units per time increment (e.g., units per minute, units per hour, units per year).
The only practically relevant requirements for this formula to be true are the following:
- The quantities I, R, and T must be averages.
- The flow into the process over the long run must equal the flow out of the process.
Averages must be calculated over many observations. For example, one can estimate the average inventory by observing inventory on many different occasions and then averaging those values. Similarly, the average lead time might be computed by observing the lead time of many units that flow through a process and then averaging those values. An average rate can be calculated by dividing the number of units completed by the process over some duration by the length of time over which the observations were made. We cannot expect Little’s law to hold when our measurement of I is a single observation, when R is computed over a short time duration, or T is based on a single or a small number of observations.
Issues arise if the flow into and out of the process are not the same, as stated in one of our assumptions. First, we observe that it would be difficult to apply Little’s law in this case because it requires one value of R: Should the inflow or outflow rate be used for R? The confusion that arises when the inflow rate differs from the outflow rate of the process is a sign that Little’s law cannot be applied in this case. Indeed, if more goods flow into a manufacturing operation than are completed, we should expect to see an ever-increasing inventory level within the plant. In that case, no value of R used in Little’s law could predict I.
The main point of discussing water pipes and Little’s law is to demonstrate that in-process inventory and lead time are inextricably linked. If the processing rate R is held constant over time, then Little’s law demonstrates that the average lead time (T) is proportional to the average inventory level (I). Thus although Lean focuses on reducing lead time, we can clearly see how another benefit is derived: Reducing lead time T reduces inventory I. In manufacturing processes, the benefits of reduced inventory are clear: Reduced investment and improved quality are two such benefits. In processes where entities other than manufactured goods flow through the process, the work-in-process that is reduced might be invoices that are being issued, medical patients, or project proposals. We will see in the examples that follow how reducing inventory in these cases improves business performance.
The Value of Lead Time Reduction in Various Industries
Metrics are numerical measures that answer the question “How well is our company performing?” Companies use many metrics to judge their performance. Examples include the following:
- Profit
- Cost
- Sales levels
- Return on investment and assets
- Working capital level
- Product or service quality
- Cost of rework and warranty repair
- On-time delivery
- Fulfillment accuracy (shipping the right quantities of the right products)
- Inventory levels or inventory turns
- Labor efficiency and productivity
- Cases processed per person per hour
- Order to delivery time
- Time required to develop and introduce new products and services
The appropriate metrics vary with the industry, the type of process, and managerial goals. For example, while measures of efficiency and productivity are ubiquitous, the specific measure used in distribution center operations (cases per hour) is different than you would find in manufacturing operations (e.g., cars per labor hour). In addition, we would expect that the portfolio of metrics used in a manufacturing operation would be tailored to a particular company’s strategy, which differs company to company.
In chapter 1 we described Lean as a methodology for reducing the lead time required to execute the steps of a process. Of the metrics listed previously, only two describe the lead time of a process (the last two metrics in the list). A reader might wonder at this point, therefore, how effective Lean would be when most metrics of interest to companies are not time-based metrics. One of the goals of this chapter is to show that although Lean focuses on reducing lead time, it indirectly influences most, if not all, of a company’s important metrics. Exposing the connection between lead time and other metrics in the examples that follow helps managers see the value of Lean for their business and might, perhaps, motivate them to adopt it. The examples come from a variety of industries that use different metrics, and we will describe how reducing lead time also improves the relevant metrics in each context.
Manufacturing
Consider, for example, the manufacture of automobiles in an assembly plant. The processing steps in the assembly plant can be thought of as a pipeline through which cars flow. Just as in the pipelines that carried water, the longer the automobile pipeline, the greater the number of cars in the pipeline. Thus, in manufacturing, longer processing lead times also imply a higher level of work-in-process inventory.
Higher levels of inventory increase costs in a number of ways:
- An investment in inventory for which customers have not yet paid causes a financial carrying cost: Either interest payments are required for money borrowed to finance the inventory, coupon payments must be made on bonds, stock dividends must be paid on stock or, if inventory is self-financed, the financial return on alternative investments is foregone.
- As inventory levels increase, quality decreases. A good rule of thumb is the longer goods stay in process, the greater the opportunity for them to be damaged through mishandling, being misplaced, or being stolen. People who have worked in manufacturing have many tales about work-in-process, or finished goods, being hit by forklifts, dropped, or damaged in any number of ways.
- Damage during storage is one way increased inventory levels increases rework and scrap costs. In addition, the greater the quantity of work-in-process inventory between two workstations, the greater the number of units that need to be repaired when a manufacturing defect is discovered.
- In-process inventory also exposes a company to other potential costs, such as obsolescence or the cost of engineering changes. When a product’s design changes parts, in-process inventory must either be reworked or scrapped, and the cost of either rework or scrap increases with the number of units in process that are not yet finished.
- Other costs are borne in industries where component costs decline rapidly. For example, some high-value electronic components have decreased historically at a rate of 1% per week, while the selling prices of finished products decline. Therefore, the longer inventory stays in process, the higher the cost of material and the lower the price that the customer will pay for finished products made with more expensive parts: Margin is squeezed on both sides of the profit equation.
- Labor efficiency decreases with increased inventory: Although the output and revenue of a company are not enhanced, the added operations to move, rework, and remanufacture goods add unnecessary cost.
A case study from Harvard Publishing about LanTech, which makes stretch wrap machines1 for manufacturing and distribution companies, gives a good illustration of the causes of excess inventory in manufacturing.2 More to the point of this chapter, it clearly demonstrates the link between reduced inventory and improved quality. While LanTech sought to reduce their process lead time, which they did by over 90%, they found that the number of defects per unit decreased from 8 defects per unit to 0.8 defects per unit. This may be surprising to some, since process improvement did not focus on quality at all. Quality improvement was a natural by-product of the lead time reduction for some of the reasons mentioned previously.
Distribution
Once manufactured, products need to be made available to customers. “Distribution” is the name given to this function. Large retailers, for example, often manage their own networks of facilities for distribution composed of regional distribution centers (RDCs) that supply stores, central distribution centers (CDCs) that supply RDCs, and import distribution centers (IDCs) that receive imported goods and then ship them to either CDCs or RDCs. Other supply chain facilities might include cross-docking facilities that receive containers from overseas, each with large quantities of a few items, and transfer those goods onto many trailers, each with small quantities of many goods destined for retail stores or RDCs. One example of such a global supply chain is shown in Figure 4. Companies that sell a range of products with different characteristics and handling needs might have separate supply chains for different types of goods. For example, grocery items, especially those that must be refrigerated, might be distributed through a different set of facilities than dry goods, such as hardware, electronics, toys, and furniture, as would be handled by the supply chain in Figure 4.
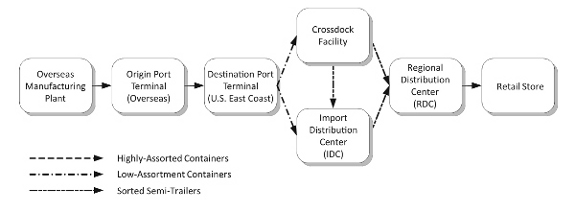
Figure 4. Global retail distribution supply chain.
Distribution might be described as a necessary evil. Getting goods from the point of manufacture to the market is necessary to get the goods to the customers, although the goods in distribution serve no useful business purpose until they get to the retail stores—you can’t sell goods to customers from a distribution center’s shelves. Any excess goods in transit, therefore, cause unnecessary costs, many of the same type described previously for manufacturing processes. In distribution networks where reducing unproductive inventory is a focus, it is clear that focusing on reducing lead time is effective given the prior discussion in this chapter. Consequently, one finds in distribution many metrics called “level of service” metrics, which specify the maximum time allowed to complete any one step of the distribution process. While one might not immediately guess what these metrics are from the name, they explicitly motivate people to quickly move goods along their way. Thus these distribution metrics are perfectly aligned with Lean.
In addition, a shorter replenishment lead time, which is a term used to describe how much time passes from the time an order is placed by a retail store until the order is delivered from the RDC, implies greater responsiveness. Quick replenishment of the retail store in response to unusually high sales volumes helps the retail store reduce how much inventory it needs to carry for demand spikes while still satisfying a high percentage of customers with a product they want, when they want it. Furthermore, greater responsiveness can also imply that the retail store will run out of goods less often, which increases revenue.
Service Industries
In contrast to manufacturing processes, the term “service process” is often used to describe a series of steps executed to provide a customer with something other than a physical product. Some examples include a call center to respond to software problems, food service, grounds maintenance, home repair services, credit card services, and governmental services such as providing building permits. In manufacturing and distribution, what flows through the process are physical entities—that is, manufactured goods. In service industries, one might envision the customer themselves flowing through the process when they need to be physically present or, perhaps, the customer’s request flowing through the system, which eventually results in something being done for the customer. In a movie theater line, it is the customer who waits until it is his or her time to be served. In other cases, what flows through the system is either paperwork or some electronic representation of the customer’s request: A heating and air conditioning repair service would have a written or electronic list of customers awaiting service and information about what their problems were. The longer either customers or some manifestation of their need waits in the pipeline, the longer any one customer waits to be served, and we would expect in most cases that customer satisfaction and the prospects for future business would decrease.
Also, as implied by Little’s law, the number of customers who are waiting for service at any one time increases as the average customer wait time increases. Thus reducing the average waiting time of customers also reduces the average number of customers who are waiting. Are there any benefits in reducing the number of customers who are waiting? Sometimes waiting customers increase operations cost just as inventory that is waiting increases manufacturing cost. For example, where customers are inclined to use the telephone or send e-mail messages to ask “when will I be served,” more people in the queue implies greater costs for call centers or whatever process might handle these requests. In another context, a customer’s call to an auto parts store to inquire about the status of a special order causes sales associates to perform work. The longer the delivery time for the part, the greater the number of calls the customer is likely to make and the greater will be the workload on the sales associates.
Administrative Processes
Administrative processes might be defined as processes that businesses must execute even though they generate no revenue. For example, companies must hire employees, submit tax documents, file environmental reports, and train employees on technical, health, and safety issues. These activities, however, do not contribute to sales; rather, they add to cost. When Lean is used to address such processes, it reduces not only the length of time required to accomplish a task, such as the time required to hire a new employee, but also the effort required on the part of employees and the concomitant cost. In addition, opportunities to reduce the number of errors are routinely exposed in administrative processes when Lean is applied such that quality and customer satisfaction can be improved and the costs associated with mitigating errors can be eliminated.
Benefits of applying Lean to administrative processes are likely to vary with the process, but they can be significant. For example, consider the process used to prepare invoices to send to customers. Keeping our short and long pipes in mind, an invoice preparation process that takes a longer time will have more unfinished invoices in it. Since a customer’s payment clock starts ticking only when they receive the invoice, the greater the number of unfinished invoices, the greater the requirements are for funding the cost of products and services provided for which no cash has yet been received—in other words, cash flow suffers. Thus a company is in a revenue-deficit position that is directly proportional to how long it takes to issue invoices. This causes the financial structure of a company to be weakened and more working capital to be financed through loans, bonds, or stock or more of the company’s own cash to be invested in the business. Each of those financing instruments has its costs that the company must bear.
Sales
We have already mentioned how reducing lead time in distribution networks can increase sales because goods can be available on retail shelves a higher percentage of time while the retailer needs to carry less inventory. In some industries, companies play a more active role in generating sales than to merely reliably stock the shelves so that customers can find what they are looking for as they peruse the shelves at their convenience. In other industries, sales are garnered only when a company successfully completes an application for a new sale. Companies that are building new manufacturing sites, for example, would issue a request for quotation (RFQ) that invites general contractors to specify the price that they would charge for completing the project. A bidder would also typically specify quality attributes of the completed project, a construction timeline, and other data requested in the RFQ. When issued, an RFQ specifies the date by which bidders must submit these responses.
Successfully submitting a response to an RFQ and eventually being awarded the job requires, at a minimum, that the response be filed on time and that all required information is specified in the response. From the bidder’s perspective, the information they provide must also be accurate: Too high a price will cause the opportunity to be lost, too low a price will possibly win the contract but cause a financial loss, and promising delivery dates and quality levels that are not met will jeopardize later business.
The requirement to file RFQ responses on time is directly in line with Lean’s objective of reducing lead time. An ancillary benefit of reducing the lead time for responding to an RFQ is that a company would submit more responses on time and, subsequently, win a greater percentage of the possible contract opportunities, thus increasing revenues. The author’s experience in applying Lean to RFQ processes is that reduced lead time of preparation also leads to fewer errors that cause companies not to successfully generate new business or that are costly to resolve.
Health Care Processes
The health care system is currently a focus of much attention as health care costs continue to increase. Recently, Lean has increasingly been applied to health care processes to both increase efficiency and to reduce errors, which in this field can result in death. Focusing on reducing the lead times of these critical health care processes leads to improved health care outcomes due to more prompt and more appropriate treatment through:
- Reduced lead time for diagnosed patients to start appropriate treatment;3
- Patient’s reduced lead time through their treatment process;
- Reduced lead time to process and administer prescription medications in the hospital or on an outpatient basis;
- Improved nursing processes in hospitals.
In addition, the effectiveness of Lean in reducing errors in health care has been documented.4 Because Lean also reduces the cost of operations in hospitals and other health care facilities, patient care improves while cost is reduced. Costs are reduced or, alternatively, revenue is increased in these ways:
- Reducing the lead time to change an operating room over from one surgery to another reduces hospital costs, increases revenue generation from facilities, and improves patient outcomes by reducing errors.
- A more efficient and timely replenishment system for medical supplies increases the availability of supplies when they are needed while reducing the number of supplies purchased.5
Conclusions
We have shown in this chapter that, regardless of the industry, reducing process lead time improves business performance. If the types of benefits we have described are valuable for the company where you work or a company that you own, then implementing Lean may be an important tool to help improve your business processes.
Before the 1950s, it was commonly thought that increasing quality required higher cost. Similarly, our intuition might lead us to think that reducing lead time must make other business metrics worse. However, Philip Crosby argued in his famous book, Quality Is Free,6 that contrary to the popular belief at the time, quality can most often be improved at the same time cost is reduced. That is, improving quality does not increase manufacturing cost. Similarly, the examples we have given show that there is most often not a trade-off between lead time and other business metrics: If we reduce lead time with Lean, then other business metrics improve as well. Moreover, the upfront investment to implement improvements found through Lean is often small, making the return on investment of Lean high.
We have discussed the benefits of Lean in this chapter, but we have not discussed the costs of Lean or the barriers to implementing Lean, which will be discussed in chapter 5, chapter 7, and chapter 13. The three most frequently encountered barriers to implementing Lean are the following:
- Lean relies on the standardization of processes, which people often resist.
- Many companies operate perpetually with an overwhelming number of imminent or past due deadlines or continually having a barrage of disasters needing attention. Operating in firefighting mode makes it difficult to devote resources to efforts with long-term benefits, such as Lean.
- Applying Lean naturally leads to greater efficiencies. If workers fear that improving greater output per worker will cause the workforce to be reduced, it is difficult to get them to participate in improving processes. This is unfortunate because it is the workers who primarily need to be involved in Lean.
Exercises
- Select something that is done in your workplace or in your personal life and map the process by doing the following:
a. Discover and document the steps that are required to accomplish this task.
b. List the metrics (numerical measures) that would enable you to determine how well this process is being done. Is the process currently being measured by these metrics?
c. Is reducing lead time important to this process? By reducing lead time, what other metrics might be improved?
d. While you were performing the previous steps, did you discover anything about how the process is performed that you did not know before? Were some of the steps difficult to research?
e. As you were listing the sequential steps of the process, did you have any immediate ideas on ways to improve the process?
In your workplace, you might analyze a process in which your company creates and delivers a good or service, or you can analyze an administrative process in which you take part, such as hiring employees, creating or processing invoices, or updating drawings. Alternately, if you are a student and you neither are currently employed nor have held a job in the past on which to base this exercise, think about something that you do every day or every week, such as getting up every morning and coming to school, making dinner, or getting lunch in a café.
- Cars traveling from Richmond to Williamsburg, Virginia, take 1 hour on average to make the trip. Over the course of a day, 15,000 cars per hour on average pass by a checkpoint that is set up between those two points. How many cars are on the road between Richmond and Williamsburg on average?
- An automobile plant produces cars at a rate of 60 cars per hour on average. It takes 1 day (24 hours) on average for a car to make it from the start of the assembly line to the end. How many cars are in process in the plant on average?
- A wildlife scientist measures the number of fish swimming upstream to spawn. During the spawning season, 1,200 fish per hour on average pass the scientist’s checkpoint. It is estimated that 20,000 fish on average are in a certain patch of water. How long does it take for a fish, on average, to swim through that patch of water?
- A manufacturing manager presented his goals for the next year to the division vice president of manufacturing, which included a 25% reduction in average work-in-process inventory level and a 25% reduction in average lead time. The vice president chastised the manufacturing manager for his lack of aggressiveness: Certainly 25% reduction in average lead time was satisfactory, but a much greater reduction in average inventory was needed to meet cost reduction targets. The vice president unilaterally changed the manufacturing manager’s average inventory reduction target to 50%. There were no substantial changes in sales and production volumes planned for the next year and, thus, no planned changes in the production rate. Are the manufacturing manager’s cost and inventory improvement goals consistent with one another? Why or why not? Are the vice president’s inventory and cost reduction targets consistent with one another? Why or why not?
- A manufacturing plant manager is in her annual personnel review meeting with her boss, the division vice president. The vice president asks about the details of the plant manager’s process and performance. The plant manager mentions that it takes her plant 6 months, on average, to build a piece of heavy excavating equipment used in strip mining. In addition, over the past 10 years, the average number of excavators that were built was 12.2 units per year. In addition, she said that the number of units made per year varied from year to year, but the volume did not necessarily seem to be trending either up or down. Currently, the plant manager said that she had 15 units in various stages of production. If you were the division vice president, and you knew Little’s law, would you have any basis to take issue with the consistency of the plant manager’s statements? Why or why not?