
CHAPTER 6
Estimating Activities
AT THIS POINT, YOU HAVE COMPLETED several key parts of project planning. You defined and bounded project scope, developed a project work breakdown structure, and built a network diagram that described the preferred sequence in which activities (work packages) would be performed. This chapter will teach you how to estimate the time, cost, labor resources, material costs, travel expenses, equipment rental, and other costs to accomplish each activity included in the work breakdown structure.
Estimates are predictions and have varying degrees of confidence. Predictions rest on assumptions and have associated probabilities of coming true. All estimates have some confidence and risk associated with them. Estimates are predictions for three plan parameters:
![]() Time: How long it will take to accomplish the work in terms of hours, days, weeks, or months
Time: How long it will take to accomplish the work in terms of hours, days, weeks, or months
![]() Resources: How many units of labor, equipment, or supplies are likely to be used
Resources: How many units of labor, equipment, or supplies are likely to be used
![]() Cost: How much each work package will cost and how much the entire project will cost
Cost: How much each work package will cost and how much the entire project will cost
The resources required for each work package are estimated and applied to the schedule. This is called resource allocation or resource distribution. If imbalances exist—usually because demand exceeds supply or because requirements exceed capacity—then the process selectively repeats itself. This iteration is called resource smoothing. The net effect is that, in a resource-limited environment, we arrive at a reasoned solution that allocates the right people with the right skills to the right activities at the right time.
The project budget is the WBS expressed in financial terms. In an ideal world, we create a plan-driven budget, not a budget-driven plan. As the planning process goes on, management has several opportunities to fine-tune or to calibrate the relationships among time, cost, and scope. Clearly, the key to this recalibration is the accuracy and usefulness of the estimates for each work package.
Using the Work Breakdown Structure
The work breakdown structure is the foundation for estimating. The WBS is typically constructed from the top down. Functional decomposition progressively gets to smaller and smaller pieces of work until, at last, we get to work packages or activities that are small in size; unique in terms of organizational responsibility; and consumers of time, resources, and cost. These work packages are the basis for estimating.
Work package estimates of time and cost are then rolled up or summarized to create project master plans for schedule, resource usage, and costs. These work packages are then used to monitor and control work, to detect variances from the approved plan, to initiate corrective actions, and to serve as a basis for lessons learned during the project closure process.
It is important to note that a poorly developed or erroneous WBS will create problems when estimating time and cost. For example, any task that is missing from the WBS will not be estimated and not included in the project’s schedule and budget. In which case, you will almost be guaranteed to go over schedule or over budget, or both!
Steps in Estimating Activities
To properly estimate each activity (work package), use the following three steps:
1. For each activity, develop a statement of work that succinctly defines the work to be accomplished in the activity. Then ask team members to complete an estimate for each, supported by the following:
![]() Technical specifications of the end products, such as performance, quality, reliability, survivability, operability, and maintainability.
Technical specifications of the end products, such as performance, quality, reliability, survivability, operability, and maintainability.
![]() Compliance with standards (governmental, institutional, international, and organizational).
Compliance with standards (governmental, institutional, international, and organizational).
![]() Project assumptions, constraints, and exclusions (a description of what is not included in this work package).
Project assumptions, constraints, and exclusions (a description of what is not included in this work package).
2. Ask the functional groups to document how the estimate is made, including assumptions and factors that might affect the validity of the estimate. For example, did the cost projections make allowances for the suppliers’ annual price increases?
3. Review the estimates for all the activities in the project and clear up discrepancies.
Estimating Methods
The four basic methods for estimating activities are analogous, parametric, bottom-up, and simulation.
Analogous (Historical) Approach
This approach uses the actual costs and durations of previous, similar projects as the basis for estimating the current project. Because known historical information is the best source for creating estimates, organizations should build a project database with information on the actual time, cost, and labor used to complete activities. You can then compare the current project against the database. If the new project is easier to do than the standard, revise the estimate downward. If the new project is more complex than the standard, revise the estimate upward.
The analogous approach is also called a top-down estimate, because it relies on information from the top row of activities of the work breakdown structure. It can be used to estimate projects with a limited amount of detailed information. Such an analogous approach is generally less costly than other approaches.
Parametric Modeling
Parametric modeling uses mathematical parameters and industry standards to predict project costs. An example is residential home construction that is often estimated using a specified dollar amount per square foot of floor space. Complex examples can be found in the software development industry, where models use various factors to predict the complexity of the software.
Bottom-Up Estimate
This approach estimates the cost and duration of the individual work packages from the bottom row of activities of the work breakdown structure, then totals the amounts up each row until reaching an estimate for the total project. This approach can produce a more accurate estimate, but at a higher cost to create the estimate.
Simulation
In this approach, a computer calculates multiple costs or durations with different sets of assumptions. The most common is the Monte Carlo method, in which a range of probable results is defined for each activity and used to calculate a range of probable results for the total project. Simulation can provide a more accurate estimate and is principally used on large or complex projects.
Guidelines for Estimating
Estimates should be realistic and achievable. The following are guidelines and considerations for developing good, solid estimates.
Ownership of the Estimate
Generally, the most accurate estimates come from those who are answerable and held accountable for performing the work on the project. If a separate group of estimators is used to create the estimates, the project workers should at least review and validate the estimates for which they will thereafter be held accountable. The reason for this rule is twofold:
1. Subject matter experts (or practitioners) know more about specific work packages than the project manager does. If the project manager is skeptical about the initial estimates received, she should respect the expertise of others.
2. An estimate dictated to a functional group or department from higher up generates little or no loyalty to the estimate by those who perform the work. A project manager who dictates an estimate (for example, “You’ll have to get this done by the fifteenth of next month and your budget is $6,500”) sets everyone up to fail.
When the functional or resource manager cannot predict which employee will be assigned to the work package, then she should assume average performance and productivity of the work group.
Level of Detail
The smaller the unit of work being estimated, the more accurate the estimate is likely to be.
Distribution of Estimates
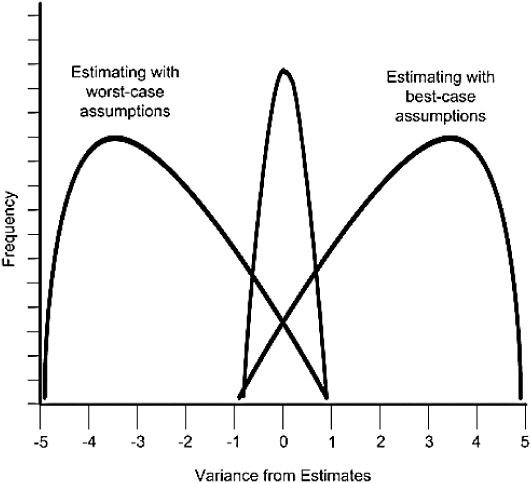
In any scenario, the best estimate has the same likelihood of being over as being under the actual time or cost (normal distribution). Using only the worst-case (pessimistic) estimate generates arbitrarily high estimates. And using the optimistic estimate generates scenarios that are desirable but probably not realistic. The easiest way to grasp this rule is shown graphically in Figure 6-1. This figure has three curves, or distribution patterns, that show estimates against actual results achieved. The three curves reflect three kinds of estimators.
The worst-case estimator is represented by the curve on the left of the graph. On a regular basis, this estimator presents estimates for work packages and then routinely beats the estimates. Initially, this seems to be a positive outcome, but it has several genuine flaws:
Figure 6-1 The Distribution of Estimates.
![]() Estimates routinely commit the organization’s resources that could have been used elsewhere.
Estimates routinely commit the organization’s resources that could have been used elsewhere.
![]() The organization may incur unforeseen costs for inventory storage, product obsolescence, or decay and malfunction.
The organization may incur unforeseen costs for inventory storage, product obsolescence, or decay and malfunction.
![]() If the estimates are needed to attract new business, none will materialize because the prospective customers see too high a price or bear too great a share of the risk.
If the estimates are needed to attract new business, none will materialize because the prospective customers see too high a price or bear too great a share of the risk.
Estimators in this field need coaching to help them learn to take prudent risks when asked to estimate.
The overly optimistic estimator is represented by the curve on the right of the graph. Looking at life through rose-colored glasses, she estimates work packages on assumptions of a best-case scenario. Regrettably, this type of estimator makes promises that do not materialize because risks were neither identified nor quantified. The net result is the distribution pattern where activities are completed later than they should be, use more resources than were planned, and cost more than the approved budget. The net effect is that the anticipated benefit streams, regardless of how they are calculated, do not materialize, and the customer is disappointed in the project’s return on investment.
The ideal estimator is represented by the middle curve, which shows little variance (0, plus or minus 1) and has no left or right skew. In short, what was estimated is what routinely occurred with only minimal variances both over and under the estimates.
The distribution-of-estimates guideline suggests that we (1) do not politicize estimates in an attempt to make supervisors, customers, or clients happy; (2) tell the truth; (3) negotiate requirements first and budgets second; and (4) provide estimates that are neither too lean nor too heavy.
Human Productivity
People cannot be expected to perform their activities with uniform production over a business day. When considering an eight-hour workday, be sure to consider the following:
![]() Lost productivity when shifting from working on one project or task to another
Lost productivity when shifting from working on one project or task to another
![]() Variations in productivity across workers due to skill levels and individual capabilities
Variations in productivity across workers due to skill levels and individual capabilities
![]() Lower productivity during certain hours of the day and during extended shifts
Lower productivity during certain hours of the day and during extended shifts
![]() Missed productivity from vacations, sick leave, holidays, meetings, and training
Missed productivity from vacations, sick leave, holidays, meetings, and training
Time/Cost/Resource Trade-Off
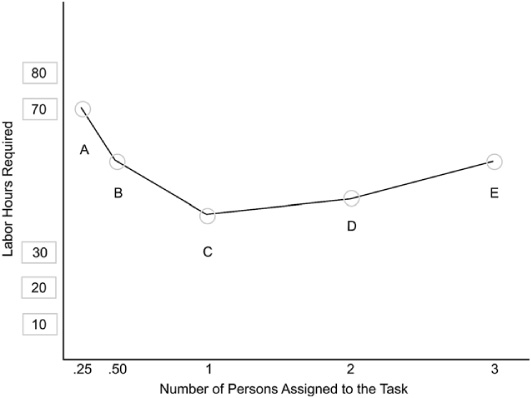
There is a trade-off among time, cost, and resource hours needed for a work package. The relationship is illustrated in Figure 6-2. Assume an activity could be done by one practitioner working without interruption over the course of a week. The cost per hour for this expert is $75. The estimate for this work package becomes:
Time = 5 days
Labor hours = 40 hours
Labor cost = $3,000
This is reflected as point C in the figure. If we must add another expert to the activity, then we discover at point D in the drawing that total time may be compressed, but labor hours and costs increase because the additional communication and complexity may reduce the team’s efficiency in completing the task. Point E carries this example further to show what is likely to happen when management assigns three staff members to perform an activity that could most efficiently be done by a single worker without interruption. Points A and B indicate what happens when staff members are assigned to multiple activities simultaneously—they become increasingly less productive with each newly assigned activity. The empirical results of the trade-off are shown in Figure 6-3.
Figure 6-2 Time/Cost/Resource Trade-Off Curve.
Considering Risk in Estimating: Using Three-Point Estimates
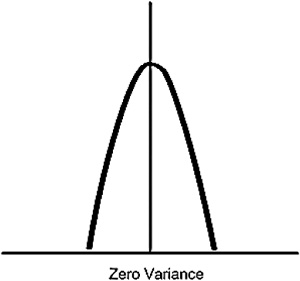
The time, cost, and resource estimates for a work package should reflect the degree of risk associated with that activity. If an activity is well understood, familiar to practitioners, routinely done, and frequently recalibrated to reflect best practices, then the estimate for the work package should consider a low-risk factor. The distribution pattern of a low-risk item (see Figure 6-4) is spiked at or near variance of zero, with neither left nor right skew. Activities with this low risk level are often found in estimating handbooks or guidelines for auto repairs and construction.
Figure 6-3 Time/Cost/Resource Trade-Off Data Points.
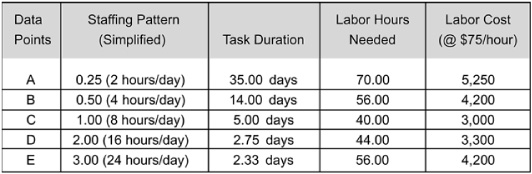
Figure 6-4 Distribution Pattern of a Low-Risk Item.
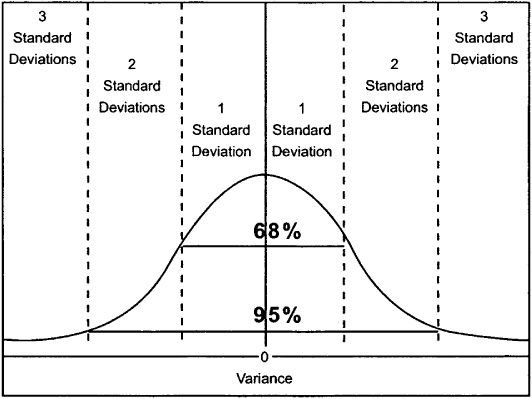
If the work package is somewhat well understood but still has important variables that could influence its outcome, then you should use a normal distribution as the underlying model for estimating. This distribution is illustrated in Figure 6-5, along with its indications for three standard deviations from the mean. This diagram shows that 95 times out of 100 the predicted outcome or estimate occurs within two standard deviations of the (arithmetic) mean. The most likely outcome takes up four estimating zones in the curve. Best-case and worst-case outcomes occur far less frequently—roughly once in every twenty instances.
Figure 6-5 Normal Distribution Curve.
This distribution gives rise to the program evaluation and review technique (PERT), which is a weighted-average estimating equation. This equation requires you to gather three estimates: a most likely estimate (given what you expect to happen), an optimistic estimate (if everything goes very well), and a pessimistic estimate (if things go poorly). You then combine the three estimates to calculate the average expected duration or cost for the activity, using the following formula:
estimated time = [optimistic + (4 × most likely) + pessimistic]/6
This weighted estimate accounts for the uncertainty and variability inherent in project work and provides a risk-adjusted estimate. It works equally well for both time and cost estimates.
Precision of Estimates
In early planning, you might be asked to provide a preliminary or conceptual estimate, also called an order-of-magnitude estimate. This level of estimate is usually –25 percent to +75 percent. Thus, the range of the order-of-magnitude for a $50,000 estimate would be $37,500 to $87,500. Later, at the project approval stage when more definition is available, you might be asked for a budget estimate, which usually ranges from –10 percent to +25 percent. During project planning, when well-defined specifications are available for individual activities, you might need to provide definitive estimates that can be used for bid proposals or contract negotiations. Definitive estimates usually use a bottom-up approach, and typically range from –5 percent to +10 percent.
The more specific the details, the better the estimate, and therefore the greater the chance of meeting the project objectives. However, the greater the detail, the greater the cost and time to get the estimate and the less time and budget will be left to accomplish the project.
To increase the accuracy and consistency of your estimates, you might want to:
![]() Use several independent techniques and sources.
Use several independent techniques and sources.
![]() Compare and iterate estimates.
Compare and iterate estimates.
For example, you might ask two independent groups to use the same estimating method, or one group to use two different methods. Investigate the differences among the estimates and adjust the estimating approach to what is appropriate for your project. An analysis after the project is important to determine whether your approach was valid. This helps you learn from each project and produce a better estimate on the next.
Duration-Based vs. Resource-Based Estimates
When creating estimates, consider whether the activity is duration-based or resource-based.
A duration-based activity has a defined duration for completion, independent of the number of people assigned to work on it. Examples include laboratory experiments to grow specific tumors in mice, auto travel, or curing cement (once poured, it takes forty-eight hours to cure). Adding staff does not compress the schedule but may add considerably to labor costs.
A resource-based activity may be compressed in duration by adding staff. However, beyond a reasonable point, costs and risks may rise.
Building Contingency in Estimates
Increasingly, project managers are asked to create aggressive schedules with limited or untested resources. They are pressured to prepare or accept estimates that are driven by political rather than technical considerations. It is best practice to build in some tolerance or contingency when establishing the budget and duration of a project or even, in some cases, individual activities. Building contingency into project schedules and budgets brings an element of reality into project management. This contingency provides leeway for unforeseen factors that inevitably will occur in any project.
The amount of contingency to build into the project schedule and budget depends on the degree of risk or uncertainty of the project, as well as the industry and culture of your organization.
![]() Degree of Risk. In a project with high risk or uncertainty, it is typical to include more contingency in the schedules and budgets.
Degree of Risk. In a project with high risk or uncertainty, it is typical to include more contingency in the schedules and budgets.
![]() Industry Standards. Specific industries have commonly accepted levels of contingency. For example, engineering and construction companies may use these estimating guidelines:
Industry Standards. Specific industries have commonly accepted levels of contingency. For example, engineering and construction companies may use these estimating guidelines:
![]() Conceptual phase: +50 percent
Conceptual phase: +50 percent
![]() Preliminary engineering phase: +25 percent
Preliminary engineering phase: +25 percent
![]() Detailed engineering phase: +10 percent
Detailed engineering phase: +10 percent
![]() Construction phase: +5–7 percent
Construction phase: +5–7 percent
![]() Culture of Your Organization. For example, your organization may allow a tolerance level of “plus or minus 10 percent” in project budgets, meaning that you may overrun a budget by 10 percent without penalty. You would then need to judge whether this gives you enough tolerance in your project, or whether you need to build in additional contingency in the project budget.
Culture of Your Organization. For example, your organization may allow a tolerance level of “plus or minus 10 percent” in project budgets, meaning that you may overrun a budget by 10 percent without penalty. You would then need to judge whether this gives you enough tolerance in your project, or whether you need to build in additional contingency in the project budget.
Improving Estimates over Time
A good project management system improves the quality of estimates over time.
![]() Within a project, the confidence in your estimate should improve as your project progresses, because you have accomplished some tasks and have less work in front of you.
Within a project, the confidence in your estimate should improve as your project progresses, because you have accomplished some tasks and have less work in front of you.
![]() Across projects, you should be able to create more accurate estimates with each succeeding project because of lessons learned on previous projects.
Across projects, you should be able to create more accurate estimates with each succeeding project because of lessons learned on previous projects.