
CHAPTER 11
Monitoring and Controlling Projects
ONCE APPROVED, THE PROJECT management plan becomes the basis for implementation, which involves both the execution process and the monitoring and controlling process. The project plan is the roadmap for execution. The following are central precepts of project control:
![]() Work is authorized and performed according to the approved plan.
Work is authorized and performed according to the approved plan.
![]() Information is collected to determine the current status of the project.
Information is collected to determine the current status of the project.
![]() Variances between the plan and actual status are identified and analyzed.
Variances between the plan and actual status are identified and analyzed.
![]() Causes for the variances are identified.
Causes for the variances are identified.
![]() If necessary, corrective actions are developed and assessed.
If necessary, corrective actions are developed and assessed.
![]() Recommended corrective actions are reviewed, approved, and implemented.
Recommended corrective actions are reviewed, approved, and implemented.
![]() Project plans—including baselines—are updated and communicated.
Project plans—including baselines—are updated and communicated.
Establishing a Project Baseline as a Control Point
The baseline is the most recently approved version of the project plan. There are baselines for each side of the project triangle: cost (budget), schedule (time), and scope. When discussed together, they are often referred to as project performance baselines. The practice of controlling and documenting changes to the baseline project plan is referred to as project change management.
Measuring Performance: Earned Value Analysis
Earned value analysis (also known as variance analysis) is a way to measure, evaluate, and control project performance. It compares the amount of work planned with what is actually accomplished to determine whether the project is on track. Earned value analysis uses various calculations and ratios to measure and report on the status and effectiveness of project work. Although earned value calculations are usually done by computer, it is important to know the basis of each calculation and understand what they mean.
The first step in earned value analysis is to determine the following three key values:
1. Planned value (PV) is the planned cost of work scheduled to be done in a given time period. The amount of PV is determined by totaling the cost estimates for the activities scheduled to be completed in the time period. Planned value is also called the budgeted cost of work scheduled (BCWS). This information is the base from which we later monitor progress, discern variances, and initiate corrective actions. Planned value answers the question “What did we think would happen by this date and how much did we think it would cost?”
2. Earned value (EV) is the planned cost of work actually performed in a given time period. This is a measure of the dollar value of the work actually performed. The amount of EV is determined by totaling the cost estimates for the activities that were actually completed in the time period. Earned value is also called the budgeted cost of work performed (BCWP). Earned value answers the question “What really happened up to this point and how much did we think it was going to cost?”
3. Actual cost (AC) is the cost incurred to complete the work that was actually performed in a given time period. The amount of AC is determined by totaling the expenditures for the work performed in a given time period. It should include only the types of costs included in the budget. For example, if indirect costs were not included in the budget, they should not be included in AC calculations. Actual cost is also called the actual cost of work performed (ACWP). Actual cost answers the question “What really happened up to this point and how much did it cost?”
Once these values are determined, you can use them in various combinations to provide measures of whether work is being accomplished as planned.
Schedule variance (SV = EV – PV). Schedule variance is determined by subtracting the planned value from the earned value. This calculation measures the difference between the planned and the actual work completed. A positive result means the project is ahead of schedule; a negative result means the project is behind schedule.
Cost variance (CV = EV – AC). Cost variance is determined by subtracting the actual cost from the earned value. It measures the difference between the planned (budgeted) cost and the actual cost of work completed. A positive result means the project is under budget; a negative result means the project is over budget.
Once these calculations are made, various indices or ratios can be used to evaluate the status and effectiveness of project work. These efficiency indicators provide valuable information that can be used to control the project. The two most commonly used indices are the schedule performance index and the cost performance index.
Schedule performance index (SPI = EV/PV). This is a ratio of work performed to work scheduled. The index is calculated by dividing the earned value by the planned value. This ratio is a measure of efficiency in the schedule. A value less than 1 means the project has accomplished less than what was planned and is behind schedule; a value greater than 1 means the project is ahead of schedule. Analyzing the SPI several times during the project provides an indication of how the project is performing compared to the project plan. This index may also be used to forecast the project completion date.
Cost performance index (CPI = EV/AC). This is a ratio of budgeted costs to actual costs. This index is calculated by dividing the earned value by the actual cost. This ratio is a measure of cost efficiency (how efficiently dollars are being spent). A value less than 1 means the work is costing more than planned; a value greater than 1 means the work is being produced for less than planned. For example, a CPI of 0.67 means that for each $1.00 spent on the project, we produce $0.67 worth of value. Analyzing the CPI several times during the project provides an indication of the project’s direction concerning costs.
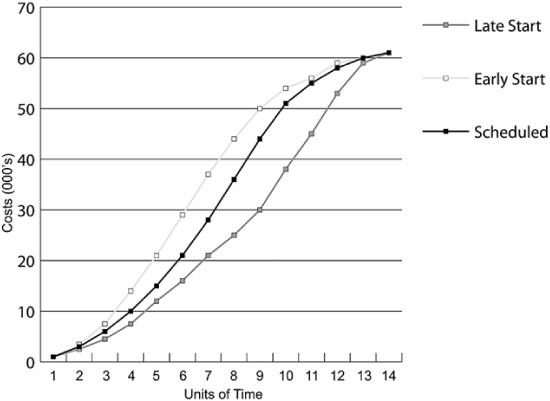
These indices provide a quick snapshot of the project’s efficiencies at a given point in time. However, they are more valuable when used periodically during the life of the project to track trends and take corrective action. These items can be displayed in reports, spreadsheets, histograms, or graphs. Figure 11-1 is a graph showing cumulative costs in terms of the planned value. Figure 11-2 shows the difference in cumulative costs based on early, scheduled, and late start dates.
Figure 11-1 Cumulative Costs Based on Planned Value.
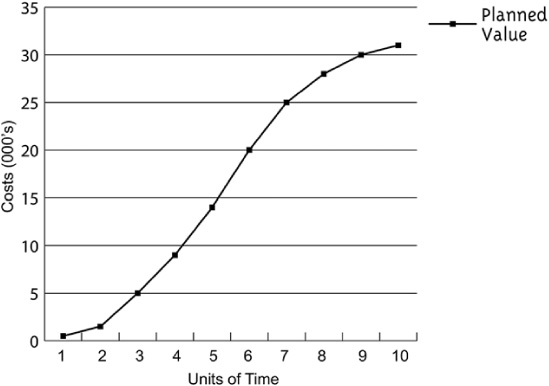
Figure 11-2 Cumulative Costs Based on Start Dates.
These indices also provide an element used in the following calculations to forecast the completion of the project:
Budget at completion (BAC) is the estimated total cost of the project when completed. It is calculated by totaling the cost of all activities outlined on the work breakdown structure.
Estimate to complete (ETC = (BAC – EV)/CPI). This is the expected additional cost needed to complete the project. It is calculated by subtracting the earned value (EV) from the budget at completion (BAC), then dividing the result by the cost performance index (CPI). This estimate shows the expected additional cost needed to finish the project, including adjustments to the BAC based on project performance to date.
Estimate at completion (EAC = AC + ETC). This is the expected total cost of the project when completed. It is calculated by adding the actual cost (AC) and the estimate to complete (ETC). This estimate includes adjustments to the BAC based on performance to date.