CHAPTER 8
Identifying Resources and Budgets
RESOURCE AND BUDGET PLANS are linked to project schedules. In practice, the schedule, budget, and resource plans are usually created simultaneously. The project team identifies for each activity the needed people, materials, equipment, supplies, travel, and other anticipated expenses. The project manager guides the planning team through the steps shown in Figure 8-1.
Identifying Resources
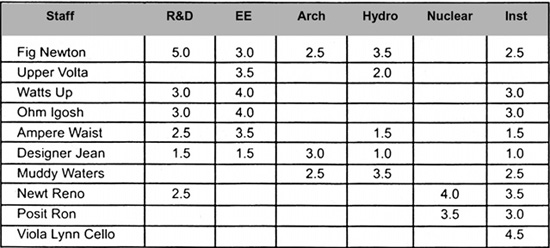
Let us look at the essential parts of a resource plan. The first thing we need to do is create an inventory of people and their skills. Figure 8-2 is an example with competencies shown on a scale of one to five (with five being the highest level of skill).
Fundamentally, resource plans show the need (or demand) for a person, a skill set, or other asset by work package and desired time frame. First, resource demands are applied at the activity level and then summarized to the project level. Thereafter, these demands are added to nonproject requirements for a particular resource or person to create the total demand across certain time periods. These resource requirement data can be shown as spreadsheets, histograms, or cumulative curves.
Figure 8-1 Planning Steps for Resource Planning and Budgeting.
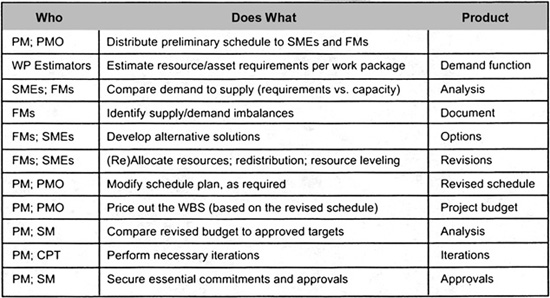
Figure 8-2 Enterprise Skills Inventory.
The first requirement is to identify the resources by name or type. Figure 8-3 shows a resource pool available for our illustrative project. Resources are then assigned to specific work packages, as shown in Figure 8-4.
Finally, we can illustrate the distribution of people to work packages in particular time frames. At this point in the planning process, project management software (typically) alerts us that resource demand exceeds resource supply. This imbalance may be shown in a table (see Figure 8-5) or in a histogram. For resource managers, the cells of the table are critical because they describe the anticipated distribution of people to activities on specific days or weeks. For the project manager, the perimeter cells are critical because they define total demand across all activities, skills, asset types, and time frames. When project and resource managers consider the need or demand for labor hours (or any asset or resource), a convenient way to display this information is a histogram. The next three figures indicate how histograms could be used.
Figure 8-6 depicts the need for a systems analyst over a ten-week period (presumably the life of the project). Notice that the plan requires this person to work eighty hours a week in weeks four and five, but only twenty hours in week six.
Figure 8-7 is a more complex diagram illustrating the planned distribution of time of one person who is assigned to multiple activities, not all of which are projects.
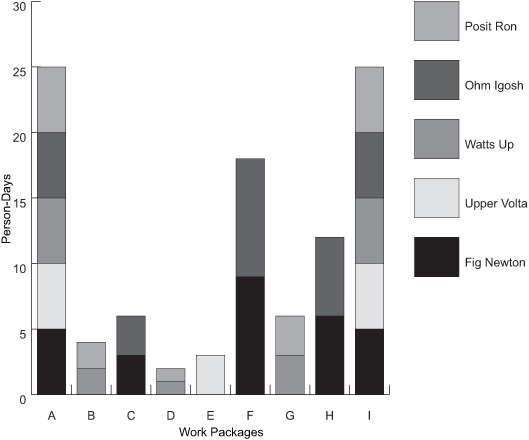
Figure 8-8 indicates which persons are assigned to specific work packages.
Balancing Resources
Resource imbalance is a central issue for project and resource managers. A recurring problem is that demand is often greater than supply (or requirements exceed capacity) for people, supplies, and equipment. This imbalance may arise in particular time frames or for particular work packages. This imbalance may be acute or chronic. All solutions require negotiating skills. The following are some actions that can be taken to alleviate the problem:
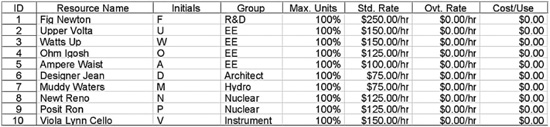
Figure 8-4 Resources Assigned to Work Packages.
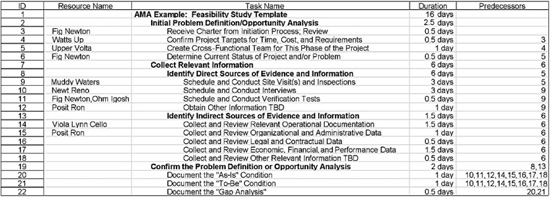
Figure 8-5 Resources Assigned to Work Packages (by Day).
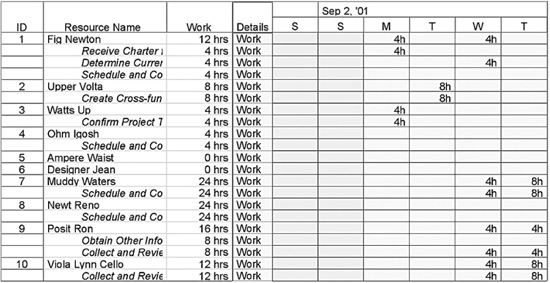
Figure 8-6 Resource Histogram.
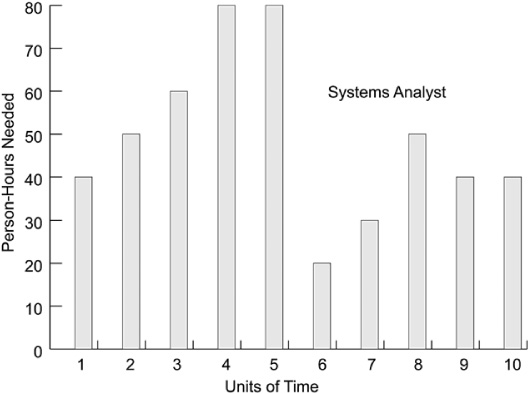
Figure 8-7 Distribution of a Single Resource Across Work Items.
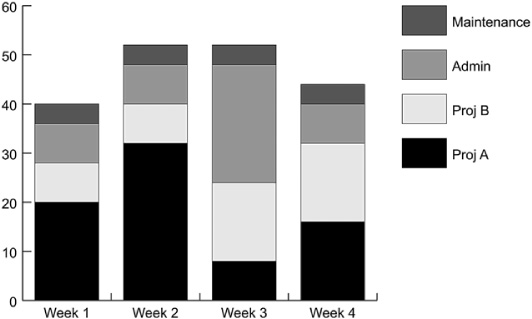
Figure 8-8 Distribution of Labor by Staff and Work Packages.
![]() Reduce the scope of the project.
Reduce the scope of the project.
![]() Extend the overall timeline by stretching out the work.
Extend the overall timeline by stretching out the work.
![]() Move activities (either in this project or in another project) with float to a time when people are available.
Move activities (either in this project or in another project) with float to a time when people are available.
![]() Defer other nonproject work.
Defer other nonproject work.
![]() Hire contractors or temporary help. Buy skills and deliverables. Assign nonproject personnel to the project.
Hire contractors or temporary help. Buy skills and deliverables. Assign nonproject personnel to the project.
![]() Adjust the time/cost/resource trade-off curve. Add people to compress time. Use your best people on high-risk activities. Assign fewer activities per person.
Adjust the time/cost/resource trade-off curve. Add people to compress time. Use your best people on high-risk activities. Assign fewer activities per person.
![]() Use overtime. Consider employees who are not compensated for overtime and instead grant them compensatory time for the overtime worked.
Use overtime. Consider employees who are not compensated for overtime and instead grant them compensatory time for the overtime worked.
![]() Take measures to improve productivity. Use special, one time incentives. These could be financial rewards or other motivators.
Take measures to improve productivity. Use special, one time incentives. These could be financial rewards or other motivators.
![]() Review estimates to see if time or cost savings are possible.
Review estimates to see if time or cost savings are possible.
![]() Redefine the work so that other available resources can perform it.
Redefine the work so that other available resources can perform it.
![]() Change the work order so that previously unavailable personnel are now available.
Change the work order so that previously unavailable personnel are now available.
Creating a Project Budget
The total project budget is the sum of work package estimates plus financial contingencies. When costs will be incurred over time, you can apply these costs at the beginning of the activity (“front-end loaded”) or at the end of the activity (“back-end loaded”). Alternatively, you may have these costs prorated over the activity’s time.
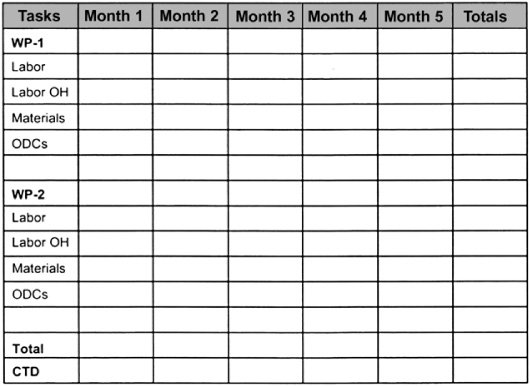
Project budgets are typically shown in spreadsheets, as illustrated in Figure 8-9. Costs are allocated to each work package by type of cost and by period of time. The cost plan prices out the work breakdown structure, considering costs by type, by time, and by activity. Include both direct and indirect costs. The plan should also reflect commitments and obligations, cash flows, disbursements, and revenue streams.
The budget overlays the time and resource plans. The ultimate aim is a plan-driven budget, not a budget-driven plan.
Figure 8-9 Project Budget Spreadsheet.