CHAPTER 5
LOOKING OUT FOR A POTENTIAL CHANGE TO THE UPSIDE FOR INTEREST RATES
After reading our case for a continued secular bull market in commodities and higher inflation in Chapter 4, the Smiths are probably wondering about the implications for their bond investments. Before we launch into a discussion on the long-term interest-rate trend change, a brief and basic primer of terms is useful. Often, inexperienced investors get lost in the jargon common to the investment world. The terms yield and interest rates are usually used interchangeably in bond discussions. There is a difference however. Interest rate is the return originally given to a debt instrument (bond or note) and once issued is generally fixed for the life of the debt instrument. This is often referred to as the “coupon rate.” The original interest rate is expressed as a percent of the principal amount of the bond. Once the bond trades in the marketplace, the price will fluctuate based on changes in general market conditions, credit rating changes, and interest-rate changes. This is the yield. But the world changes, and the value of the bond changes as interest rates change. So how does an existing or previously issued bond compete when new ones come to the marketplace at different interest rates? Its price and yield must adjust. The easiest way to visualize this process is to picture a teetertotter. Price is balanced at one end of the teeter-totter, and yield is at the other (Figure 5-1).

FIGURE 5-1 Bond Price to Yield Teeter-Totter
Bond prices go down as interest rates go up.
For example, if current market yields move up, the price of the bond will decline. When market yields drop, the price of the bond will rise. Importantly, the longer to the maturity, the bigger the price swings in bond prices. Thus long-term bonds have greater price volatility than shorter-term bonds. When we talk about the secular trend in prices or yields, keep in mind the teeter-totter diagram because it helps make the material easier to understand.
So what is the secular outlook for bonds, and how will it affect the Smiths’ portfolio? The secular bear market in stocks has benefited bondholders as many frustrated investors have fled to the “safe haven” of bonds. Interest rates continued to fall (bond prices continue to rise) from the high levels seen in 1981. This secular bull market has truly been a once in a lifetime event. Hindsight is 20/20, and looking back 30 years, U.S. government bonds yielding 15 percent were an incredible opportunity in 1981. However, at that time few people were inclined to take advantage of it. Instead, investors were afraid of falling bond prices and the inflation bogeyman that had ravaged bond portfolios the prior 40 years! Money market funds paid almost the same rate of return as long-term bonds but with daily liquidity and no principal risk, so why would anyone want to invest in bonds? As rates moved higher and higher, money fund yields tracked right along, keeping investor returns in line with the trend. We were managing portfolios at the time and have vivid memories of investor attitudes. The argument went something like this, “Why buy a bond, and take the risk of further losses if rates keep marching higher?” Tough for advisors to argue that point since bonds, on and off, had been losing money in client portfolios the prior 40 years. To help cope, brokers filled their trading days near year-end by providing an annual service called “tax-loss harvesting” to their beleaguered bond clients. By swapping an old bond at a loss into new bonds, clients could realize their capital tax loss, thereby reducing their tax liability. In essence, the strategy turned a paper loss into a real one. The extra portfolio activity surely helped bolster brokers’ commissions, making it a favored time of year for them, and it made the clients’ tax preparers happy too. Unfortunately for the client, each year their bond portfolio values were painfully eroded.
The annual bond tax-swap ritual is a thing of the past because it has not been needed for some time. Regrettably, we think bond investors will have to refamiliarize themselves with the old tax-loss harvesting technique during the course of this next decade. If a new secular bear market for bonds gets underway, it will be a real game-changer. As a first step let’s take a glance at U.S. government bond yields since 1860 because it will help us to identify long-term secular trend changes. The series plotted in Chart 5-1 is the U.S. government 30-year constant maturity (TYX) spliced to a 20-year series prior to 1994.
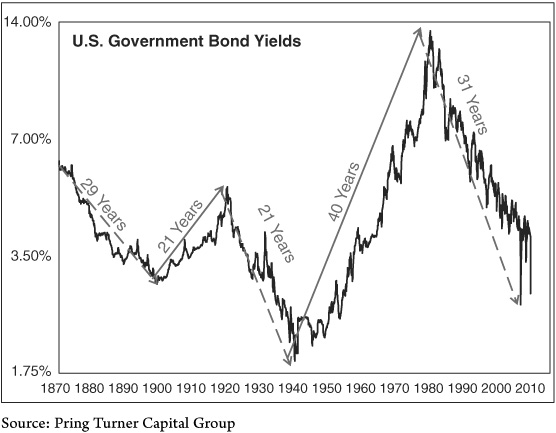
CHART 5-1 The Secular Trends in U.S. Government Bond Yields, 1870–2011
U.S. government bond yields have experienced a secular downtrend (bull market for bond prices) since 1981 (31 years). A potential secular turning point could be close at hand.
It is fairly evident that trends in bond yields are much better-behaved than their volatile commodity counterparts; this is beneficial to investors because it makes secular reversals relatively easier to identify. The arrows show the five secular trends since 1870. The two completed bear markets for bond prices (bull markets in yields) averaged 30 years, and the bull markets for bond prices (bear markets in yields) averaged 25 years. U.S. bond yields have been in a secular downtrend (bull market for bond prices) since 1981 or for about 31 years at the start of 2012. In terms of time served, this favorable bond trend is long in the tooth, which makes us believe that a potential turning point could be close at hand.
For the Smiths, who are in their early seventies, the 31-year secular decline in yields means that they have enjoyed a wonderful bull market in bonds during just about their entire investment lifetime. As interest rates steadily declined with each business cycle to lower and lower levels, bond prices appreciated. Any cyclical rise in yields was temporary and followed by successive new low-yield levels. Mortgage refinancing became a popular ritual for them and every other U.S. homeowner wishing to reduce monthly mortgage payments along the way. Their bond investments, whether in individual holdings with a specific maturity date or funds, produced steady income as well as capital growth as bond prices climbed. It was a one-way street to happy returns. Indeed, had the Smiths been exclusively exposed to bonds, during the last decade they would have completely missed two devastating bear markets in equities.
The point we are making is that the Smiths have spent a majority of their investment horizon in an environment of declining interest rates. Like every other investor of their time, they have known nothing else. Rising bond prices have become expected. High-quality bond instruments have earned the reputation of being virtually risk-free investments. Complacency and a false sense of security have set in, and this is a dangerous investment condition because it means that few, if any, are prepared for a reversal. History, though, tells a different story. The facts are that these secular swings do not last forever. Today conditions are ripe for a reversal to the upside for yields. The actual sting of higher and higher interest rates and a secular bear market with lower and lower bond prices has never been felt by most investors. Consequently, many are ill-prepared to face the challenges, and it is not likely that they will be able to adjust expectations when the very long-term trend changes.
The Implications for Investors of a Rising Secular Interest-Rate Trend
Between 2000 and 2011 bonds performed especially well in comparison to stocks as the secular bear market unfolded. Portfolios including a combination of stocks and bonds over the last 10 years witnessed poor equity performance but excellent bond returns. This combination generated positive returns despite volatile and poor overall stock performance. However, if a secular advance in yields gets underway, long-term bonds will decline in price and will no longer be a safe haven. Indeed, the next decade could end up being a lost decade for both stock and bond investors, a lethal combination investors have not had to experience since the 1960s and 1970s. Fortunately we developed the necessary tools that allowed us to survive and prosper in the 1970s, and we share them with you in the chapters ahead.
The various yield assumptions in Figure 5-2 help to emphasize that an unexpected advance in yields would be quite damaging to bond investors. For example, the rate on a 20-year government bond might rise from the (2.75 percent) level prevailing at the start of 2012 to just 5 percent over the next two years. If this happens, an original $100,000 investment including interest would fall to $78,830 for a 21.2 percent loss.
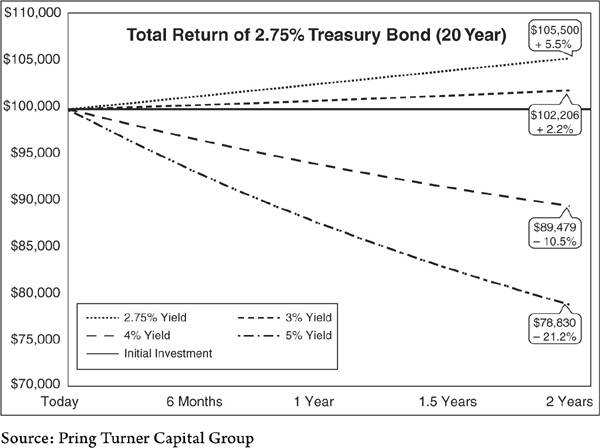
FIGURE 5-2 Higher Interest Rates Subject Bondholders to Principal Loss
Bond investors are subject to substantial principal loss as interest rates move higher.
Consider the massacre bond investors will suffer over a 10-, 20-, or 30-year secular bear market in bonds, as happened in the 1960s and 1970s. Today’s paltry coupon income provides little protection to offset price losses with even a small increase in interest rates. When secular declines in interest rates are experienced, investors’ future expectations are influenced because they become accustomed to the lower levels. It is easy to see why. If rates trade in the 3 to 4 percent range for several years, that level becomes the standard. It then becomes extremely difficult to imagine rates rising, even to their historical average of around 6 percent—the result would be a bloodbath of epic proportions.
The previous example showed a 20-year bond with a 2.75 percent coupon losing over 20 percent with just a modest interest-rate move to 5 percent in two years. Do you think that this is unlikely to happen? Please keep in mind that when 20-year yields were north of 15 percent in October 1981, the 10 percent level was unthinkably low. Fast-forward to May 1983 (just 19 months later) when rates actually were hovering around that “unthinkably” low level.
Why are we convinced that rates will rise in the coming decade? For that we need to talk about the principal driver of bond yields—the inflation rate. Inflation is important because investors demand a higher level of compensation when it is eating away at the purchasing power of their money. Bond investors generally require two components of return from their fixed income investments. The first is a risk premium. Mortgage companies, for example, will charge a higher rate to individuals with a low credit score than to those with a high one. Bond investors are no different. The second component, the inflation premium, is even more important to investors. This is because bond investors demand a full return not only on their principal but on the purchasing power of their principal. They are keenly aware of inflation risks and require returns that are above the inflation rate.
Thus, all this means that over time, there is a strong correlation between the trend of commodities, inflation, and bond yields. In fact commodity prices are a consistent leading indicator of bond yields. You are probably wondering why it works this way. In the early stages of a recovery, when the demand for inventories picks up, the balance between the demand and supply of commodities moves in favor of the demand side, so prices rise. Bond market participants notice that commodity prices are rising and anticipate that inflation is going to intensify. They start selling fixed income investments that struggle during inflationary environments; this pushes up yields. We cover the relationship between interest rates and inflation in greater detail when we drill down deeper into the business cycle in Chapter 6. For now, it is important to understand that higher inflation (commodity prices) leads to higher interest rates.
We can take this a step further by saying that commodity prices also have a strong tendency to lead yields at secular turning points. If the current secular trend for commodities is a rising one, bond yields ought to be moving in the same direction. Unfortunately, if interest rates are rising, bond prices are falling. With bonds declining in price and inflation eating away at their principal, investors face a double headwind. During the first decade of the current secular bear market in stocks, this was not a problem. Indeed, as explained earlier, bonds continued to rise during this time period and proved to be a safe haven for equity investors. Consequently, if the inflation scenario comes to pass, both stock and bond investors will find themselves under pressure, leaving commodities and inflation-sensitive equities as the only promising long-term games in town.
Identifying Secular Reversals in the Credit Markets
Throughout history U.S. bond yields have alternated between secular bull and bear trends just like stocks and commodities. History in this case goes back to the mid-nineteenth century. Since the financial crash of 2008, economists have debated whether the fiscal stimulus and extraordinary easy monetary policy (quantitative easing, QE I and II) would lead to a significant inflationary wave or whether the system would fall into a liquidity trap. A liquidity trap as defined in Keynesian economics develops when easy monetary policies are unable to stimulate an economy, either through lowering interest rates or increasing the money supply, thereby resulting in deflation. This is known as “pushing on a string.” Either way this would extend the secular bear market in equities. However, a liquidity trap would be bullish for high-quality bonds since it would imply cheaper commodities and weaker economic growth. Our objective here is not to dwell on the economic arguments, but rather to examine the secular trends of commodities, bonds, and their intermarket relationship to see what clues the markets themselves may be giving about the inflation/deflation outlook. One technique we use to identify secular trend reversals in interest rates is some really basic trend analysis, as shown in Chart 5-2.
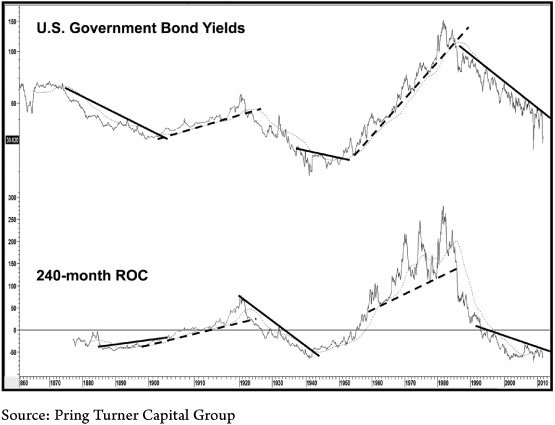
CHART 5-2 U.S. Government Bond Yields and Long-Term Momentum
At the start of 2012, bond yields and long-term momentum are at low levels and the secular downtrend in yields is still intact. However, a trend reversal may not be far away.
At this point it makes sense to make a few observations on trendline construction so that their characteristics can be appreciated. When we draw trendlines, our objective is to replicate the underlying trend. The more times a line has been touched or approached, the better it is as a reflector of the underlying trend. In addition, the longer the line, the bigger the trend being monitored and the more significant the eventual penetration. As you can see in the chart, this jagged indicator lends itself very nicely to trendline construction. When a meaningful long-term line has been penetrated, we get the first part of a two-part signal that the secular trend has reversed.
The idea with the rate of change (ROC) indicator in the bottom half of Chart 5-2 is to identify long-term swings in the cyclical rhythms. The second part of the signal comes when the yield itself confirms the momentum penetration with a trendline violation of its own. You can see from the chart how this very simple approach has resulted in four excellent secular reversal signals. Not all long-term trends have a convenient setup such as this, but in the second decade of this century we are most fortunate in this respect. This is because it is possible to construct a really meaningful down trendline for the yield that started in the early 1980s. We also see a nice trendline on the ROC indicator. Again at the start of 2012 both series remain intact, indicating that the secular downtrend in yields or the secular uptrend in bond prices remains alive and well.
There is one more useful signal triggering mechanism, and that is where we relate a 9-month exponential moving average (EMA) of the yield to its 96-month (8-year) exponential moving average. An exponential series is basically the same as a simple moving average except that its construction weights nearby observations more heavily so it turns quicker. Bearish periods, when the shorter-term EMA is below its longer-term counterpart, are represented in Chart 5-3 by the dark highlight for the yield.
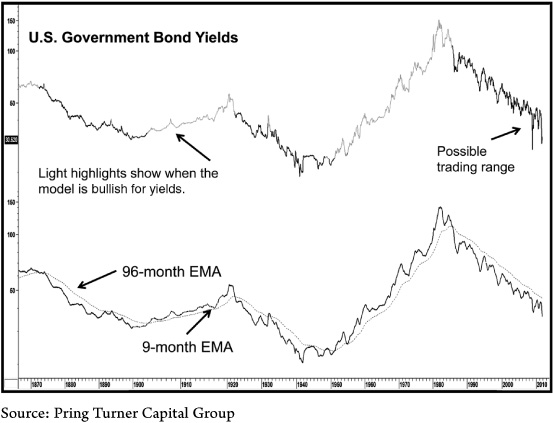
CHART 5-3 U.S. Government Bond Yields and a Secular Trend Indicator
A reversal in this secular trend indicator has not yet been signaled, but it would indicate a secular trend change for bonds from good to bad.
Light highlights signal when the model is bullish for yields. To be sure, this approach has experienced some whipsaws or false signals in the last 150 years, such as the false upside breaks in 1890s and 1930s. However, this relationship has been extremely well-behaved in the several decades preceding 2012; the last false signal was seen in the 1950s. It has certainly been the case since the early 1980s that the 9-month EMA has traded below the 96-month EMA on a consistent basis. You can probably see this more clearly from the lower panel in the chart, which features both averages. Many attempts have been made at an upside crossover, but each attempt has failed. This consistent inability to trigger a reversal increases the significance of the 96-month EMA as a dynamic resistance area. What this means is that when a positive crossover does finally materialize, it is likely to represent an accurate signal that the secular downtrend has reversed. When the (EMA/trendline) zone is finally cracked, we believe it will signal an end to the current secular downtrend in yields (bull market for bond prices). At the start of 2012 the trendline and moving average were around 4.4 percent for the 30-year bond.
We have emphasized the fact that bond yields historically have moved in long-term trends, both up and down, which is the case the vast majority of the time. However, if you study Chart 5-3 closely, you will see that yields often experience extended trading ranges at secular lows prior to the uptrend getting under way. This was true, for example, between 1886 and 1906 and more recently for the 11 years between 1939 and 1951. In other words, if the massive monetary stimulation following the 2007–2008 recession fails to immediately translate into inflation because of the debt overhang problem discussed earlier, we could well be in for a bout of deflation and stable rates at lower levels prior to the next secular upswing of inflation.
Our feeling is that if a deflationary outcome does develop as the second decade in the century unfolds, it will be temporary and will eventually give way to an inflationary one as has always been the case in the past.
Commodities Lead Bond Yields at Secular Lows
The vast majority of the time the secular trends of commodity prices and bond yields move in the same direction. Therefore, as a general rule if commodity prices are in a sustainable uptrend, bond yields will be in one as well. There is evidence that commodities lead bonds at secular turning points (Chart 5-4).
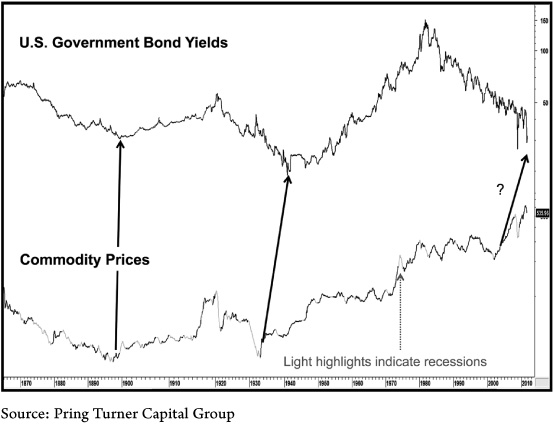
CHART 5-4 U.S. Government Bond Yields Compared to Commodity Prices
Commodity prices lead bond yields at secular turning points. Will the 2001 secular low in commodities lead to substantially higher government bond yields once again?
The two previous secular bull markets in bond yields were preceded by a secular low in commodity prices. Are commodities going to lead yields once again? Of course when we are limited to just two data points, we have to be careful about making projections. But the seven-year lead between the 2001 secular low in commodities and the late 2008 low for yields is certainly consistent with the two prior instances.
The Ultimate Inflation/Deflation Relationship
The ultimate inflation/deflation relationship in financial markets is between commodities and bonds as shown in Chart 5-5. When the ratio is rising, this indicates that commodities are outperforming bonds (inflationary); when it is falling, bonds are outperforming commodities (deflationary).
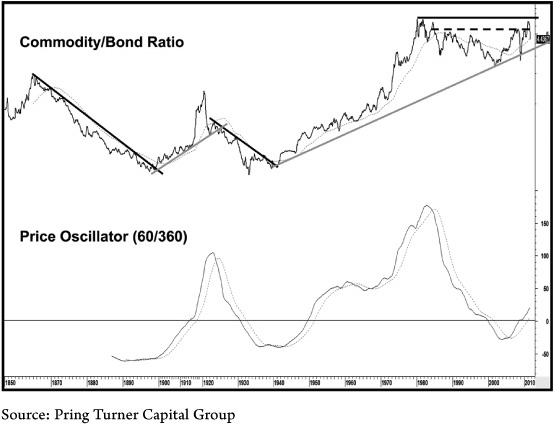
CHART 5-5 The Ultimate Inflation/Deflation Ratio
When the ratio is rising, commodities are outperforming bonds (inflationary), and when the ratio is falling, bonds are outperforming commodities (deflationary). The momentum oscillator of the ratio signals that commodities are in the early phase of outperformance over bonds.
Typically an advancing ratio means that commodities are rising and that bonds are falling; however, this is not always the case. Commodities and bonds could both be rising with commodities advancing at a faster clip than bonds, or they could both be falling with commodities declining at a slower pace. Trendline violations in the ratio can provide reliable and usually timely secular trend reversal signals. This relationship understandably alternates between secular trends of inflation and deflation. However, since 1980 it has been in a wide trading range, almost breaking out to the upside in 2011, but just failing to surpass the 1980 high. If a (dashed) trendline is constructed in a slightly different way, the case for a breakout could have been argued at the time, but as you can see, this soon turned out to be a false signal. If it finally does move above its post–1980 trading range, it should be treated as a major long-term inflationary signal since it would denote the outperformance of commodities over bonds for years to come. Note that the long-term momentum oscillator (constructed by dividing a 60-month by a 360-month moving average of the ratio) in the lower panel is in the early phase of an advance as measured by its level compared to the elevated readings seen at previous inflationary sell signals. The relatively subdued reading at the start of 2012 also supports the view of an eventual upside resolution of the 1980–201? trading range in the commodity/bond ratio.
Finally, Chart 5-6 shows that secular trendline violations in the commodity/bond ratio have usually led to or coincided with trendline violations in the 20-year government bond yield series. Currently the trend for yields is down, and the 30-year trading range for the ratio is intact. However, we do have two very actionable points that when penetrated will strongly signal that an inflationary trend is underway.
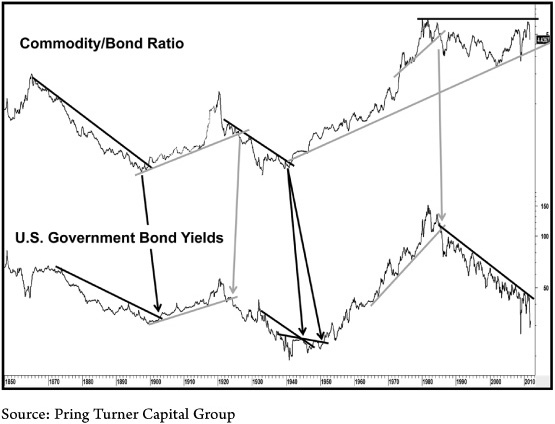
CHART 5-6 The Ultimate Inflation/Deflation Ratio Versus Bond Yields
A strong inflationary trend will get underway should each of these series break out to the side. Bond owners should be on high alert and prepared to change tactics.
Final Observations
Obviously our secular trend reversal signals have not yet been given, so we assume that the downtrend that began in 1981 is still intact. However, a piece of anecdotal evidence arguing in favor of a major peak in bond prices comes from the fact, not surprisingly, that markets usually reach their peak of popularity at their highest point. At the culmination of the 1982–2000 secular bull market in stocks the Fidelity Magellan Fund (a stock fund) was the largest mutual fund in the world. In 2012 the largest mutual fund in the world is the PIMCO Total Return Fund—a bond fund! Perhaps when we get to the end of the secular bull market for commodities, the largest fund in the world will be commodity-related. Will precious metals, energy, or agricultural-related assets be the favored investment area as we approach a commodity secular top? Only time will tell, but our guess is that money will eventually flow from today’s favorite (bonds) to commodities as the secular trends play out. After all, that is what human nature is all about. As individuals, we love to copy what the crowd is doing because that makes us feel comfortable. Prices consistently moving up for an extended period adds to our confidence, so at the final turning point we find forecasts and projections that would have seemed laughable at the beginning of the trend to be quite credible. With everyone around us expecting the same thing, it is very, no, extremely difficult to go against what has by now become conventional wisdom. This is what a secular turning point in commodities will be like.
But what of the secular bear market in yields (bull market in bond prices)? As stated earlier, the bull market in bonds is likely on its last legs. Certainly many of the long-term indicators are in position to signal the next reversal. U.S. financial history suggests that secular commodity price lows precede secular bottoms in interest rates. This is certainly consistent with the environment as the second decade of the twenty-first century is getting underway, considering that commodities bottomed in 2001. Once 30-year government bond yields give us a signal by breaking above 4.40 percent, your investment portfolio had better be prepared for substantially higher interest rates (lower bond prices), higher commodity prices, and an extension of the secular bear market in equities. While a new secular trend of rising rates will likely result in a substantial rise because it is a secular reversal, the trend will likely take place over the course of many decades.
This is the very subtle nature of secular trends; they creep up on you. However, in the early years following the reversal in trend, the rise in yields and commensurate decline in bond prices will present the kind of headwind investors have not experienced for many decades. Finally, when we look back at previous secular lows, we find that interest rates do not usually reverse on a dime but undergo an extended trading range spanning many years. If we assume that a trading range started in 2007 just prior to the financial crisis, it is quite credible that this trendless action could extend until the mid-part of the decade before rates and commodities take off on their respective secular bulls. We obviously cannot know this for sure. As long as the 30-year government yield remains below its 2007 levels, we will not have the evidence we need. In the meantime being forewarned and forearmed with this knowledge will make you better prepared for the investment battle that lies ahead. Now more than ever you cannot afford to sit back and relax, but you should prepare an investment plan for the second lost decade ahead bearing in mind the various possibilities.
KEY POINTS
1. As of the start of 2012, bonds have been in a 31-year secular bull market—investors must be on the alert for an important reversal.
2. Even a small rise in interest rates from these very low levels can lead to substantial bond portfolio losses.
3. An important intermarket relationship between commodities and bonds is in a massive trading range, but positive long-term momentum suggests that commodities will eventually win this battle.
4. Should the secular trend change be confirmed, you should adopt a more defensive approach in your bond portfolio tactics.
IMPORTANT QUESTIONS FROM THE SMITHS
What are the tactics we should use to protect our portfolio from a secular bear market in bonds when it happens?
Bonds come in many different forms—corporates, municipals, foreign, floaters, agencies, inflation-protected, and governments. For now let’s focus on the U.S. Treasury market—the one asset class in the world considered the risk free safe haven. Can we still make that assessment? As previously discussed, the secular bull market for bonds has been going on for 31 years and is certainly getting long in the tooth. As of the beginning of 2012, 10-year yields are below 2 percent with 30-year yields at generational lows below 3 percent. Interestingly enough, these rather historic low yield levels were first reached in the summer of 2011 shortly after the Standard & Poor’s rating agency decided to reduce the quality rating on Treasuries for the first time ever. The historic downgrade, issued in part because of concerns about the massive structural U.S. budget imbalances, moved the safety rating from AAA to AA. With some thanks to investor concerns over European sovereign debt problems and Dr. Ben Bernanke’s Federal Reserve policies, bond yields ignored the news and declined, while prices climbed higher. How much longer will the secular bull market for bonds last? Is the U.S. Treasury market in a bubble? Nobody knows, but what we do know is that it is getting late in the secular trend and it makes sense to be on the alert for a potential trend change. In the meantime, what tactics can help protect bond portfolios?
A trend change away from the favorable environment for bond prices will require investors to carefully reevaluate their bond strategy since they will be faced with potentially devastating capital losses. This will involve both tactical and strategic portfolio adjustments. Basic changes for a hostile bond environment include: (1) reducing bond allocation percentage, (2) decreasing the average maturity of the bond portfolio, and (3) increasing exposure to inflation-sensitive investments to partially hedge the fixed income portion of the portfolio. One method for reducing the average maturity is to execute a short-term bond ladder that ensures full return of capital within a shortened time frame. This laddering strategy enables the investor to continuously roll over maturing bonds at higher and higher rates and protect principal values. TIPS are Treasury inflation-protected securities, such as bonds, that do not pay much income, but principal values adjust to higher inflation rates. These bonds have not been around during wildly rising inflation periods, and in that sense they have not stood the test of time, but they do offer the investor an alternative to regular Treasuries and a fighting chance against inflationary periods. In addition, certain quality countries offer their own form of TIPS. For example, investments in Canadian and Australian inflation-protected securities offer inflation protection as well as a hedge against U.S. dollar weakness.
What are some income-producing alternatives to bonds?
In the search for yield, investors must find alternatives to U.S. Treasury bonds, and sometimes that may come from unexpected places. For instance, emerging market government bonds are perceived as being riskier than Treasury bonds, but is this true? Which country would you rather invest in? One with historically low yields, high and growing debt loads, slow growth, and an aging population? Or one with attractive yields, low debt loads, faster-growing economies, and a young workforce? We would argue that there is a place in portfolios for emerging market debt (some ETFs do this in either U.S. dollars or local currency forms). Another alternative is the corporate bond area, where there is a distinct yield advantage over Treasuries. The balance sheets of many corporations have improved in recent years to the extent that they are in better financial health than the public sector. Which would you prefer to own in your portfolio, Greek government bonds or IBM corporate bonds?
High yield corporates can be sensitive to stock market swings, but a case can be made for including a basket of lower-quality corporate bonds to portfolios for the yield boost. For those in higher tax brackets, municipal bonds show good value with yields at or above U.S. Treasuries and with the added advantage of being tax-free. In this respect we would caution investors to be very selective because not all municipals are created equal. A general rule of thumb is to focus on stronger issues like general obligation bonds. These are backed by full taxing powers and secured by tax revenues. Additionally “essential purpose revenue” bonds, backed by a revenue stream from an essential service (like water, sewer, and toll districts), are also deemed safe, especially compared to just about every other municipal bond.
At the other end of the spectrum there are plenty of IOUs and promises to pay types of issues where local council members or politicians are required to appropriate funds each year to make interest and principal payments. That’s not a terribly comforting feeling for investors considering the stress on municipal budgets recently. And of course, bond insurance is of virtually no value since many of the insurers have limited reserves to cover losses should a large default come along. If the underlying security is high quality, backed by tax revenues or stable revenue streams, and has insurance, then that is all well and good. But we wouldn’t recommend an issue just based on the insurance.
Finally, we recommend exposure to high-quality, dividend-paying stocks, especially from those companies with long histories of stable and rising dividends. Many global blue chip companies have higher yields (with growing dividend streams) than U.S. Treasuries. Patient investors with long-term time horizons will very likely do well relative to Treasuries from these low yield levels. These types of companies are considered “core holdings” for us and act as a stable foundation for conservative portfolios. Yes, from time to time they may experience sharp price declines temporarily, but in the longer run they should win out over Treasuries.
The last secular change for bonds from good to bad was in the 1940s. What caused it, and what would cause interest rates to start going up now?
Each secular change is unique and has its own reasons for establishing a long-term turning point. The next major trend change for bonds will also be different. In the case of the bond market in the 1940s, interest rates on Treasury yields had dropped precipitously during the deflationary period of the Great Depression and stayed at very low levels into the early 1940s. As World War II ended, the U.S. economy surged during the global rebuilding effort with U.S. manufacturers being one of the biggest beneficiaries. Additionally, as troops returned from the war to start new households, the homebuilding and consumer sectors of the economy ran at near full capacity. Eventually, the deflationary environment of the 1930s gave way to a post-WWII inflationary one as each business cycle saw higher and higher interest rates (and lower and lower bond prices). Massive government spending for the war and the printing of additional dollars to fund it eventually led to a rising interest-rate environment. Today’s concern is that the U.S. government (along with the Europeans) is in a similar position, printing more dollars to monetize excessive government debt levels that will ultimately lead to higher inflation and interest rates. Only time will tell exactly when that will occur, but one must be on the alert for signs of an important secular trend change for inflation, and this has vital consequences for bond investors.