CHAPTER 6
INTRODUCTION TO THE BUSINESS CYCLE
Harnessing business cycle knowledge is the most powerful tool an investor can utilize to successfully balance risk and reward in portfolios. Unfortunately, real-world knowledge and understanding of business cycles is greatly undervalued by consumers, business owners, and, most important, investors. How can you capture the power that changes in business activity provide? This chapter presents the practical value of applying basic business cycle knowledge to take advantage of profitable opportunities to enhance and protect personal net worth.
Earlier, in Chapter 2, we defined in the simplest terms what a business cycle is. First, in this chapter we further define and illustrate the typical four- to five-year business cycle. Second, we offer methods to identify where we are in the various stages or progress of business activity. Third, we demonstrate the usefulness of following business-cycle progress and how it can be used to make strategic asset allocation decisions.
What Is a Business Cycle?
Let’s start with the textbook definition of a business cycle as defined in Measuring Business Cycles by Arthur F. Burns and Wesley C. Mitchell (1946) and published by the National Bureau of Economic Research (NBER), which is the arbiter of dating the start and end of business cycles:
Business cycles are a type of fluctuation found in the aggregate economic activity of nations that organize their work mainly in business enterprises: a cycle consists of expansions occurring at about the same time in many economic activities, followed by similarly general recessions, contractions and revivals which merge into the expansion phase of the next cycle.
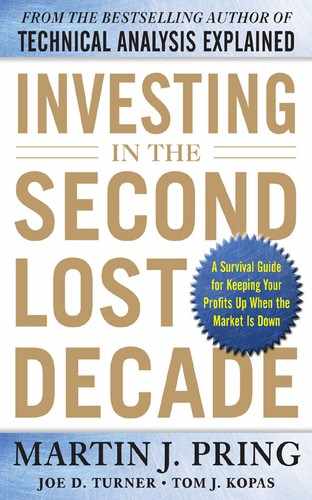
In other words, the business cycle is the normal, sequential, and repeated ups and downs of the economy. The simplest representation of it is a bell-shaped curve. The shape is simple and elegant and implies continuous change, with one cycle leading into the next (see Figure 6-1).
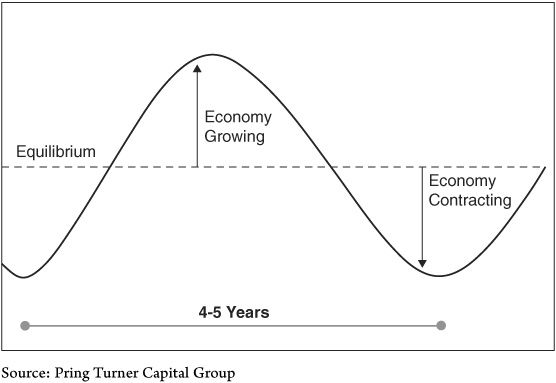
FIGURE 6-1 Typical Business Cycle
The simple bell-shaped curve illustrates continuous change in the economy with one cycle leading into the next. Investors can benefit by observing the normal, sequential, and repetitive nature of the economy.
The uphill (top) half of the curve implies the growth or expansion phase of the economy and historically lasts longer than the downhill (bottom) half. This a profitable time for companies, and the employment picture is bright. The bottom half of the bell-shaped curve, or contraction phase, is commonly referred to as a recession. A recession sees business activity shrinking. Sales and profits decline for corporations. As companies lay off employees, the unemployment rate climbs and household income declines. Recessions tend to expose, purge, and correct excesses that took place during the prior expansion. Both sides of a business cycle are self-adjusting or self-correcting mechanisms. For example, consumers who postponed spending on goods and services as long as they could during a recession must eventually replace worn-out goods, restock empty cupboards, and purchase deferred services. Once consumer spending begins again, low corporate inventory levels need to be replenished and hiring begins anew—the birth of the next business expansion. The business cycle is continuous and has repeated over and over since the United States became an industrialized nation in the mid-1800s.
Our observation is that it is natural for people (the media especially) to take any recent economic trend and extrapolate that condition indefinitely into the future. If the nation is in the throes of a recession, people extrapolate the country’s weak condition as though the recession will only worsen and never end. For instance, after months of bad news and a sinking stock market, you can imagine what negative emotions folks like the Smiths are experiencing. Concern, doubt, and paralyzing fear are deeply felt emotions that reflect a sense that the economy will never, ever recover. But just as day follows night, and negative emotions peak, the recession comes to an end and merges into the expansion phase of the next cycle. Times change as do economic leadership and news headlines, but human emotion around the business cycle will never change. We have witnessed stock investors being panicked and paralyzed near the bottom of a recession time and time again—just as the economy is about to turn up. By predicting economic turning points, investors can benefit greatly because the stock market is nothing more than fear and greed superimposed on the business cycle.
The exact opposite is also true at the top of business cycles when the belief and mantra is, “Business is great. Things couldn’t get any better.” Headlines will be rosy, unemployment low, and the talking heads on television will be looking at how high stock prices will go. Investors should take heed from such rosy conditions and forecasts. But instead of running from those words, they readily accept the rosy scenario and extrapolate that good times will go on forever. Never mind that at that point, the dependable and repeated history of business cycles demonstrates that investors should be looking for evidence of the cycle rolling over into the next slowdown and the arrival of the next bear market. The simplicity and beauty of keeping the bell-shaped curve of the business cycle in mind results in investors anticipating the next turning point in the cycle rather than their simply extrapolating recent conditions into the future.
A detailed historical analysis from the NBER (Table 6-1) indicates 33 completed business cycles dating back to the 1850s, when the United States first entered the industrial age. Understanding the sequences of the cycle allows investors to more carefully allocate assets around these four- to five-year cyclical swings in economic activity. The economy consists of indicators that lead us into the recovery (housing starts), those that coincide (nonfarm payrolls), and still others that follow behind (unemployment). Oftentimes housing will be moving up while some of the lagging indicators are declining, so what is this “economy” we are referring to? The answer is the indicators that move in the middle—the coincident indicators. In this respect GDP (gross domestic product) numbers would be a good start, so when we use the term “the economy,” that’s what we are referring to.
TABLE 6-1 NBER Business Cycle Reference Dates
The repetitive business cycle (ebb and flow of economic activity) sequence is a fact of life. Harnessing business cycle knowledge is the most powerful tool an investor can apply to portfolio management.
How Can an Investor Make Sense of the Economy?
Unfortunately in the real world the Smiths cannot count on the media or news sources to identify the prevailing stage of the business cycle. This is because the media tend to jumble the information flow around the economy and offer little help in understanding a useful sequence for putting the data in a sensible order. In fact, around crucial economic turning points the view of the media is likely to be wrong and unintentionally misleading. It is a good idea to look at the tangled knot of economic information for yourself, extract the important items, and try to place them properly in order of importance. Only then can that information be translated into a useful portfolio management strategy. Fortunately, thanks to a rich history of information going back over 150 years, it is possible to identify the sequence to the flow of financial and economic data. This can help you determine where we are on the bell-shaped curve.
If we just take a number of economic and financial indicators and overlay them on each other as shown in Chart 6-1, it looks like a real mess. But let us untangle the economic knot (as shown in Chart 6-2) and uncover the simple sequence of events that illustrates the progress a business cycle takes. Arrows are added to identify the sequential nature of the cycle, which now becomes more obvious. Solid arrows join the troughs, while dashed arrows connect the peaks. It should be noted that these are not the actual numbers but the indicators expressed as a deviation from trend or smoothed momentum. This is what gives a cyclic feel to the chart and puts us in a far better position to observe the logical, rational, and sequential turning points. Note that the slope of the arrows differs because the leads and lags change from cycle to cycle. The sequence is not perfect, but it repeats a majority of the time, and this is a tremendous advantage.
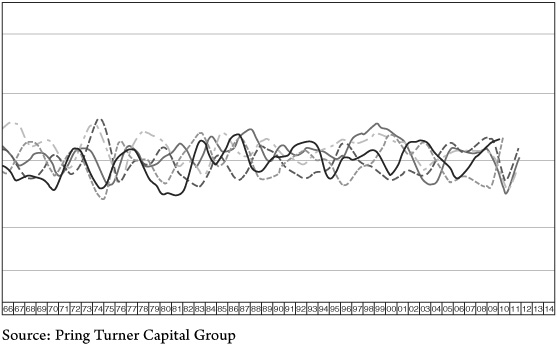
CHART 6-1 Random Noise of Economic News
Business activity is never smooth, and investors are continually bombarded with economic noise. How can an investor make sense of this tangled “economic Gordian knot”?
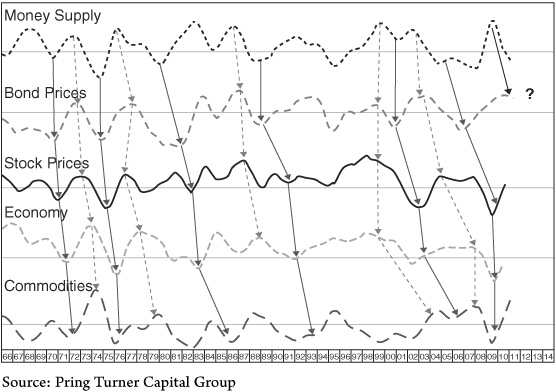
CHART 6-2 Real-World Business Cycle Sequence
Separating the momentum of economic indicators and placing them in sequence brings clarity to the random noise. Business cycle turning points are readily identified, and the next step can be forecast, giving investors an important edge.
The business cycle sequence starts with money supply—the grease that keeps the economy moving. Assume that the economy is in recession and that the Federal Reserve is acting to stimulate growth. It will use various tactics to stimulate the economy, all of which have the effect of injecting liquidity into the banking system. In turn this lowers the level of interest rates and raises bond prices After a lag, the next step sees common stock prices bottom. Investors start to sniff out the next recovery, and stock prices advance as investors make their purchases ahead of the actual turn in the economy. Eventually the expansion in money supply, lower interest rates, and newly developed optimism around a rising stock market lead to the next economic recovery.
After a period of stronger economic growth, commodity prices strengthen resulting from increased demand and a slightly tighter supply situation in most cases. Now all three asset classes are appreciating—first bonds, then stocks, and eventually commodities. If commodity prices and other symptoms of price inflation intensify to an unacceptably high level, the Federal Reserve will at some point decide to take the punch bowl away from the party and head off an inflationary spiral. This step, therefore, sees the supply of credit tighten a bit as the Fed moves to a less accommodating stance. Simultaneously the demand for credit in the form of bank loans starts to pick up. This tightening balance between supply and demand ultimately raises interest rates and lowers bond prices. Equities dislike rising rates because they eventually result in an economic slowdown or actual contraction. However, at this point rates are rising slowly but corporate profits are growing even more, so it’s a positive stage for stocks. As the rise in rates eventually accelerates, the economy will suffer and investors will start to foresee the next recession—just as they had anticipated the recovery. Stock investors will now factor in a potential recession or significant slowdown in the economic growth rate. Finally, as the economy slows, demand for raw materials declines and commodity prices peak and start to head lower. When it becomes evident that the economy is either slowing significantly or actually contracting, the Fed becomes more concerned about unemployment than inflation. Coming full circle, the next step will be to restimulate the economy once again, and a new business cycle begins.
How Can Business Cycle Awareness Be Useful?
Let us bring the Smiths back into the picture now that they have a better understanding and appreciation of the repetitive and sequential nature of business action. How can the Smiths use what they have learned to enhance their net worth and financial well-being?
The Smiths wear many different economic hats just like the rest of us do. They are consumers, spenders, savers, debtors, tax payers, business-people, and, most important, investors. For example, from a consumer point of view the best time to purchase a new vehicle is during a recession. This may sound counterintuitive, but during recessions auto manufacturers and dealers typically offer significant discounts or rebates, even zero percent financing on occasion. House prices are most attractive to a seller near the top of business cycles when optimism rules and prosperity is projected to go on forever. Home buyers will also find recessions to be favorable as pessimism and fear dominate sellers. Additionally this is the best time for homeowners to refinance and lower their mortgage rate, because interest rates have dropped. In contrast, the best time to lock in a favorable interest rate on a bank CD is just after the height of the cycle, when commodity prices have peaked but interest rates are still running wild on the upside.
Wouldn’t it make sense for business owners to track the business cycle? It could alert them to be cautious and build up cash reserves at its height. Then, when things take a turn for the worse, they can use that cash to acquire a deeply discounted competitor or expand their plant and equipment when others are experiencing hard times and are motivated to strike a good deal in order to keep as many of their workers employed as possible. Of course that’s easier said than done because business cycle peaks by definition are filled with extreme optimism. Therefore, it’s very difficult to go against the trend. Similarly, when things are bleak, it takes a great deal of courage to take positive actions against the pessimistic conventional wisdom and the invariably depressing headlines. Indeed, we can go so far as to say if you do not feel uncomfortable going against the conventional wisdom, it is probably because things are not bleak enough yet. By definition, if it is a true bottom, everyone will feel uncomfortable. However, this was the approach taken by steel magnate Andrew Carnegie in the nineteenth century and by such great investors as Warren Buffett because going against the crowd became second nature to them.
In a secular bear market, business cycle analysis becomes more important than ever. If the lessons of secular history play out, then the second decade of the twenty-first century will experience increased business cycle volatility similar to that in the 1970s. Our research shows that economic recoveries will be briefer and contractions more extended, which means that retirees like the Smiths will need to be more nimble and opportunistic during cyclical bull markets and far more defensive during the longer and deeper periods of economic contraction.
Hopefully you are now in a better position to understand how business cycle dynamics can help you form important asset allocation decisions that will improve performance and reduce risk. A better appreciation of the business cycle before the last decade would have helped a lot of people sidestep some of the carnage from the two recessions and twin 50 percent-plus bear markets. The word some is deliberately italicized because we do not want to give you the impression that there is a perfect world out there, where everything operates according to theory. This is just not the case. Remember, our objective is not to identify exact turning points in the expectancy that profits and opportunities can be maximized because that’s an investment mission impossible. What investors can do though is to try to smooth the rough edges. Just a couple of extra percentage points here and there each year will result in substantially greater long-term returns. Investing around the business cycle is your ticket to those annual incremental improvements in returns.
The next few chapters offer an expanded level of business cycle knowledge which will further your understanding of asset behavior around the typical cycle. We like to call it rational, logical, and sequential. With a deeper understanding of the sequences, we are confident that you will be able to make better investment decisions to build your portfolio values while taking less risk.
KEY POINTS
1. Markets have tracked business cycle sequences for over 150 years, basically since the industrialization of the economy.
2. Financial markets are linked rationally, logically, and sequentially to the business cycle.
3. Paying attention to the normal cyclical swings in the economy is an enormous help to investors, consumers, and business owners.
IMPORTANT QUESTIONS FROM THE SMITHS
We are concerned the business cycle doesn’t work anymore. There are so many influences on the economy and the markets that make today different. Isn’t it really different this time?
One of the benefits of studying business cycle history is the observation that if you go back far enough in time, you find that similar difficult periods have indeed happened. History is full of other episodes of financial crises, banking system meltdowns, government debt defaults, debt-deleveraging periods, and prolonged slow growth economies. Each secular bear period is unique, and its causes and circumstances differ. However, they are self-correcting mechanisms that clear the excesses of the prior bull period and set the stage for the next secular bull market to begin. The U.S. economy has demonstrated a tremendous ability to reboot, clean up past mistakes quickly, and reinvent itself. For investors, it is important to be able to observe the secular trend changes and then adopt new tactics to handle them. The last secular bear period in this country began in the 1960s, so it is easy to understand why many people may not be comfortable dealing with a deeply cyclical economy and market. Most of today’s active investors are too young or were paying little attention to market behavior 40-plus years ago, which is a principal reason why they are unprepared for the current difficult environment. Just remember though that however bad things were in the past, the system eventually self-corrected and set the path for the next recovery.